A test of ab initio-generated, radial intermolecular potential energy functions for five axially-symmetric, hydrogen-bonded complexes B⋯HF, where B = N2, CO, PH3, HCN and NH3
Received
5th January 2021
, Accepted 22nd February 2021
First published on 23rd February 2021
Abstract
The radial potential energy functions for five axially symmetric, hydrogen-bonded complexes B⋯HF (B = N2, CO, PH3, HCN and NH3) have been calculated ab initio at the explicitly correlated level of theory CCSD(T)(F12c)/cc-pVTZ-F12 as a function of the hydrogen-bond distance r(Z⋯H), where Z is the hydrogen-bond acceptor atom of B. The remaining geometric parameters were optimised at each point in the calculation. The functions so generated were then used to estimate the spectroscopic constants ωσ, ωσxσ,ασ, and the vσ = 1 ← 0 transition wavenumber associated with the intermolecular stretching mode νσ of each B⋯HF by using two equivalent approaches. Both involved the assumption that the vibrational modes of the B and HF molecules were sufficiently stiff relative to the intermolecular stretching mode that B⋯HF could be treated in a pseudo-diatomic approximation. One approach used derivatives of the potential evaluated at the distance r = re while the other used the potential constants obtained by non-linear regression fits of three analytical functions (Morse, Rydberg and Hulburt–Hirschfelder) to the ab initio calculated points. The two approaches would give exactly the same results if the functions were a perfect fit. The H–H function gave the best fit. The determined spectroscopic constants were found to be in reasonable agreement with the limited number available by experiment. The efficacy of the approach was tested for the diatomic molecule H35Cl by taking advantage of both an accurate RKR-type potential and an accurate set of spectroscopic constants. It was also established that the relationship De = kσ/(2a2) between two measures (De and kσ, both calculated ab initio) of the strength of the hydrogen bond in the B⋯HF complexes (and required if the H–H function were an accurate representation of the B⋯HF potential functions) holds to an excellent level of approximation, and supports the conclusion that this function is appropriate to represent the hydrogen bond in the complexes investigated.
1. Introduction
The aim of this article is to examine the radial potential energy function, that is the variation of the energy as a function of intermolecular distance, for some simple hydrogen-bonded complexes in the family B⋯HF, where B is a simple Lewis base. These functions will be calculated ab initio at a good level of theory, that is the CCSD(T)-F12c/cc-pVTZ-F12 level, which gives equilibrium dissociation energies De not too far from the complete basis set limit. The PE functions thereby obtained will then be fitted, via non-linear regression, to three simple analytical functions (initially proposed for diatomic molecules but used here with the internuclear distances of the diatomic molecules replaced by the intermolecular distances of the weakly bound complexes), namely the Morse function,1 the Rydberg function2 and the Hulburt–Hirschfelder (H–H) function.3 The aim is to find which gives the most accurate fit and therefore which is best as a model function for the Z⋯H hydrogen bond. The forms of these functions are given in eqn (1)–(3) for the Morse, Rydberg, and Hulburt–Hirschfelder versions, respectively.| | | V(x) = De − De[1 + bx]e−bx | (2) |
| | | V(x) = De[(1 − e−ax)2 + ca3x3e(−2ax)(1 + abx)] | (3) |
in which a, b and c are constants, x = (r − re), re is the equilibrium internuclear distance Z⋯HF (Z is the acceptor atom in B) and De is the equilibrium dissociation energy for the process B⋯HF = B + HF.
The hydrogen-bonded systems investigated were chosen for their simplicity and, importantly, because each is either a linear or a symmetric-top molecule with HF lying along the unique axis at equilibrium. This ensures that for each B⋯HF there is a clearly defined path along the extension of the symmetry axis that leads to dissociation into B and HF. The complexes selected were N2⋯HF,4–6 OC⋯HF,7–9 H3P⋯HF,10 HCN⋯HF11–13 and H3N⋯HF.14 Each has been investigated spectroscopically in isolation in the gas phase, all by rotational spectroscopy and some by high-resolution vibration–rotation spectroscopy, as revealed in the cited papers. The most fully examined is HCN⋯HF and it is this complex for which the calculations presented here are best tested by comparing a number of spectroscopically determined constants with those calculated from the analytical potential energy functions fitted to the numerical version obtained ab initio. It was noted15,16 previously that De for such complexes is, to reasonable approximation, directly proportional to the intermolecular stretching quadratic force constant kσ This is in fact a necessary consequence of all three functions if the constants a of Morse and Hulburt–Hirschfelder and b of Rydberg functions, do not vary much from molecule to molecule.
The fitting procedure and the level of theory used for the B⋯HF complexes will be tested initially against the accurate experimental potential energy function of the Rydberg-Klein Rees type for H35Cl as determined by Coxon and Hajigeorgiou.17
2. Theoretical methods
The energy of each of the complexes N2⋯HF, OC⋯HF, H3P⋯HF, HCN⋯HF and H3N⋯HF was calculated as a function of the distance r between the nucleus of acceptor atom Z of B and the proton of HF in increments of 0.05 Å, with either C∞v or C3v symmetry, as appropriate, maintained throughout. The calculations were carried out by using the MOLPRO package18,19 and employed the explicitly correlated CCSD(T)-F12c level of theory20,21 with cc-pVTZ-F12 basis functions.22 Tests using the counterpoise keyword showed that basis set superposition error (BSSE) is very small for such calculations. For example, the change in De for H3N⋯HF (the most strongly bound member of the series by far) from this source was only 0.6 kJ mol−1. Accordingly, BSSE corrections to the potential function calculations were not made. The calculation of the PE function for HCl was truncated at r = 3.2 Å to avoid spin contamination problems that occur as the Coulson–Fisher point23 in the internuclear distance is approached and thereby to allow the same level of theory to be used for all calculations reported here.
The intermolecular quadratic force constant kσ was obtained for each complex B⋯HF by fitting the potential energy curve V(r − re) versus r − re within ±0.1 Å of the equilibrium intermolecular distance re by a sixth-order polynomial and then evaluating the second derivative with respect to (r − re) at r = re.
3. Results
3.1 A test of the Morse, Rydberg and Hulburt–Hirschfelder functions with the RKR potential function of H35Cl
A very accurate potential energy function for H35Cl has been evaluated by Coxon and Hajigeorgiou17 by using the RKR method to give the energies at the classical turning points of the vibration for the vibrational states v = 0 to v = 20, the latter lying within only 18 cm−1 of the dissociation limit at De = 445.39 kJ mol−1 (37232.0 cm−1). This potential energy V(r − re) is plotted against (r − re), where re = 1.27454677(6) Å,17 in Fig. 1. The open circles mark the energies at the turning points. Also shown in Fig. 1 are the non-linear regression fits to the RKR points by a Morse function (dashed line) and a Rydberg function (continuous green line). It is clear that the Rydberg function gives a better fit than the Morse function, but that both functions begin to diverge from the RKR-type points beyond r = re and this becomes more significant beyond (r − re) > 1 Å. The constants De, a and b that result from these fits are recorded in Table 1 together with their standard errors. The largest residuals are: 9.1 kJ mol−1 for the Rydberg function fit and 12.0 kJ mol−1 for the Morse function fit. Also included in Table 1 are the values of De and re for H35Cl determined by Coxon and Hajigeorgiou.17 It is clear from Table 1 that both analytical functions overestimate De by about 2–5%. Fig. 2 shows the corresponding diagram for the fit of the H35Cl RKR- type data by the Hulburt–Hirschfeldr function. The continuous green curve is the fitted H–H function.
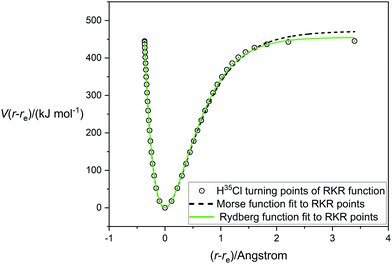 |
| | Fig. 1 The RKR-type potential energy function for H35Cl due to Coxon and Hajigeorgiou17 (open circles) fitted by a Morse function (dashed line) and a Rydberg function (green line). | |
Table 1 Parameters of the Morse, Rydberg and Hulburt–Hirschfelder function fits to the Coxon–Hajigeorgiou RKR-type potential energy functiona for H35Cl
| Parameter |
Morse function |
Rydberg function |
Hulburt–Hirschfelder function |
|
The best available value of De for H35Cl is 445.39 kJ mol−1, with re = 1.27454677(6) Å from ref. 17.
|
|
D
e/(kJ mol−1) |
471.9(25) |
454.8(1.7) |
455.1(1.7) |
|
a/Å−1 |
1.854(5) |
— |
1.838(8) |
|
b/Å−1 |
— |
2.704(5) |
3.51(68) |
|
c
|
— |
— |
0.042 (7) |
|
R
2
|
0.9982 |
0.9991 |
0.9997 |
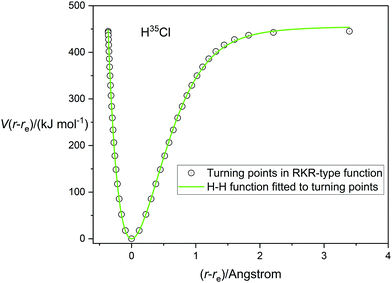 |
| | Fig. 2 The RKR-type potential energy function for H35Cl due to Coxon and Hajigeorgiou17 (open circles) fitted by a Hulburt–Hirschfelder function (continuous green line). | |
The determined parameters De, a, b and c from the non-linear regression fit are included in Table 1. All fitted points except the final one at (r − re) = 3.5 Å have residuals lying in the range ±5 kJ mol−1 for the H–H function fit, confirming its superior quality. This is reinforced by the standard errors of fitted parameters and R2, which is the usual goodness-of-fit measure for regression analyses, (see Table 1).
3.2 A fit of the Morse, Rydberg and Hulburt–Hirschfelder functions to the potential energy curve of HCl calculated at the CCSD(T)(F12c)/cc-pVTZ-F12 level of theory
Having tested the three types of analytical potential energy function with the aid of the high-quality RKR-type H35Cl experimental function, the version obtained ab initio by calculation at the CCSD(T)(F12c)/cc-pVTZ-F12 level of theory can be similarly scrutinized. Fig. 3 display this function, with points calculated every 0.05 Å in the range (r − re) = −0.4 to 1.8 Å and indicated by the open circles. The green continuous line again represents the non-linear regression fit of the Hulburt–Hirschfelder function to these points. The parameters of the fit are included in Table 2, together with those derived from the corresponding fits of the Morse function and the Rydberg function to the same calculated points. Recall that the CCSD(T)(F12c) calculation was not extended beyond (r − re) = 1.8 Å to avoid the effects of spin contamination that begin at the Coulson-Fischer point. Fig. 3 indicates that the Hulburt–Hirschfelder function provides a good fit to the ab initio calculated points. As with the fits to the RKR-type points for H35Cl, the obtained parameters for the Morse and Rydberg functions were less precise, as indicated by the R2 values. It is clear from Table 2 that although the De values have similar errors for all three analytical functions, those values are higher than the best experimental value from ref. 17. Fig. 4 makes the direct comparison of the RKR-type points for H35Cl with those calculated at the CCSD(T)(F12c)/cc-pVTZ-F12 level and illustrates visually that the ab initio potential function is in excellent agreement with the best available function.
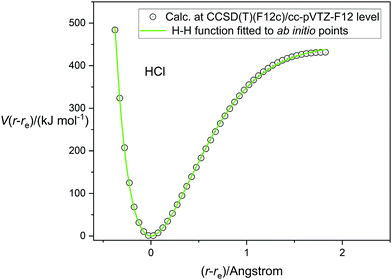 |
| | Fig. 3 The potential energy function of HCl calculated at the CCSD(T)(F12c)/cc-pVTZ-F12 level of theory (open circles) fitted by the Hulburt–Hirschfelder analytical function (continuous green line). | |
Table 2 Parameters of the Morse, Rydberg and Hulburt–Hirschfelder function fits to the potential function of HCl calculated ab initio at the CCSD(T)(F12c)/cc-pVTZ-F12 level of theory
| Parameter |
Morse function |
Rydberg function |
Hulburt–Hirschfelder function |
|
D
e/(kJ mol−1) |
484.4(16) |
461.4(17) |
455.3(24) |
|
a/Å−1 |
1.848(4) |
— |
1.818(8) |
|
b/Å−1 |
— |
2.710(7) |
4.37(78) |
|
c
|
— |
— |
0.045(7) |
|
R
2
|
0.9993 |
0.9991 |
0.9997 |
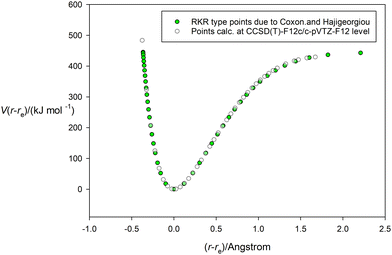 |
| | Fig. 4 Comparison of the potential energy curve for HCl calculated at the CCSD(T)(F12c)/cc-pVTZ-F12 level (unfilled circles) and that of the RKR-type due to Coxon and Hajigeorgiou17 (green-filled circles). | |
3.3 Calculation of spectroscopic properties of H35Cl from the RKR-type and CCSD(T)(F12c)/cc-pVTZ-F12 potential energy functions using derivatives of V(r − re) with respect to r, evaluated at r = re
It can be shown24 that, for diatomic molecules, the equilibrium spectroscopic wavenumbers ωe, and ωexe and the vibration–rotation constant αe are related to various derivatives of the potential energy function V(r − re) by eqn (4)–(6):| |  | (4) |
| |  | (5) |
| |  | (6) |
In these equations, V′′ is the second derivative of the potential function with respect to r evaluated at re, and so on, μ is the reduced mass of the diatomic molecule and c is the speed of light. The various derivatives were determined by fitting the points, calculated at 0.05 Å intervals, between 0.2 and −0.2 Å with a 7th order polynomial and differentiating the result with respect to r. The resulting values of ωe, ωexe and αe are given in Table 3 for the diatomic molecule H35Cl, both for the potential energy function of the RKR type due to Coxon and Hajigeorgiou17 and for that calculated at the CCSD(T)(F12c)/cc-pVTZ-F12 level. The purpose of this approach is to provide a calibration in the case where the equations are applied to a diatomic molecule. Experimental values of ωe, ωexe and αe for H35Cl are accurately known26 and are reproduced in Table 3. It is clear from Table 3 that, as expected, the Coxon–Hajigeorgiou RKR-type function leads to almost perfect reproduction of the experimental values of ωe, ωexe and αe for H35Cl. The ab initio calculated function also yields reasonably good agreement with the experimental values of ωe and ωexe but significantly underestimates αe.
Table 3 Spectroscopic properties associated with vibration in H35Cl and with the intermolecular stretching mode of the axially symmetric hydrogen-bonded complexes B⋯HF, where B = N2, CO, PH3, HCN and NH3. These properties were calculated from the derivatives of the V(r − re) function, the latter calculated at the CCSD(T)(F12c)/cc-pVTZ-F12 level of theory, in each case. For H35Cl, those obtained from the RKR-type function and experiment are also included
| Complex |
Spectroscopic property |
|
B
e/MHz (calc.)a |
r
e
/Å |
ω
σ
/cm−1 |
ω
σ
x
σ
/cm−1 |
α
σ
/MHz |
ν = 1 ← 0 wavenumber/cm−1 |
|
Calculated from the geometry optimised at the CCSD(T)(F12c)/cc-pVTZ-F12 level, except for H35Cl (RKR), which uses the experimental values of re and Be from ref. 25.
The subscript e (rather than σ) is appropriate for H35Cl quantities.
See ref. 25 for a collection of experimentally observed constants for H35Cl.
|
| H35Cl (experiment) |
317582.622 |
1.274552c |
2990.946c |
52.8186c |
9209.1c |
2885.31 |
| H35Cl (RKR) |
317582.622 |
1.274552 |
2991.1 |
53.2 |
9190.0 |
2884.0 |
| H35Cl (ab initio) |
316880.128 |
1.275964 |
2999.6 |
51.6 |
9127.5 |
2896.4 |
| N2⋯HF |
3302.814 |
2.087212 |
115.4 |
4.66 |
51.4 |
106.1 |
| OC⋯HF |
3125.996 |
2.090646 |
132.7 |
3.98 |
35.4 |
124.7 |
| H3P⋯HF |
3550.382 |
2.362105 |
134.2 |
2.97 |
45.9 |
128.3 |
| HCN⋯HF |
3619.792 |
1.853759 |
181.5 |
3.99 |
28.9 |
173.5 |
| H3N⋯HF |
7437.592 |
1.699216 |
254.0 |
4.19 |
59.3 |
245.6 |
3.4 Calculation of spectroscopic properties of the five complexes B⋯HF available from their CCSD(T)(F12c)/cc-pVTZ-F12 potential energy functions by using derivatives of V(r − re) with respect to r, evaluated at r = re
The potential energy curves V(r − re) versus (r − re) for the five complexes B⋯HF (B = N2, CO, PH3, HCN and NH3) calculated ab initio at the CCSD(T)(F12c)/ccpVTZ-F12 level are collected together in Fig. 5. The points, which were calculated at 0.05 Å intervals in r with geometry optimization at each, are not shown explicitly but are connected by a spline function to give continuous curves for clarity. The dissociation energies cover the range from ∼50 kJ mol−1 (H3N⋯HF) to ∼10 kJ mol−1 (for N2⋯HF). The spectroscopic properties ωe, ωexe and αe for the five complexes can be estimated by use of eqn (4)–(6), respectively. The required derivatives V′′ etc. were obtained by the method used for H35Cl, but a fit to a 6th order polynomial was sufficient. In applying eqn (4)–(6) to the B⋯HF complexes, there is an implicit assumption that the component molecules B and HF are sufficiently rigid, relative to the intermolecular hydrogen bond of the complexes examined, for these equations can be applied if μ = (mBmHF)/(mB + mHF) is used in place of the diatomic molecule reduced mass. In that case, the determined properties are written as ωσ, ωσxσ and ασ where the subscripts now indicate that they refer to the intermolecular stretching mode νσ of the complexes. This assumption is reasonable given the simplicity of the complexes and the large vibrational wavenumbers of B and HF compared with those calculated for the hydrogen-bond stretching mode νσ. The results obtained under this assumption are included in Table 3. Their comparison with such experimental quantities as are available for the B⋯HF will be postponed until Section 3.4.
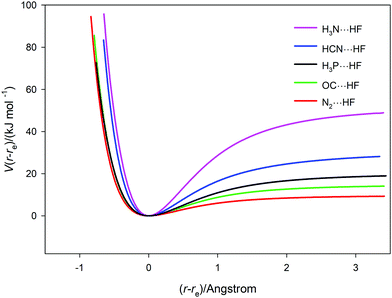 |
| | Fig. 5 Potential energy curves V(r − re) versus (r − re) for the five hydrogen-bonded complexes B⋯HF (B = N2, CO, PH3, HCN and NH3) calculated at 0.05 Å intervals, with geometry optimization at each point. The points (not shown explicitly) are joined by a spline function. | |
3.5 The fit of the Morse, Rydberg and Hulburt–Hirschfelder functions to the potential energy curves of the B⋯HF calculated at the CCSD(T)(F12c)/cc-pVTZ-F12 level of theory
The three analytical potential energy functions tested for HCl were next fitted to the ab initio calculated points for each of the five axially symmetric hydrogen-bonded complexes B⋯HF. The fits of each of the three functions (Morse, Rydberg and Hulburt–Hirschfelder) to the ab initio calculated points for HCN⋯HF are displayed in Fig. 6(a)–(c), respectively. The quality of fit to the Rydberg function is worse than that of the Morse function. As found for HCl, the Hulburt–Hirschfelder function provides the best fit to the CCSD(T)(F12c)/cc-pVTZ-F12 calculated points. This is clear from Table 4, which records the parameters obtained from a non-linear regression fit for each B⋯HF complex to each of the 3 analytical functions.
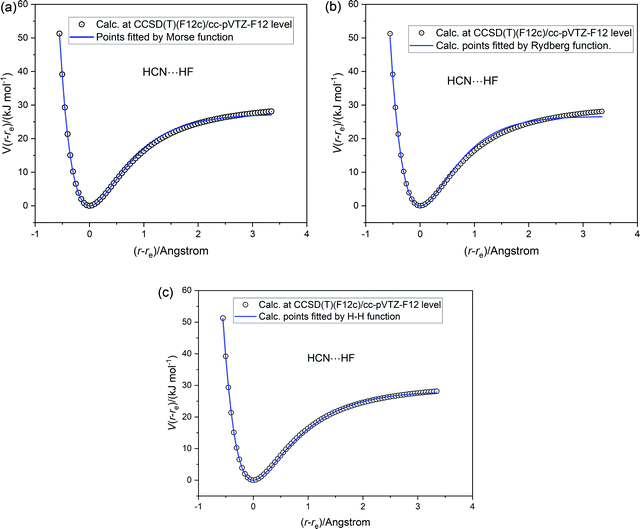 |
| | Fig. 6 Potential energy V(r − re) versus (r − re) for HCN⋯HF calculated at the CCSD(T)(F12c)/cc-pVTZ-F12 level (open circles). The continuous blue line is a non-linear regression fit to the ab initio calculated points by (a) a Morse function (b) a Rydberg function and (c) a Hulburt–Hirschfelder function. The parameters of the fits are included in Table 4. | |
Table 4 Constants of the Morse, Rydberg and Hulburt–Hirschfelder analytical potential energy functions obtained by fitting the V(r − re) versus (r − re) points generated at the CCSD(T)(F12c)/cc-pVTZ-F12 level of theory for axially-symmetric complexes B⋯HF
| Complex |
Morse function |
Rydberg function |
Hulbert–Hirschfelder function |
|
D
e/(kJ mol−1) |
a/Å −1 |
D
e/(kJ mol−1) |
b/Å −1 |
D
e/(kJ mol−1) |
a/Å−1 |
b
|
c
|
|
The values in this row refer to the Hulburt–Hirschfelder function fitted to the ab initio potential energy points generated with the HCN and HF geometries frozen at their values in the equilibrium complex (see text for discussion).
|
| N2⋯HF |
9.07(2) |
1.740(2) |
8.84(4) |
2.557(3) |
9.20(1) |
1.720(5) |
0.90(7) |
−0.067(4) |
| OC⋯HF |
13.96(5) |
1.583(2) |
13.56(5) |
2.334(3) |
14.02(2) |
1.603(3) |
1.29(10) |
−0.035(3) |
| H3P⋯HF |
18.87(3) |
1.441(2) |
18.35(6) |
2.101(3) |
19.02(2) |
1.447(2) |
1.69(12) |
−0.026(3) |
| HCN⋯HF |
27.35(9) |
1.556(4) |
26.64(14) |
2.263(11) |
28.04(5) |
1.545(5) |
1.20(9) |
−0.084(4) |
| HCN⋯HFa |
— |
— |
— |
— |
28.21(5) |
1.581(7) |
0.76(9) |
−0.120(5) |
| H3N⋯HF |
49.92(17) |
1.354(3) |
48.41(12) |
1.977(4) |
49.21(7) |
1.440(3) |
−1.14(16) |
0.042(3) |
In applying the Morse, Rydberg and Hulburt–Hirschfelder functions, all of which were proposed originally for diatomic molecules, to the five complexes B⋯HF, the assumption is again that the B and HF molecules are sufficiently rigid relative to the intermolecular hydrogen bond to allow the complexes to be treated in reasonable approximation as diatomic molecules. The fact that in each case the intermolecular non-covalent bond lies along the symmetry axis is a useful simplification. Fig. 7 compares the potential energy curve for HCN⋯HF, calculated as a function of the (r − re) (applying geometry optimization at each point), with that calculated when HCN and HF are frozen at the geometries they possess in the optimized equilibrium version of the complex. Both curves were calculated at the CCSD(T)(F12c)/cc-pVTZ-F12 level. It is clear that, apart for small differences on the repulsive part of the curves at small distance r(N⋯F), the two sets of points are almost coincident for (r − re) > −0.7 Å and de facto lie very close to the H–H fit to the relaxed function shown in Fig. 6(c).
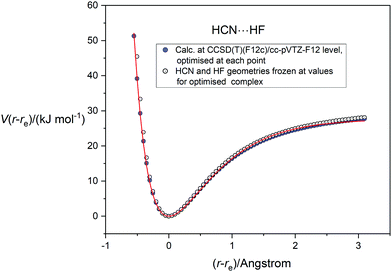 |
| | Fig. 7 Comparison of potential energy curve for HCN⋯HF calculated at the CCSD(T)(F12c)/cc-pVTZ-F12 level with geometry relaxation at each point (blue-filled circles) with that calculated at the same level of theory but with the HCN and HF geometries frozen at those appropriate to the equilibrium complex (open circles). The continuous red line is the Hulburt–Hirschfelder function fitted to the relaxed PE points. | |
To decide which, if any, of the three analytical potential energy functions is suitable as a model for the hydrogen bond in these axially symmetric complexes B⋯HF, one criterion must be the goodness of their fits to the ab initio-calculated functions. However, another important criterion is how well the fitted analytical functions predict spectroscopic properties associated with the intermolecular stretching mode σ, namely the equilibrium stretching wavenumbers ωσ and ωσxσ, the vibration–rotation constant ασ and the dissociation energy De, all of which can in principle be measured spectroscopically. HCN⋯HF is the most investigated of the five complexes B⋯HF selected for consideration here, but some of the spectroscopic constants are also available for OC⋯HF and N2⋯HF. Eqn (4)–(6), as set out in Section 3.2, allow ωσ, ωσxσ and ασ, respectively, to be obtained from the fitted parameters of each of the three analytical potential functions for each of the five complexes B⋯HF. As indicated earlier, these equations involve derivatives of the potential function with respect to r when evaluated at r = re. It has been established that the Hulburt–Hirschfelder function gives a better fit to the potential energy curves of the five B⋯HF complexes obtained through ab initio calculations at the CCSD(T)(F12c)/cc-pVTZ-F12 level of theory. Therefore, only the relationships between a, b and c of this function and ωσ, ωσxσ and ασ, will be considered here.
The results of evaluating eqn (4) and (5) for the Hulburt–Hirschfelder function are as follows:
| |  | (8) |
| |  | (9) |
Eqn (9) transforms to the corresponding expression obtained from the Morse function (see
ref. 23) when
b =
c = 0, as required.
It can be shown3,26 by use of eqn (6) that the vibration–rotation constant αe for a diatomic molecule is related to the constants a and c of the Hulburt–Hirschfelder potential energy function by
| |  | (10) |
where
Be is the equilibrium rotational constant. If the components B and HF of the complex can be assumed rigid and
eqn (10) is applied in that approximation, a route to
ασ is available because
Be is known from the
ab initio calculations described here.
Table 5 gives the values of
ωσ,
ωσxσ,
ασ, and the
vσ = 1 ← 0 transition wavenumber for the hydrogen-bond stretching mode
νσ. They were calculated from
eqn (8)–
(10) using the parameters
a,
b,
c of the Hulburt–Hirschfelder function (see
Table 4) obtained by fitting the
ab initio-generated potential energy curves for each of the five B⋯HF. Also in
Table 5 are the corresponding quantities for H
35Cl calculated (1) from fit of the H–H function to the Coxon–Hajigeorgiou RKR-type function,
17 and (2) from the fit of the H–H function to the CCSD(T)(F12c)/ccpVTZ-F12 points calculated here. The experimental values of the H
35Cl properties are also included in
Table 5 for convenience.
25 The agreement of these quantities with those obtained by fitting the RKR-type potential with the H–H function (see
Table 3) is reasonable, although
De is overestimated by about 2% while
ωe is underestimated by 0.5%. As might be expected the terms
ωexe and
αe for H
35Cl, which account for differences between equilibrium and zero-point vibrational and rotational constants, respectively, are more significantly in error, by 5% and 9%. The set of quantities for H
35Cl calculated from the potential energy function generated
ab initio and fitted by the H–H function, also given in
Table 4, are somewhat more in error, as might be expected.
Table 5 Spectroscopic constants associated with the intermolecular stretching mode of the axially symmetric hydrogen-bonded complexes B⋯HF, where B = N2, CO, PH3, HCN and NH3. The constants were calculated from the parameters of the Hulburt–Hirschfelder potential energy function fitted to the V(r − re) versus (r − re) curve, the latter generated at the CCSD(T)(F12c)/cc-pVTZ-F12 level of theory, in each case
| Complex |
Spectroscopic property |
|
B
e/MHz |
D
e/(kJ mol−1) |
ω
σ
/cm−1 |
ω
σ
x
σ
/cm−1 |
α
σ
/MHz |
v
σ = 1 ← 0 wavenumbera/cm−1 |
|
The subscript e (rather than σ) is appropriate for H35Cl quantities.
Ref. 25.
Ref. 17.
Ref. 6. De is semi-experimental estimate.
Ref. 6.
Predicted using a high-quality morphed potential function. Ref. 8.
Ref. 9.
From absolute intensity measurements in the rotational spectrum of HCN⋯HF. See ref. 11.
Ref. 12.
|
| H35Cl (fit to RKR) |
317582.622b |
455.3 |
2974.5 |
43.7 |
8410 |
2887.0 |
| H35Cl (ab initio) |
316880.128 |
455.1 |
2941.4 |
38.3 |
8295 |
2864.9 |
| N2⋯HF |
3302.814 |
9.20(1) |
114.7 |
4.91 |
53.9 |
104.9 |
| OC⋯HF |
3125.996 |
14.02(2) |
131.9 |
4.07 |
36.6 |
123.8 |
| H3P⋯HF |
3550.382 |
19.02(2) |
133.6 |
3.04 |
47.3 |
127.5 |
| HCN⋯HF |
3619.792 |
28.04(5) |
180.5 |
4.29 |
30.5 |
171.9 |
| H3N⋯HF |
7437.592 |
49.21(7) |
250.2 |
3.97 |
59.5 |
242.3 |
|
|
| Experimental |
| H35Cl |
317582.622a |
445.39c |
2990.946b |
52.8186b |
9209.1b |
2885.31 |
| N2⋯HF |
— |
8.97d |
— |
— |
— |
79.5e |
| OC⋯HF |
— |
15.67f |
108.7–114.5g |
3.79 |
— |
107.99(2)f |
| HCN⋯HF |
— |
26.1(16)g |
— |
— |
61.79(3)h |
197(15)g, 168.3(2)i |
The spectroscopic constants of the B⋯HF have been estimated by two equivalent approaches, both of which depend ultimately on eqn (4)–(6). Those in Table 3 result from the application of eqn (4)–(6) directly, while those in Table 5 were obtained by first fitting the H–H function to the ab initio calculated points and then applying eqn (8)–(10). If the H–H function were a perfect fit to the ab initio points, the two sets of values for the B⋯HF in Tables 3 and 5 would be identical. In fact the two sets are in reasonable agreement, an observation which confirms that the H–H function provides a good fit to the ab initio-generated potential functions.
Some of the properties of the B⋯HF given in Tables 3 and 5 can be compared with those available from experiment. Those members of the B⋯HF series for which gas-phase experimental investigations have been published are N2⋯HF,6 OC⋯HF8,9 and HCN⋯HF.11,12 Various of the calculated constants in Tables 3 and 5 have been accurately measured by rotational and high-resolution vibrational spectroscopy and their values are included in Table 5. The agreement between the calculated values and those obtained by experiment is satisfactory, except for ασ for HCN⋯HF, which, as was also noted for HCl in the preceding paragraph, is significantly underestimated. It thus appears that ab initio calculations at the CCSD(T)(F12c)/cc-pVTZ-F12 explicitly correlated level lead to a reasonably good representation of the radial potential energy function for the hydrogen-bond stretching mode in those axially symmetric complexes B⋯HF considered here. Certainly, the H–H function provides a good fit to the ab initio curves. If the same percentage errors in the various calculated properties found for HCl were to apply to the B⋯HF complexes, the agreement would appear better just because the quantities are generally smaller for the complexes.
An alternative approach to fitting the ab initio-calculated potential functions of the B⋯HF complexes by means of the Hulburt–Hirschfelder analytical function is worth investigating. This approach involves holding De fixed at its value calculated from the energies EB, EHF and EB⋯HF of the B, HF and B⋯HF geometries optimized at the CCSD(T)(F12c)/cc-pVTZ-F12 level. De is related to these energies by the equation
| | | De = EB⋯HF − EB − EHF, | (11) |
Counterpoise correction was applied to correct for BSSE. With
De so fixed, the remaining three parameters of the H–H function were fitted to the
ab initio potential curve for each B⋯HF to give the values of the constants
a,
b and
c recorded in
Table 6. These values have larger standard errors than those obtained by fitting all four parameters
De,
a,
b, and
c (see
Table 4), as expected. However, the numerical spectroscopic constants calculated from the them (
Table 7) are in good agreement with those shown in
Table 5, which were calculated from the H–H constants given in
Table 4.
Table 6 Constants of the Hulburt–Hirschfelder analytical potential energy function obtained by fitting the V(r − re) versus (r − re) points generated by calculations at the CCSD(T)(F12c)/cc-pVTZ-F12 level of theory. In these fits, De was held fixed at the value given by the ab initio calculations (see footnote) and a, b and c released
| Complex |
Hulbert–Hirschfelder function |
|
D
e
/(kJ mol−1) |
a/Å−1 |
b
|
c
|
|
Calculated from the CCSD(T)(F12c)/cc-pVTZ-F12 energies of B⋯HF, B and HF, after counterpoise correction, using the equation De = EB⋯HF − EB − EHF.
|
| N2⋯HF |
9.46 |
1.683(11) |
0.81(11) |
−0.115(7) |
| OC⋯HF |
14.49 |
1.558(7) |
0.873(74) |
−0.092(7) |
| H3P⋯HF |
19.84 |
1.404(8) |
1.01(11) |
−0.094(7) |
| HCN⋯HF |
30.70 |
1.433(22) |
0.81(15) |
−0.232(16) |
| H3N⋯HF |
51.61 |
1.392(10) |
3.76(81) |
−0.030(8) |
Table 7 Spectroscopic constants associated with the intermolecular stretching mode of the axially symmetric hydrogen-bonded complexes B⋯HF. The constants were calculated from the parameters a, b and c of Hulburt–Hirschfelder potential energy function fitted to the V(r − re) versus (r − re) curve with De fixed at its value calculated at the CCSD(T)(F12c)/cc-pVTZ-F12 level (see Table 6)
| Complex |
Spectroscopic property |
|
B
e
/MHz |
D
e
/(kJ mol−1) |
ω
σ/cm−1 |
ω
σ
x
σ/cm−1 |
α
σ/MHz |
v
σ = 1 ← 0 wavenumber/cm−1 |
|
Value of equilibrium rotational constant of most abundant isotopologue calculated at CCSD(T)(F12c)/cc-pVTZ-F12 level.
Calculated from the CCSD(T)(F12c)/cc-pVTZ-F12 energies of B⋯HF, B and HF, after counterpoise correction, using the equation De = EB⋯ClF − EB − EClF.
|
| N2⋯HF |
3302.814 |
9.46 |
113.8 |
5.12 |
56.0 |
103.6 |
| OC⋯HF |
3125.996 |
14.49 |
130.4 |
4.23 |
38.3 |
121.9 |
| H3P⋯HF |
3550.382 |
19.84 |
132.3 |
3.24 |
77.3 |
125.8 |
| HCN⋯HF |
3619.792 |
30.70 |
175.8 |
4.70 |
33.9 |
166.4 |
| H3N⋯HF |
7437.592 |
51.61 |
247.5 |
4.28 |
64.2 |
238.9 |
3.6 The relationship between De and kσ for the B⋯HF complexes
Eqn (7) shows the Hulburt–Hirschfelder function requires that De = kσ/2a2. Accurate kσ values are available, given (1) the definition kσ = V′′(re) (i.e. the second derivative of the potential evaluated at the minimum r = re) and (2) the fact that the region close to the minimum (i.e. ±0.1 Å about re in steps of 0.025 Å) of the CCSD(T)(F12c)/cc-pVTZ-F12 potential function of each B⋯HF complex can be fitted precisely to a 6th order polynomial (see Section 3.2) and kσ can then be obtained by differentiation. Moreover, De values at this level of theory have been evaluated as the difference between the energies of B⋯HF and B + HF, [see eqn (11)] after counterpoise correction (which is very small). The two sets of quantities are recorded in Table 8 for the five B⋯HF complexes investigated. According to eqn (11), if the Hulburt–Hirschfelder function were an exact fit for each of the five B⋯HF complexes, a plot of Deversus kσ/(2a2) would be a straight line of gradient 1.000 and intercept 0.000. Fig. 8 shows that such a plot is an excellent straight line, for which the linear regression fit leads to the gradient = 6.17(13) × 1023 mol−1 or 1.02(2) per molecule, with the intercept 0.005(15) kJ mol−1 and R2 = 0.9986. This result establishes with some accuracy that De = kσ/2a2 for the family of the five axially symmetric, hydrogen-bonded complexes B⋯HF, (B = N2,CO, PH3, HCN, NH3).
Table 8 Two measures (De and kσ) of binding strength for axially-symmetric, hydrogen-bonded complexes B⋯HF calculated at the CCSD(T)(F12c)/cc-pVTZ-F12 level
| Complex |
D
e
/kJ mol−1) |
k
σ
/(N m−1) |
|
Calculated from the CCSD(T)(F12c)/cc-pVTZ-F12 energies of B⋯HF, B and HF, after counterpoise correction, using the equation De = EB⋯ClF − EB − EClF.
Calculated from V′′(re) = kσ by fitting a polynomial around the minimum of the ab initio-calculated curves and differentiating.
|
| N2⋯HF |
9.46 |
9.15 |
| OC⋯HF |
14.49 |
12.11 |
| H3P⋯HF |
19.84 |
13.36 |
| HCN⋯HF |
30.70 |
22.31 |
| H3N⋯HF |
51.61 |
34.96 |
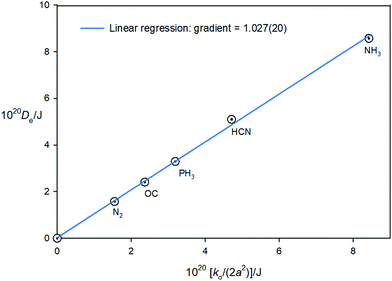 |
| | Fig. 8 A plot of the equilibrium dissociation energy Deversus kσ/(2a2) for five axially-symmetric, hydrogen-bonded complexes B⋯HF, where B = N2, CO, PH3, HCN and NH3. | |
4. Conclusions
In this article, several conclusions have been established about the suitability of explicitly correlated ab initio calculations at the CCSD(T)(F12c)/cc-pVTZ-F12 level for generating the potential energy changes as a function of the intermolecular distance r in the series of axially symmetric, hydrogen-bonded complexes B⋯HF, when B = N2, CO, PH3, HCN and NH3. The aim was to predict spectroscopic properties of the complexes under the assumption that the component molecules B and HF were sufficiently rigid relative to the intermolecular radial mode νσ to allow them to be treated as diatomic molecules in reasonable approximation. Two approaches were followed: (1) eqn (4)–(6) relating the spectroscopic properties ωσ, ωσxσ and ασ to various derivatives of the potential energy with respect to r, evaluated at r = re were applied to the ab initio generated functions, and (2) the potential function calculated ab initio for each B⋯HF was fitted by Morse, Rydberg and Hulburt–Hirschfelder functions in turn. Analysis of the fits revealed that the four-constant, H–H function provided statistically the best fit in each case. The same sets of spectroscopic properties as considered in (1) were then evaluated from the parameters of the fitted H–H functions. The constants ωσ, ωσxσ and ασ determined by approaches (1) and (2) were in good agreement, and would be identical if the H–H function were a perfect fit. When compared with the small number of available experimental versions of these constants, the predicted values were in satisfactory agreement with experiment, indicating that potential energy functions calculated in the diatomic approximation for the chosen complexes might provide a guide to the (often demanding) experiments required to measure such quantities.
As a prelude to the discussion of the B⋯HF, the same procedures were applied to the diatomic molecule H35Cl, for which an accurate RKR-type potential is available. The conclusion for H35Cl was that the CCSD(T)(F12c)/cc-pVTZ-F12 calculations provided an encouragingly good representation of the RKR function and yielded spectroscopic properties in satisfactory (but, of course, not perfect) agreement with the very accurately known experimental values.
It was also established that the relationship De = kσ/(2a2) between the two measures (De and kσ, both calculated ab initio) of the strength of the hydrogen bond in the B⋯HF complexes (and required if the H–H function were an accurate representation of the B⋯HF potential functions) holds to an excellent level of approximation, and supports the conclusion that the H–H function is appropriate to represent the hydrogen bond in the complexes investigated.
Conflicts of interest
There are no conflicts of interest to report.
Acknowledgements
I am pleased to acknowledge the award of a University Senior Research Fellowship by the University of Bristol, during the tenure of which the work described here was carried out.
References
- P. M. Morse, Phys. Rev., 1929, 34, 57–65 CrossRef CAS.
- R. Rydberg, Z. Phys., 1932, 73, 376–385 CrossRef CAS.
- H. M. Hulburt and J. O. Hirschfelder, J. Chem. Phys., 1941, 9, 61–69 CrossRef , and J. Chem. Phys., 1961, 35, 1901.
- P. D. Soper, A. C. Legon, W. G. Read and W. H. Flygare, J. Chem. Phys., 1982, 76, 292–300 CrossRef CAS.
- C. M. Lovejoy and D. J. Nesbitt, J. Chem. Phys., 1987, 86, 3151–3165 CrossRef CAS.
- P. Jankowski, S. N. Tsang, W. Klemperer and K. Szalewicz, J. Chem. Phys., 2001, 114, 8948–8963 CrossRef CAS.
- A. C. Legon, P. D. Soper and W. H. Flygare, J. Chem. Phys., 1981, 74, 4944–4950 CrossRef CAS.
- L. A. Rivera-Rivera, Z. Wang, B. A. McElmurry, R. R. Lucchese, J. W. Bevan and G. Kanschat, Chem. Phys., 2011, 390, 42–50 CrossRef CAS.
- G. T. Fraser and A. S. Pine, J. Chem. Phys., 1988, 88, 4147–4152 CrossRef CAS.
- A. C. Legon and L. C. Willoughby, Chem. Phys., 1983, 74, 127–136 CrossRef CAS.
- A. C. Legon, D. J. Millen and S. C. Rogers, Proc. R. Soc. London, Ser. A, 1980, 370, 213–237 CAS.
- D. Bender, M. Eliades, D. A. Danzeiser, M. W. Jackson and J. W. Bevan, J. Chem. Phys., 1987, 86, 1225–1234 CrossRef CAS.
- B. A. Wofford, S. G. Lied and J. W. Bevan, J. Chem. Phys., 1987, 87, 4478–4486 CrossRef CAS.
- S. W. Hunt, K. J. Higgins, M. B. Craddock, C. S. Brauer and K. R. Leopold, J. Am. Chem. Soc., 2003, 125, 13850–13860 CrossRef CAS PubMed.
- A. C. Legon, Phys. Chem. Chem. Phys., 2014, 16, 12415–12421 RSC and 25199.
- I. Alkorta and A. C. Legon, New J. Chem., 2018, 42, 10548–10554 RSC.
- J. A. Coxon and P. G. Hajigeorgiou, J. Quant. Spectrosc. Radiat. Transfer, 2015, 151, 133–154 CrossRef CAS.
- H.-J. Werner, P. J. Knowles, G. Knizia, F. R. Manby and M. Schütz, ‘Molpro: a general-purpose quantum chemistry program package’, Wiley Interdiscip. Rev.: Comput. Mol. Sci., 2012, 2, 242–253 CAS.
- MOLPRO 2019.2, a package of ab initio programs, H.-J. Werner, P. J. Knowles, G. Knizia, F. R. Manby and M. Schütz, M, 2012.
- C. Hättig, D. P. Tew and A. Köhn, J. Chem. Phys., 2010, 132, 231102 CrossRef PubMed.
- C. Hättig, W. Klopper, A. Köhn and D. P. Tew, Chem. Rev., 2012, 112, 4–74 CrossRef PubMed.
- J. G. Hill and K. A. Peterson, J. Chem. Phys., 2014, 141, 094106 CrossRef PubMed.
- C. A. Coulson and I. Fischer, Philos. Mag., 1949, 40, 386–393 CAS.
- See, for example, G. W. King, Spectroscopy and Molecular Structure, Holt, Rinehart and Winston Inc., New York, 1964, pp. 164–171 Search PubMed.
- Constants of Diatomic Molecules, complied by K. P. Huber and G. H. Herzberg, https://webbook.nist.gov.
- A. Heidaria, O. A. Bégb and M. Ghorbania, Russ. J. Phys. Chem. A, 2013, 87, 216–224 CrossRef.
|
| This journal is © the Owner Societies 2021 |
Click here to see how this site uses Cookies. View our privacy policy here.  Open Access Article


