 Open Access Article
Creative Commons Attribution 3.0 Unported Licence
The effect of ionic defect interactions on the hydration of yttrium-doped barium zirconate†
Sebastian
Eisele
 ab,
Fabian M.
Draber
 b and
Steffen
Grieshammer
 *ab
*ab
aHelmholtz-Institut Münster (IEK-12), Forschungszentrum Jülich GmbH, Corrensstr. 46, 48149 Münster, Germany. E-mail: s.grieshammer@fz-juelich.de
bInstitute of Physical Chemistry, RWTH Aachen University, Landoltweg 2, 52056 Aachen, Germany
First published on 13th February 2021
Abstract
Hydrated acceptor-doped barium zirconate is a well-investigated proton conductor. In the analysis of most experimental studies, an ideal defect model is applied to fit the measured hydration data and obtain corresponding enthalpies and entropies. However, the data show a distinct deviation from ideal behaviour and thus defect interactions cannot be neglected. In the present contribution, the thermodynamics of water uptake into the yttrium-doped bulk material are investigated on the microscopic level with regards to ionic defect interactions. Metropolis Monte Carlo simulations using interaction models from first-principles energy calculations are applied to obtain an estimation of the free energy of interaction. The present results indicate that the ionic defect interactions are the primary reason for the non-ideality observed in experiments with varying yttrium fraction, proton fraction, and temperature. The activity coefficient quotients for the mass action law are obtained, which connect the ideal and real model and are of relevance to data evaluation and theoretical calculations.
I Introduction
Barium-zirconate BaZrO3 (BZO) is a well-investigated high-performance proton conductor with potential application as an electrolyte in protonic ceramic fuel cells (PCFC). The bulk material crystalizes in the ABO3 perovskite structure with space group Pm![[3 with combining macron]](https://www.rsc.org/images/entities/char_0033_0304.gif) m (No. 221). To obtain an ion conductor, BZO is doped with an acceptor on the Zr site, here trivalent yttrium, resulting in mobile oxygen vacancies
m (No. 221). To obtain an ion conductor, BZO is doped with an acceptor on the Zr site, here trivalent yttrium, resulting in mobile oxygen vacancies  according to reaction (1) given in Kröger–Vink notation.1
 | (1) |
Hydration of the doped material BaZr1−xYxO3−0.5x (BZY) partially refills the oxygen vacancies. This yields mobile interstitial protons  which are bound to the oxygen ions forming
  defects according to the equilibrium reaction (2).
 | (2) |
Under the assumption of an ideal solution, the mass action law for reaction (2) can be written as eqn (3). The corresponding equilibrium constant K0(T) can then be calculated by the standard enthalpy Δh° and standard entropy Δs° of hydration according to eqn (4) for non-interacting defects. Here, p° is a standard pressure of 1 bar.
 | (3) |
 | (4) |
In recent years, multiple studies obtaining Δh° and Δs° by fitting eqn (4) to experimental data accumulated strong evidence that the assumption of an ideal solution is mostly inaccurate.2–6 It was repeatedly shown that data obtained from experiments investigating the proton content, such as thermogravimetry, are not well described by eqn (3) and (4) when the bulk material is subjected to larger variations of temperature or water partial pressure. Kreuer obtained satisfactory fitting results for the hydration isobars only by considering an effective dopant concentration indicating that the ideal solution model is too simple.7
The strong dependency on proton concentration indicates a critical influence of the ionic defect interactions on the hydration equilibrium in BZY. Since the proton diffusivity in BZY is affected by both yttrium fraction and proton content, the hydration levels under specific conditions are of primary interest from a practical point of view. Several theoretical studies calculated the hydration enthalpy of BZY;8,9 however, the dependence on defect concentration is not directly investigated in these studies.
One prominent effect is proton trapping which describes the tendency of  defects to accumulate at the
  defects due to the attractive
  interactions at short range which affects the proton diffusivity in BZY.10,11 This proton-trapping effect should also affect the hydration behaviour and is expected to be especially important at low temperatures.12,13 Analogous trapping of
  at the
  defects is found as a result of strongly attractive
  interactions at short range.
On the other hand,  and
and  pairs show strong repulsion at short range. The proton interstitials exist as
  defects3,14–16 with a covalent O–H bond. This implies that no proton is directly located at a vacant oxygen site and that no water-like molecules with more than one proton at an oxygen exist.11,16 The two remaining repulsive defect interactions
  and
and  are expected to have two effects: (i) the
  defects may be partially ordered if low sintering temperatures are used; and (ii) accumulating a large number of
  defects at a single
  defect is unfavourable.
Overall, the magnitude of these effects depends on the  concentration and thus the hydration of BZY must be expected to be a non-ideal process. The defect interactions can have a profound influence on the enthalpic and entropic terms of eqn (3) and consequently the equilibrium state of BZY. As the balance between attractive and repulsive interactions depends directly on the
  concentration, it can be expected that there are two concentration regimes where the enthalpic term favors or hinders hydration, respectively. In addition, defect interactions are expected to cause a significant decrease in the configurational entropy by increasing the ordering of the defects in the system with decreasing temperature. Here, both attractive and repulsive interactions cause ordering so that an a priori prediction about the dependency on the
  concentration is difficult.
In this article, we apply a combination of density functional theory (DFT) first-principles energy calculations and large-scale Metropolis Monte Carlo17,18 (MMC) simulations to model the hydration of BZY with interacting defects and estimate the influence of the ionic defect interactions on the hydration equilibrium in the bulk material. We obtain the interaction contribution to the free energy of the system Fint as a function of temperature T, yttrium doping xY, and proton molar fraction  , through multistage MMC sampling as introduced by Valleau and Card.19 This approach was successfully applied to the reduction of ceria20 and here we aim to analyse the experimental findings for hydration equilibrium states of the BZY bulk material with interacting ionic defects through analogous means and post-process experimental data to obtain revised values of Δh° and Δs°. Ultimately, the combination of Δh°, Δs°, and Fint is used to predict the water uptake of the BZY bulk as a function of temperature and water partial pressure and the results are compared to various experimental findings.
II Methods
Equilibrium constants
The non-ideal hydration equilibrium in reaction (2) can be separated into molar fractions and activity coefficients γi and thus the non-ideal equilibrium constant K is defined by eqn (5). | (5) |
Alternatively, K may be described by the ideal constant K0 and a factor Kint according to eqn (6). Kint is the quotient of activity coefficients, which is here assumed to be defined exclusively by the ionic defect interactions.
 | (6) |
The site balance of the oxygen ion sublattice and the electroneutrality condition can be written as eqn (7) and (8), respectively.
 | (7) |
 | (8) |
Combining eqn (5)–(8) yields the relation between the water partial pressure pH2O and  for the hydration of the interacting bulk system in eqn (9). While the separation of Kint and K0 is not accessible from experiments, it can be obtained from DFT/MMC simulations.
 | (9) |
The presented defect chemistry neglects other defects known to exist in the BZY system, namely, electronic hole defects under oxidizing conditions21–23 and yttrium dopants on the A sites of the perovskite.24,25 Additionally, a recent study26 suggests that BZY separates into an yttrium-rich and an yttrium-depleted phase around 10 mol% of yttrium doping when cooled below 1600 °C, which is also not considered in the present work.
Calculating the free energy of interaction
Following eqn (6), the apparent free enthalpy of hydration ΔGapp can be split into the ideal, non-interacting part ΔG° and a defect interaction contribution per created
  defect as shown in eqn (10).
 | (10) |
Accordingly, eqn (6) can then be expressed in generalized form of eqn (4) as shown in eqn (11).
 | (11) |
Neglecting volume changes, the approximation ΔG ≈ ΔF becomes applicable. Consequently, Kint can be expressed by eqn (12) as a function of  .
.
 | (12) |
 is the derivative of ΔFint with respect to the proton count NH and Fint is the interaction contribution to the free energy F. Dry BZY with Fint(NH = 0) serves as the point of reference for ΔFint according to eqn (13). A full derivation is available in the supplement of this article.
 | (13) |
The system's free energy F can be calculated using eqn (14) if the canonical partition function Z, eqn (15), is known.
F = −kBT![[thin space (1/6-em)]](https://www.rsc.org/images/entities/char_2009.gif) ln(Z) ln(Z) | (14) |
 | (15) |
 | (16) |
A solution was suggested by Valleau and Card19 by connecting the MMC distribution M(E,T) with a uniform random sample of the configurational space Ω′(E) by a series of bridging distributions with small temperature deltas. The overlap of consecutive pairs of Mj(E,Tj) and Mi(E,Ti) yields  according to eqn (17), where Tj > Ti, and M(E,T) converges to the random sample Ω′(E) for T → ∞.
 | (17) |
 by eqn (13).
 | (18) |
A more detailed derivation of the principle is available in the supplement of this article and further explanation of the underlying mathematics can be found in the literature.19,20
Computational setup
In the MMC simulations, BZY is modelled using space group Pm![[3 with combining macron]](https://www.rsc.org/images/entities/char_0033_0304.gif) m with a lattice constant of 4.23 Å where the undoped barium site is omitted. According to DFT calculations, there are four possible proton positions at approximately 1 Å distance around each oxygen site.16 Due to symmetry, the unit cell is thus fully described by the data shown in Table 1.
m with a lattice constant of 4.23 Å where the undoped barium site is omitted. According to DFT calculations, there are four possible proton positions at approximately 1 Å distance around each oxygen site.16 Due to symmetry, the unit cell is thus fully described by the data shown in Table 1.
Here, the species  describes the absence of an interstitial proton
  . During simulation, only the O and HI sublattices are active, that is,
  and
and  swaps are performed. Zr and Y are immobile and uniformly distributed at random at the Zr-sites prior to the simulation. This assumes that high temperature sintering leads to a uniform random distribution of the
  defects in BZY and neglecting any
  interactions. However, it should be noted that recent research27 suggests that the repulsive
  interaction causes cation defect ordering even if very high sintering temperatures are used during sample preparation.
The energy landscape is modelled using pair interactions obtained from DFT calculations with the software VASP.28,29 The calculation method is described in previous publications.16,30 The energy change ΔE(S0 → S1) between the initial state S0 and final state S1 of an MMC exchange attempt is calculated as the summation of all pair energy contributions Eij(i ≠ j) for the particles i and j of the two states as shown in eqn (19).
 | (19) |
The average internal energy of the system due to defect interaction Uint is then obtained from a Monte Carlo step (MCS) average of the pair interaction summation in thermal equilibrium according to eqn (20), which is equivalent to the mean value of the recorded energy distribution M(E,T).
 | (20) |
All MMC simulations were performed with our in-house Monte Carlo software MOCASSIN31 using the built-in MMC multistage sampling routine. The solver simulates an annealing process for supercells by executing sequential runs at decreasing temperature T, from infinity T∞ to a lower limit Tmin. Two runs are performed at each sampled temperature: (i) an equilibration to ensure the system has reached thermal equilibrium; and (ii) a main run where the energy of the system Eint is recorded to collect the M(E,T) distributions. A factor α(T) manipulating the Boltzmann probability Pi of a transition i as shown in eqn (21) and (22) was introduced to model the temperature changes with gradually increasing sampling precision for lower values of T during simulation.
 | (21) |
 | (22) |
Simulations were performed for a long and a short-range interaction model in 20 × 10 × 10 supercells of (Ba)Zr1−xYxO3−0.5x at x ∈ [0.1; 0.2; 0.3] using Tmin = 273 K. The samples are named BZY10, BZY20, and BZY30, respectively. The alpha range α ∈ [0…1.0] was sampled with the step size Δα = 0.01. For each yttrium fraction, 29 relative hydration levels β ∈ [0…1.0] were simulated, where β = 0 and β = 1 correspond to dry or fully hydrated material, respectively. The interval β ∈ [0…0.1] was sampled with a stepping of Δβ = 0.01 and all higher hydration levels with Δβ = 0.05. Each parameter set was run 48 times with different random seeds and starting conditions and 50 × 106 cycle outcomes per histogram were recorded with a mapping resolution of 0.01 eV. In each equilibration phase, 5 × 10⁶ cycles were performed prior to the data collection. 140![[thin space (1/6-em)]](https://www.rsc.org/images/entities/char_2009.gif) 592 MMC distributions M(E, T, NH) for each of the six pairs of yttrium fraction and DFT model were collected, totalling 843
592 MMC distributions M(E, T, NH) for each of the six pairs of yttrium fraction and DFT model were collected, totalling 843![[thin space (1/6-em)]](https://www.rsc.org/images/entities/char_2009.gif) 552 recorded MMC distributions.
552 recorded MMC distributions.
III Results and discussion
DFT calculations
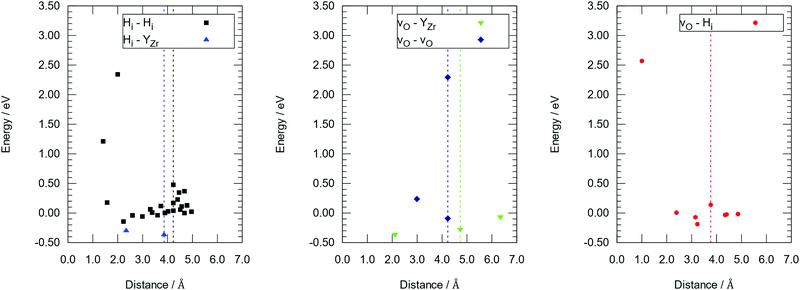
DFT calculations were performed to complete our previously reported interaction energies.16 Pair interaction models with short-range and long-range cut-off radii are distinguished for the MMC simulations, labelled (S) and (L) in all following figures, respectively. All pair interactions and model boundaries are illustrated in Fig. 1.Five types of interactions are considered in the MMC simulations, namely,  ,
,  ,
,  ,
,  , and
, and  . In general, BZO is highly symmetric and thus few unique interactions per unit range exist. However, there are four stable proton interstitial sites located around each oxygen site that are relevant to the hydration process, yielding a total of 24 unique
  geometries within a 5 Å radius that can be distinguished in DFT calculations.
The  interactions are strictly negative and converge towards zero at increasing distance as expected due to Coulomb's law. The
  interaction is also negative, however the first nearest neighbour attraction (1NN) (−0.3 eV) is slightly weaker than the 2NN interaction (−0.37 eV). Also, in accordance with Coulomb's law, the interactions for
  ,
,  , and
, and  are mostly positive with a few exceptions that may be the result of structural relaxation of the supercells during DFT calculations. In the defective cell, the oxygen coordination octahedra around Zr sites can tilt, leading to a significant reduction of the energy of the supercell. If the energy reduction caused by the tilt overcompensates the Coulomb repulsion, then the
  ,
,  , and
, and  interactions may become slightly negative at certain positions.
There are interactions that show significant repulsive energies: (i) the strong  repulsion at 1NN position (2.57 eV), which means that creating isolated
  defects rather than
  is extremely unfavourable; (ii) the
  repulsions at 1NN (1.21 eV) and 3NN (2.34 eV), which correspond to the unfavourable option of two
  attaching to the same
  – formally creating an
  water-like defect; and (iii) the strong
  repulsion at 2NN-b (2.30 eV), corresponding to an interaction where a cation is located at the midpoint between the two
  defects, which is analogously expected to greatly reduce the probability of two
  forming this local configuration unless the concentration of
  is very high.
The complete set of interaction tables with symmetry-reduced reference geometries can be found in the supplement of this article.
Internal and free energy of interactions
The presented data is limited to the temperature set in the practically interesting range of 0 °C to 1000 °C. The reference states for values of ΔUint, ΔFint, ΔSint are the dry supercells with at the same temperature and yttrium content. Thus, these quantities describe the changes in defect interactions due to hydration.
Fig. 2 and 3 show the changes in internal energy ΔUint and free energy ΔFint for the BZY10 supercells using the short-range model, respectively. Both quantities are strictly negative, that is, interactions favour the hydration process, and the absolute values of ΔFint are always less than ΔUint as the defect interactions reduce the configurational space and thus the system loses configurational entropy. Within the applied DFT model, the energy decrease can be explained by the creation of attractive  interactions (−0.30 eV at 1NN and −0.37 eV at 2NN) that overcompensate the energy increase resulting from the removal of attractive
  interactions (−0.36 eV at 1NN, −0.28 eV at 2NN, −0.07 eV at 3NN). This is further supported by the removal of
  defects reducing the number of repelling
  interactions (0.24 eV at 1NN, up to 2.30 eV at 2NN) that occur when multiple
  defects aggregate at the same
  defect.
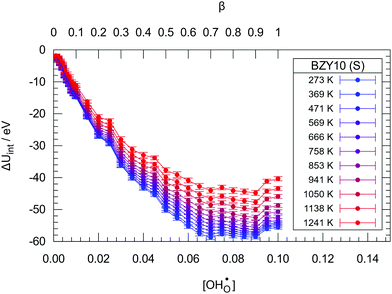 | ||
| Fig. 2 The change in internal energy ΔUint due to hydration in the BZY10 supercells using the short-range model. Lines are guide to the eye only. | ||
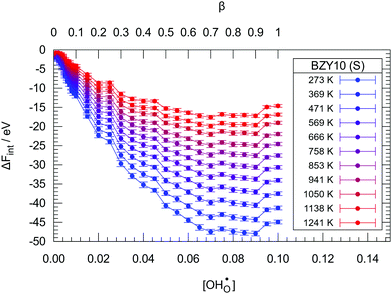 | ||
| Fig. 3 The change in free energy ΔFint due to hydration in the BZY10 supercells using the short-range model. Lines are guide to the eye only. | ||
The contribution per defect decreases with increasing hydration level and ΔUint and ΔFint both traverse minima around  independent of temperature. This allows two assumptions: (i) gradual hydration progressively becomes less favourable; and (ii) for hydration above
  , the interactions of ionic defects have an impeding effect on further hydration.
The interaction-induced changes in configurational entropy ΔSint are obtained using the relation F = U − TS. The results for BZY10 with the short-range DFT model are illustrated in Fig. 4. Two expected features are visible: (i) all values are negative, as interactions cause ordering of the system by restricting the accessibility of configurations; and (ii) the loss of entropy is less pronounced for increasing temperature, as more thermal fluctuation reduces the order of defects. For low temperatures, ΔSint traverses an unexpected minimum which could be related to low-temperature cluster formation. This is however hard to verify due to the small effect.
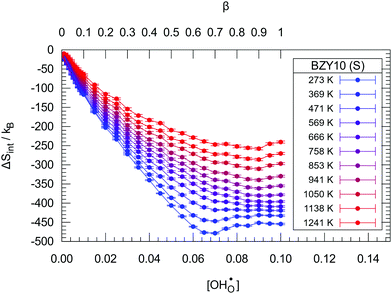 | ||
| Fig. 4 The change in entropy ΔSint due to hydration in the BZY10 supercells using the short-range model. Lines are guide to the eye only. | ||
The analogously obtained results for ΔFint in the BZY20 and BZY30 supercells using the short-range model are illustrated in Fig. 5 and 6, respectively. The minima for BZY20 are independent of temperature, lie very close to  , and thus behave analogously to the BZY10 simulations. In contrast, the BZY30 simulations show a slightly temperature dependent behaviour where the energy minimum is shifted towards lower hydration levels with rising temperature. Thus, the hindering of gradual hydration starts at lower relative hydration levels in contrast to BZY10 and BZY20. The results for the long-range model are similar and can be found in the supplement. In general, the long-range interaction data indicate a less favouring effect on hydration than the short-range model.
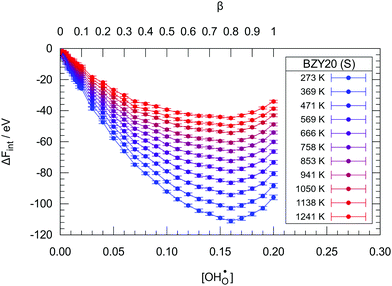 | ||
| Fig. 5 The change in free energy ΔFint due to hydration in the BZY20 supercells using the short-range model. Lines are guide to the eye only. | ||
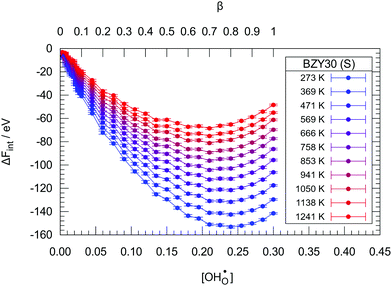 | ||
| Fig. 6 The change in internal energy ΔFint due to hydration in the BZY30 supercells using the short-range model. Lines are guide to the eye only. | ||
Calculation of the Kint datasets
The datasets are obtained by evaluating eqn (13) using a third order polynomial fitted to the simulated ΔFint data. The fitting is only performed to obtain smooth functions for ΔFint and to reduce the data fluctuations in the derivative ∂ΔFint/∂NH. The results for
  using the short-range model are summarized in Fig. 7 and the results for the long-range model can be found in the supplement.
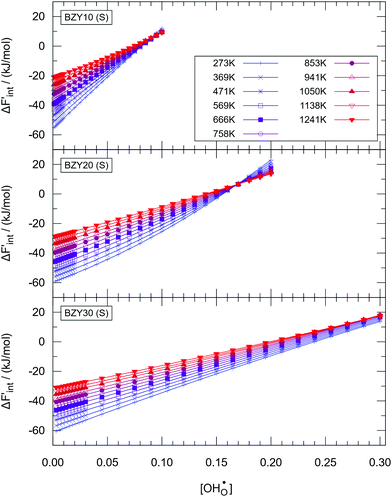 | ||
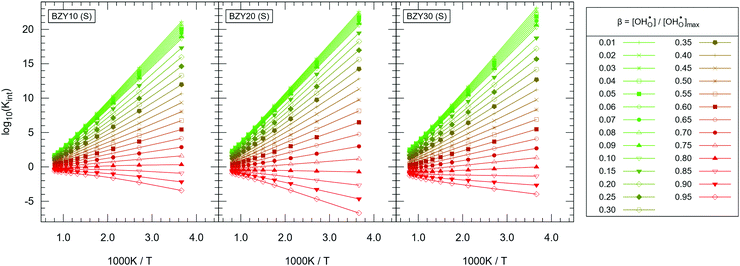
Fig. 7 The calculated values of  for the short-range model in BZY10 (top), BZY20 (middle), and BZY30 (bottom). Lines are guide to the eye only. for the short-range model in BZY10 (top), BZY20 (middle), and BZY30 (bottom). Lines are guide to the eye only. | ||
Fig. 7 reveals two expected properties: (i) the magnitude of  declines with increasing temperature and proton concentration, as the influence of the TΔSint term on ΔFint increases and partially compensates for the negative enthalpic term; and (ii) the curves flatten with rising temperature due to the weakening of the influence of defect interactions.
Evaluation of eqn (12) with the  data yields the Kint datasets. The results for BZY10, BZY20, and BZY30 using the short-range model are summarized in Fig. 8. The differences between the yttrium fractions are much smaller than the divergences due to proton defects or temperature changes, which agrees with the experimental observation that xY affects the equilibrium constants to a minor degree only.3,5,32
The distinct zones of interest are Kint > 1, Kint ≈ 1, and Kint < 1, which imply that proton incorporation is above, equal, or below the ideal case without defect interactions, respectively. Thus, the shown trends in Kint are expected when compared to the ideal model, that is: (i) regardless of temperature, it is generally more favourable to have at least a few protons incorporated into the system (green curves); (ii) it is significantly harder to push the material towards very high levels of hydration (red curves); and (iii) the gap in Kint between low and high  is decreasing by orders of magnitude from 0 °C to 1000 °C due to the weakening of the influence of defect interactions with rising temperature. Since the spread in Kint gradually declines with rising temperature approaching Kint ≈ 1, fitting of experimental results should be done for high temperatures. Optionally, Kint ≈ 1 is reached for very high proton concentrations around 0.80–0.90 – depending on the yttrium fraction – over a wide temperature range.
Extraction of Δh° and Δs° from experimental data
The presented simulation data can be used to evaluate and post-process experimental results. By rewriting eqn (6) into eqn (23), it is apparent that the dependency of experimental
  values can be eliminated using the Kint datasets from MMC. This yields the
  independent K0(T) data and consequently revised values of Δh° and Δs° can be obtained from the Arrhenius formalism. In return, the applicability of the separation principle is implicitly validated by this approach.
 | (23) |
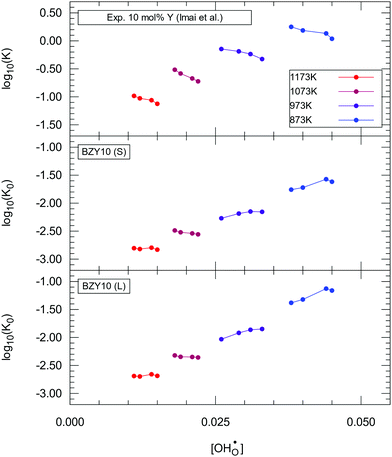
A detailed experimental analysis for BZY10 was performed by Imai et al.4 We use their data for comparison and analysis based on eqn (23) and consequently to obtain revised estimations for Δh° and Δs°. Imai et al. investigated multiple hydration levels at each measured temperature. Using interpolated values of Kint matching their conditions, the generated K0(T) dataset should ideally be independent of  at each temperature. The K0 values extracted from the experimental data are summarized in Fig. 9.
None of the two models accomplishes a constant K0 for each temperature but the  dependence is corrected in the right direction compared to K. K0 no longer shows a strict decline with gradual hydration. Instead, for 873 K and 973 K the data shows slightly positive slopes and for 1073 K and 1173 K the curves are almost constant. Thus, the method seems to overestimate the correction for lower temperatures. The trends for low temperatures are not unexpected as pair interaction models should yield a progressively less accurate description for higher defect concentrations, which are present in BZY at low temperatures and/or at high water partial pressures.
Overall, considering that K0 inherits the experimental fluctuations from K, the results indicate that the  dependence is greatly reduced and that the ionic defect interactions are the primary reason for non-ideal behaviour observed in the experimental data. Fig. 10 shows the Arrhenius diagrams obtained from the temperature averages of K0. While the systematic differences in the K data by Imai et al. prevent a direct evaluation, the evaluation of calculated K0(T) data shows an Arrhenius behaviour within the margin of error.
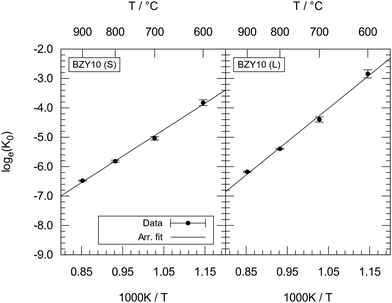 | ||
| Fig. 10 Arrhenius diagrams for temperature averages of K0 as obtained from the short-range model (left) and long-range model (right). | ||
Fitting yields Δh° = −75 ± 4 kJ mol−1 and Δs° = −118 ± 4 J mol−1 K−1 for the short-range model, and Δh° = −94 ± 5 kJ mol−1 and Δs° = −132 ± 5 J mol−1 K−1 for the long-range model. The obtained values of Δh° and Δs° lie within the data range as reported in the literature2,5,6 for experiments conducted above 500 °C. This is expected, as there are few interacting protons present and Kint has a minor effect at high temperatures.
Dependence of  on water partial pressure
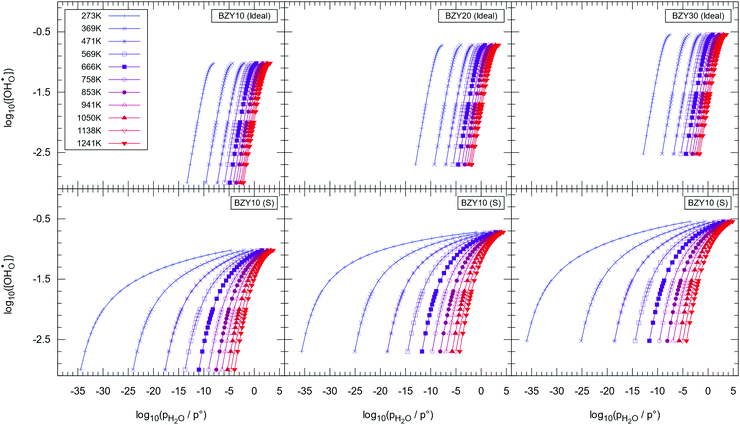
The simulated Kint in combination with extracted K0 allow prediction of the pH2Ovs. relations (hydration isotherms) for the full temperature and pH2O range. Fig. 11 shows
  against pH2O for the short-range model calculated with eqn (9) in comparison to the curves calculated from K0. Based on the experimental observation that xY has a minor effect on the equilibrium constants,32 Δh° and Δs° are also adopted for BZY20 and BZY30. The illustration for the long-range model can be found in the supplement of the article.
Fig. 11 reveals the strong deviation from an ideal behaviour with the largest divergence at 0 °C to 200 °C, which is expected as the hydration of BZY is exothermic and defect interactions have the largest impact at low temperatures. The data suggests almost full hydration at pH2O < 0.1 Pa and T = 0 °C. However, slow kinetics with long equilibration times could be expected under these conditions and thus the data illustrates the limiting case, which might not be accessible in experiments. Additionally – as mentioned previously – the method seems to progressively overestimate the Kint data with decreasing temperatures.
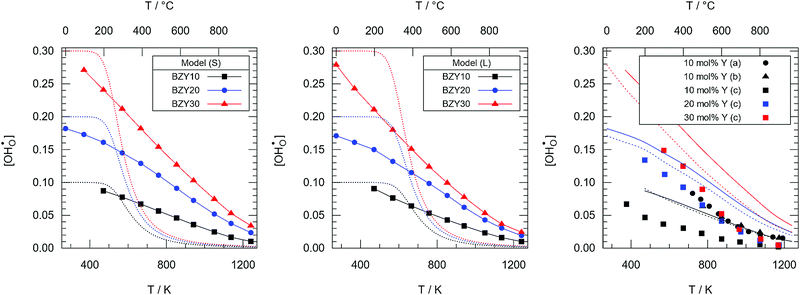
For a typical experimental water partial pressure of 23 mbar, the hydration isobar  according to eqn (9) is presented in Fig. 12 for both models in comparison to ideal curves according to eqn (4) using Δs° and Δh° as determined above. Various experimental results from literature which were obtained at comparable yttrium fraction and water partial pressure are shown for comparison. The following features can be identified: (i) the data including Kint strongly deviates from the ideal curves improving or hindering the hydration at the high and low temperature regions, respectively; (ii) the favouring effect of the long-range model is smaller than for the short range model; and (iii) there is an excellent agreement of the BZY10 curves with the experimental data by Imai et al.4 and Kreuer et al.3 – measured at 23 mbar and 10 mol% Y content – and a good qualitative agreement of the BZY20 and BZY30 curves with the data by Gonçalves et al.5 – measured at 19 mbar and 20 mol% and 30 mol% yttrium, respectively. However, the deviation of their results for 10 mol% yttrium from the data by the other groups is unexpected considering the minor change in pH2O. The affiliated MMC data also suggests higher
  saturation than measured by Gonçalves et al. The differences for low temperatures might originate from the mentioned issue of slow kinetics leading to different degrees of hydration.
In general, the inclusion of defect interactions in the form of Kint leads to greatly improved description of the experimental data compared to the ideal model.
IV Conclusions
The non-ideal behaviour of barium zirconate hydration is an often-discussed issue in the literature. In this contribution, large-scale multistage MMC simulations based on a DFT derived pair interaction model were applied to estimate the influence of defect interactions on the hydration of BZY. The applied separation into interacting and non-interacting contributions by calculating the free energy of interaction ΔFint allowed us to obtain estimations for the quotient of the activity coefficients condensed in the factor Kint. The post-processing of experimental K data to obtain revised values of K0, Δh°, and Δs° successfully yielded datasets providing improved quantitative agreement with experimental data compared to the ideal solution model for BZY10, BZY20, and BZY30. Increasing the interaction range slightly improves the agreement of the MMC simulations with experimental results for BZY20 and BZY30, however the benefit-cost ratio rapidly diminishes.
The applied method investigates interacting ensembles using fixed-position MMC simulations with DFT pair interaction models, while neglecting the influences of electron hole defects, yttrium defects on A sites, and surface effects. Structural relaxation of the system is implicitly considered during the DFT calculations of the pair interactions, while further lattice distortion of specific configurations is not considered in the MMC simulations. Considering the excellent agreement with experimental data, the present results indicate that the non-ideality of the bulk water uptake can be explained mostly by the ionic defect interactions affecting both low and high temperature regimes.
The often-published conclusion that low temperature data shows ideal behaviour is not directly confirmed. Instead, there are strong deviations from ideal behaviour observed for the entire temperature regime. However, the influence of Kint on the equilibrium constant does not change over several orders of magnitude, that is,  , within the very high and very low temperature regimes. Thus, these regions can be acceptably fitted using an Arrhenius model as commonly done in experimental studies. The largest impact of interactions is found for low temperature and very low proton fraction or water partial pressure. However, this equilibrium might not be observable in experiments as the kinetics could be a limiting factor and Kint seems to be progressively overestimated with decreasing temperature.
We conclude that the simulated data seems to predict the experimental trends very well and can be used to correct and analyse experimental data by including the ionic defect interactions into the BZY hydration model.
Author contributions
S. E. implemented the Monte Carlo system MOCASSIN31 with the MMC multistage sampling and performed all MMC simulations and data evaluation. F. M. D. performed the DFT calculations and supplied the pair interaction data. S. G. initiated and supervised the research. All authors have contributed to the preparation of the manuscript.Conflicts of interest
There are no conflicts to declare.Acknowledgements
The authors gratefully acknowledge the computing time granted by the JARA Vergabegremium and provided on the JARA Partition part of the supercomputer CLAIX at RWTH Aachen. We thank Prof. Manfred Martin from RWTH Aachen University for bringing our attention to the topic and for helpful discussions.References
- F. A. Kröger and H. J. Vink, in Solid state physics, ed. F. Seitz and D. Turnbull, Academic Press, New York, 1956, pp. 307–435 Search PubMed.
- K. D. Kreuer, S. Adams, W. Münch, A. Fuchs, U. Klock and J. Maier, Solid State Ionics, 2001, 145, 295–306 CrossRef CAS.
- K. D. Kreuer, Annu. Rev. Mater. Res., 2003, 33, 333–359 CrossRef CAS.
- G. Imai, T. Nakamura and K. Amezawa, Solid State Ionics, 2017, 303, 12–15 CrossRef CAS.
- M. D. Gonçalves, A. Mielewczyk-Gryń, P. S. Maram, Ł. Kryścio, M. Gazda and A. Navrotsky, J. Phys. Chem. C, 2020, 124, 11308–11316 CrossRef.
- T. Schober, Solid State Ionics, 2000, 127, 351–360 CrossRef CAS.
- K. D. Kreuer, Solid State Ionics, 1999, 125, 285–302 CrossRef CAS.
- J. A. Dawson, J. A. Miller and I. Tanaka, Chem. Mater., 2015, 27, 901–908 CrossRef CAS.
- S. J. Stokes and M. S. Islam, J. Mater. Chem., 2010, 20, 6258 RSC.
- Y. Yamazaki, F. Blanc, Y. Okuyama, L. Buannic, J. C. Lucio-Vega, C. P. Grey and S. M. Haile, Nat. Mater., 2013, 12, 647–651 CrossRef CAS.
- K. Toyoura, T. Fujii, N. Hatada, D. Han and T. Uda, J. Phys. Chem. C, 2019, 123, 26823–26830 CrossRef CAS.
- N. Kochetova, I. Animitsa, D. Medvedev, A. Demin and P. Tsiakaras, RSC Adv., 2016, 6, 73222–73268 RSC.
- K. Kreuer, Solid State Ionics, 2000, 136–137, 149–160 CrossRef CAS.
- P. Raiteri, J. D. Gale and G. Bussi, J. Phys.: Condens. Matter, 2011, 23, 334213 CrossRef.
- M. Björketun, P. Sundell, G. Wahnström and D. Engberg, Solid State Ionics, 2005, 176, 3035–3040 CrossRef.
- F. M. Draber, C. Ader, J. P. Arnold, S. Eisele, S. Grieshammer, S. Yamaguchi and M. Martin, Nat. Mater., 2020, 19, 338–346 CrossRef CAS.
- N. Metropolis and S. Ulam, J. Am. Stat. Assoc., 1949, 44, 335–341 CrossRef CAS.
- N. Metropolis, A. W. Rosenbluth, M. N. Rosenbluth, A. H. Teller and E. Teller, J. Chem. Phys., 1953, 21, 1087–1092 CrossRef CAS.
- J. P. Valleau and D. N. Card, J. Chem. Phys., 1972, 57, 5457–5462 CrossRef CAS.
- S. Grieshammer and M. Martin, J. Mater. Chem. A, 2017, 5, 9241–9249 RSC.
- K. Noromura and H. Kageyama, Solid State Ionics, 2007, 178, 661–665 CrossRef.
- D. Han, Y. Noda, T. Onishi, N. Hatada, M. Majima and T. Uda, Int. J. Hydrogen Energy, 2016, 41, 14897–14908 CrossRef CAS.
- D. Han and T. Uda, J. Mater. Chem. A, 2018, 6, 18571–18582 RSC.
- D. Han, K. Kishida, K. Shinoda, H. Inui and T. Uda, J. Mater. Chem. A, 2013, 1, 3027 RSC.
- R. Sažinas, M. F. Sunding, A. Thøgersen, I. Sakaguchi, T. Norby, T. Grande and J. M. Polfus, J. Mater. Chem. A, 2019, 7, 3848–3856 RSC.
- K. Ueno, N. Hatada, D. Han, K. Toyoura and T. Uda, J. Solid State Electrochem., 2020, 24, 1523–1538 CrossRef CAS.
- S. Kasamatsu, O. Sugino, T. Ogawa and A. Kuwabara, J. Mater. Chem. A, 2020, 8, 12674–12686 RSC.
- G. Kresse and J. Furthmüller, Phys. Rev. B: Condens. Matter Mater. Phys., 1996, 54, 11169–11186 CrossRef CAS.
- G. Kresse and D. Joubert, Phys. Rev. B: Condens. Matter Mater. Phys., 1999, 59, 1758–1775 CrossRef CAS.
- S. Grieshammer, B. O. H. Grope, J. Koettgen and M. Martin, Phys. Chem. Chem. Phys., 2014, 16, 9974–9986 RSC.
- S. Eisele and S. Grieshammer, J. Comput. Chem., 2020, 41, 2663–2677 CrossRef CAS.
- Y. Yamazaki, P. Babilo and S. M. Haile, Chem. Mater., 2008, 20, 6352–6357 CrossRef CAS.
Footnote |
| † Electronic supplementary information (ESI) available. See DOI: 10.1039/d0cp06587k |
| This journal is © the Owner Societies 2021 |


