 Open Access Article
Creative Commons Attribution 3.0 Unported Licence
Addressing a lattice of rotatable molecular dipoles with the electric field of an STM tip†
Timo
Frauhammer
*ab,
Lukas
Gerhard
 c,
Kevin
Edelmann
ab,
Marcin
Lindner
a,
Michal
Valášek
 a,
Marcel
Mayor
 *ade and
Wulf
Wulfhekel
ac
aInstitute of Nanotechnology, Karlsruhe Institute of Technology (KIT), D-76021 Karlsruhe, Germany. E-mail: timo.frauhammer@kit.edu
bPhysikalisches Institut, Karlsruhe Institute of Technology (KIT), D-76131 Karlsruhe, Germany
cInstitute for Quantum Materials and Technologies, Karlsruhe Institute of Technology (KIT), D-76021 Karlsruhe, Germany
dDepartment of Chemistry, University of Basel, St. Johannsring 19, CH-4056 Basel, Switzerland
eLehn Institute of Functional Materials (LIFM), School of Chemistry, Sun Yat-Sen University (SYSU), 510275 Guangzhou, China. E-mail: marcel.mayor@unibas.ch
First published on 11th February 2021
Abstract
Functional molecular groups mounted on specific foot structures are ideal model systems to study intermolecular interactions, due to the possibility to separate the functionality and the adsorption mechanism. Here, we report on the rotational switching of a thioacetate group mounted on a tripodal tetraphenylmethane (TPM) derivative adsorbed in ordered islands on a Au(111) surface. Using low temperature scanning tunnelling microscopy, individual freestanding molecular groups of the lattice can be switched between two bistable orientations. The functional dependence of this rotational switching on the sample bias and tip–sample distance allows us to model the energy landscape of this molecular group as an electric dipole in the electric field of the tunnelling junction. As expected for the interaction of two dipoles, we found states of neighbouring molecules to be correlated.
1 Introduction
The concept of tripodal molecular platforms with a specifically designed head group deposited on a well defined flat solid, allows the fabrication of a huge variation of functionalized surfaces with the potential of a defined response to an external stimulus.1–4 On the one hand, such an arrangement of identical objects can serve as a model system for artificial materials with switchable properties.5–8 On the other hand, addressing individual molecular entities is crucial for an understanding of the mechanisms on the nanoscale. Scanning tunnelling microscopy (STM) is an ideally suited surface analysis tool which permits both to characterise and to manipulate objects on the molecular and submolecular scale. This technique is especially appealing in combination with molecular complexes that expose a specific molecular group mounted on a surface-anchored platform.9–11 With this approach, influence of the surface on the functional group12,13 is minimized. The switching behaviour of single molecules is particularly interesting in the case of a mechanism which can be clearly related to an external stimulus. So far, different stimuli have been reported which can induce molecular switching in the junction of an STM. These include the sample voltage,14 the tunnelling current,11,15,16 the electric field10,17 the mechanical presence of the tip,18–20 and photoresponse of the molecule.21,22 In this work, we fabricated ordered submonolayers of tripodal molecular platforms with a rotatable acetyl group mounted on top. In the junction of the STM, we observed a bistable switching of the protruding head group that can be understood as an in-plane rotation between two orientational states. Statistical analysis of the corresponding random telegraph noise allowed to trace the energy levels of the two states. In a meticulous study of the influence of the voltage drop in the junction and distance of tip and sample, we were able to explain the switching by the electric field in the STM junction interacting with the dipole moment of the molecular head group. Notably, we confirm that individual molecular dipoles within the lattice interact, i.e., their rotational states are correlated. In this way, the ordered monolayers present an ideal model system for artificial dipole lattices, in which the intermolecular spacing given by the foot structure can easily be adapted23 in order to vary the molecular dipole–dipole interaction.2 Experimental
Synthesis of the triflate substituted tetraphenylmethane derivative (Triflate-TPM)
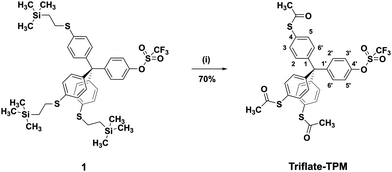
Synthesis of the target molecule Triflate-TPM is outlined in Fig. 1 and starts from the previously published 2-(trimethylsilyl)ethyl protected thiol derivative 1 which was obtained via an already reported multistep synthesis.24 Transprotection of the thiols in 1 has been successfully performed using AgBF4 and acetyl chloride (AcCl) in dichloromethane to afford the desired thioacetate Triflate-TPM in 70% yield. The title compound was fully characterized by conventional analytical and spectroscopy methods like 1H and 13C NMR spectroscopy, mass spectrometry, IR, UV-vis spectroscopy, and by elemental analysis (see ESI†).Sample preparation
A clean Au(111) surface was obtained by argon sputtering at 1.5 kV and subsequent annealing at 575 °C. The molecules were deposited on the cleaned gold surface from a dichloromethane solution by using a spray-technique, which has been described in more detail before.25 Subsequently, the sample was annealed in ultra high vacuum (UHV) at about 195 °C to remove solvent residuals and was transferred in situ to the STM. All measurements were performed with a homebuilt STM at about 5.3 K in UHV (p ∼ 1 × 10⁻¹⁰ mbar).3 Results and discussion
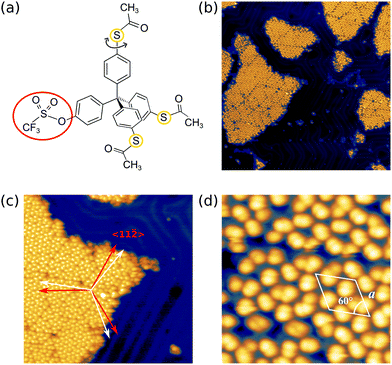
After deposition of the Triflate-TPM shown in Fig. 2(a) on the Au(111) surface, we obtained a submonolayer coverage with the molecules assembling in ordered islands of about 50 nm in width (see Fig. 2(b)). These islands consist of several domains. The domain boundaries are tilted by about ±11 ° with respect to the crystal's mirror axes, namely the 〈11-![[2 with combining macron]](https://www.rsc.org/images/entities/char_0032_0304.gif) 〉 directions as indicated for one island in Fig. 2(c). The stripes of the herringbone reconstruction seem to avoid the islands, suggesting the reconstruction might even be lifted below the islands due to the thiol–Au interaction.26,27Fig. 2(d) shows a close up image of an island. Most single elements are dumbbell shaped, similar to our previous studies on TPM derivatives, where three or all four substituents were SAc-groups.23 This motif can be reduced to a single circle of lower apparent height by application of voltage pulses, similarly as it has been reported for pairs of SAc-groups sticking out of the molecular film23 (see Fig. S3 of the ESI†). Moreover, the islands exhibit an apparent height of about 0.52 nm (at −1.5 V, 3.5 pA) which is in agreement with the height reported for similar TPM derivatives with three or four SAc-groups.23 This indicates that each dumbbell shaped molecular motif corresponds to a single SAc group sticking out of the islands and that two SAc groups and the triflate group face towards the gold substrate. We assume that these bottom two SAc groups form S–Au bonds upon heating to 195 °C. The arrangement has a lattice constant of a = 2.2 nm (see white solid parallelogram in Fig. 2(d) and dashed lines) and three dumbbell shaped molecular motifs per unit cell.
〉 directions as indicated for one island in Fig. 2(c). The stripes of the herringbone reconstruction seem to avoid the islands, suggesting the reconstruction might even be lifted below the islands due to the thiol–Au interaction.26,27Fig. 2(d) shows a close up image of an island. Most single elements are dumbbell shaped, similar to our previous studies on TPM derivatives, where three or all four substituents were SAc-groups.23 This motif can be reduced to a single circle of lower apparent height by application of voltage pulses, similarly as it has been reported for pairs of SAc-groups sticking out of the molecular film23 (see Fig. S3 of the ESI†). Moreover, the islands exhibit an apparent height of about 0.52 nm (at −1.5 V, 3.5 pA) which is in agreement with the height reported for similar TPM derivatives with three or four SAc-groups.23 This indicates that each dumbbell shaped molecular motif corresponds to a single SAc group sticking out of the islands and that two SAc groups and the triflate group face towards the gold substrate. We assume that these bottom two SAc groups form S–Au bonds upon heating to 195 °C. The arrangement has a lattice constant of a = 2.2 nm (see white solid parallelogram in Fig. 2(d) and dashed lines) and three dumbbell shaped molecular motifs per unit cell.
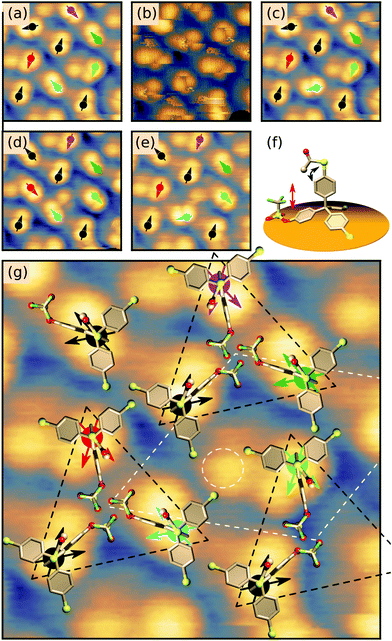
Interestingly, at certain tunnelling parameters, the STM tip can induce a transition between two different orientations of the protruding SAc group which can be seen as an in-plane rotation of the dumbbell-shaped molecular motif. It turned out that this switching is strongly reduced at negative sample bias but enhanced at positive sample bias (see Fig. 6). This allows us to study the switching in more detail in a series of scans, alternating negative (see Fig. 3(a and c–e)) and positive sample bias (see Fig. 3(b), following scans at positive sample bias are not shown). Scanning at positive sample bias (Fig. 3(b)) leads to a rotation of about 60° for the motif marked by a cyan arrow, while other motifs did not show any rotation (compare Fig. 3(a and c)). Following another scan at positive sample bias, the motifs marked by the red, the purple and the bright green arrows switch by about 60°, while the motif marked by a cyan arrow switches back to its original orientation (see Fig. 3(c and d)). In the next snapshot at negative bias, the motif marked by the red arrow is in its original orientation (see Fig. 3(e)). From a series of such scans, the centre of the apparent rotation can be identified (black and coloured circles in Fig. 3(a and c–e)) and two different directions of the individual motifs can be assigned (black and coloured arrows in Fig. 3(a and c–e)). No molecule showed more than two different orientations. Note that the exact shape of the dumbbell shaped motif depends on the local environment and does not allow to assign an orientation. The threefold symmetry of the TPM core is not reflected by the observed switching between only two bistable states. Instead, we suggest that the two observed orientations of the dumbbell motif are related to the position of the triflate group which breaks the threefold symmetry. Then, it seems likely that the switching is related to a transition between two different rotational states of the single protruding SAc group, left or right of the triflate group that is adsorbed on the surface. Fig. 3(f) shows a side-view of the proposed adsorption orientation with the triflate group acting as a barrier for the rotating SAc group. In this configuration, the oxygen electron lone pairs of the triflate group would be repelled from the surface by a negative sample bias, which would further increase the rotational barrier. This behaviour would intuitively explain the observed stabilising effect of negative sample bias. Incorporating these considerations, we propose a tentative adsorption configuration as presented in Fig. 3(g) where both observed orientations of each molecular motif are indicated by black/coloured arrows and molecular models are superimposed to scale: The molecules can be grouped in equilateral triangles (black dashed lines in Fig. 3(g)) in which each protruding SAc group points along one of the adjacent sides of the triangle. This hypothesis is in agreement with identical adsorption orientations of molecules at identical positions of the unit cell (dashed white line in Fig. 3(g)). The protrusions in the gap between three triangles (see white dashed circle in Fig. 3(g)) have a clearly different appearance and might be explained by a molecule adsorbed with three SAc groups facing the surface or a partly decomposed molecule.
In a single scan of the ordered islands this order is largely veiled by the different orientations of the rotating SAc group. Therefore, we performed another series of scans on the area shown in Fig. 2(d), alternating negative and positive sample bias (see also Fig. S4, ESI†). From this series, the orientations and centres of rotation of 28 molecules were determined (see Fig. 4). In agreement with the model presented above, all molecules can be grouped in equilateral triangles. As expected from the mirror symmetry of the Au(111) surface, triangles come in two different orientations (see upper right and lower domains in Fig. 4). In particular, domains clearly end with complete triangles, which strongly suggests that the interaction of the three triflate groups closely nestled in the centres of the triangles play a role in stabilising the overall structure. The arrangement in equilateral triangles allows to define a clockwise (cw) or counterclockwise (ccw) orientation within the triangle.
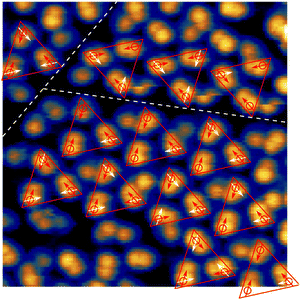 | ||
| Fig. 4 Molecular arrangement. STM image of 10 nm × 10 nm recorded at −1.4 V and a set-point current of 2 pA covering two domain boundaries (white dashed lines). Orientations of the molecular motifs in this scan are derived from a series of scans with alternating sample bias of −1.4 V and 1.3 V. Red arrows indicate the orientation of the molecular motif in this scan, possible orientations in following scans of the same area are indicated in white. The molecular motifs can be grouped in triangles (red lines) consisting of three molecules following the model presented in Fig. 3. | ||
At certain tip positions, the tunnelling parameters can be tuned such that random telegraph noise (RTN) can be observed: at a fixed tip position, the two rotational states result in two different current levels. Fig. 5(a and b) show the tip location with respect to the two states. Fig. 5(c) shows part of the time trace of the tunnelling current for a fixed tip position (feedback-loop disabled). Clearly, the current switches back and forth between two different values that correspond to the two conformational states. Recording this RTN over an extended period of time and plotting the respective occupation times of the two states in a histogram, we find an exponential decay (see Fig. 5(d)). This experiment results in lifetimes of τhigh = (1.47 ± 0.11) s and τlow = (0.56 ± 0.07) s of the high and low current state, respectively. We assume that the low tunnelling currents (of the order of 10 pA) can be neglected in terms of local heating.28 Therefore, the system is assumed to remain in thermal equilibrium and the energy difference between the two states can be determined using Boltzmann statistics. For the very experiment shown in Fig. 5(d) one gets ΔE = Ehigh − Elow = −0.46 meV using the total occupation times for the population ratio.
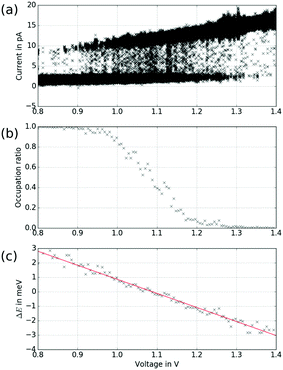
In general, however, the energy landscape of these conformational states will hold a complicated functional dependence on both tip position and tunnelling parameters. Under the assumption that Boltzmann statistics hold, we are able to probe the energy difference between the two states as a function of sample bias and tip–sample distance (lateral tip position being fixed) by recording the corresponding RTN signal.10Fig. 6(a) shows RTN recorded during a bias sweep. Clearly, at low sample bias the low current state was favoured. As the bias was increased, transitions to the high current state occurred until finally the high current state was favoured. Accordingly, the mean occupation ratio (see Fig. 6(b)) shows a smooth transition from the low-current state to the high-current state. The extrapolated energy difference between the two conformational states clearly shows a linear dependence on the tunnelling voltage. This points towards a process driven by the electric field in the STM junction.10,29,30 A simple model system that explains this functional dependence is a molecular dipole in the electric field of the tunnelling junction, where the energy is given by
 | (1) |
![[p with combining right harpoon above (vector)]](https://www.rsc.org/images/entities/i_char_0070_20d1.gif) and the electric field in the tunnelling junction
and the electric field in the tunnelling junction ![[E with combining right harpoon above (vector)]](https://www.rsc.org/images/entities/i_char_0045_20d1.gif) , which can be estimated as the ratio of the applied sample bias U and the tip–sample distance d.
, which can be estimated as the ratio of the applied sample bias U and the tip–sample distance d.
In order to proof this hypothesis, we performed a series of bias sweeps similar to Fig. 6 at various z-positions, that is at various distances d. The results are shown in Fig. 7. Clearly, the transition from low current to high current state shifts to lower sample bias as the tip approaches the sample. To quantitatively investigate this behaviour, a critical voltage for the transition of each sweep has been determined according to
| Ucrit = Umax − ΔU·nhigh, | (2) |
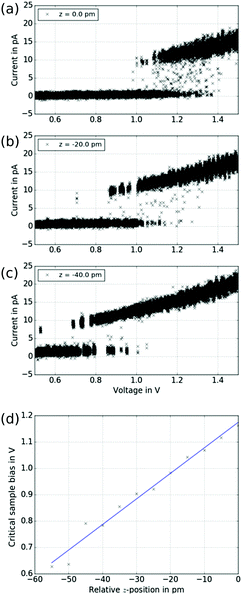 | ||
| Fig. 7 Electric field dependence. (a–c) A series of bias sweeps for different tip–sample distances is shown. The initial z-position of the first spectrum has been arbitrarily set to zero. As the tip is approaching the sample, the transition from the low to the high current state shifts towards smaller voltages. (d) The voltage of the transition according to eqn (2) is plotted as function of relative z-position. The linear fit yields a critical electric field of Ecrit = (9.7 ± 0.5) × 109 V m−1. | ||
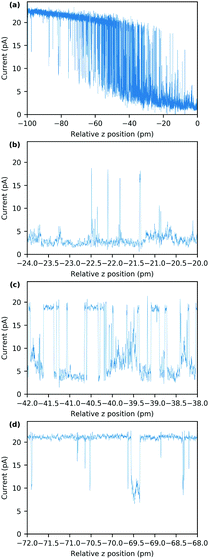
While the model of an electric-field induced torque on the molecular dipole is in accordance with the experiments presented above, switching mechanisms that require a particular energy of the tunnelling electrons (inelastic excitations or tunnelling to specific orbitals14) do not agree with our observation of a critical bias voltage for the transition that varies with the distance (see Fig. 7). In order to facilitate comparison to previous work where tunnelling-current induced inelastic excitations play a significant role,31–33 we measured the RTN as a function of the distance between tip and sample. As depicted in Fig. 8, the switching behaviour drastically changes upon variation of the distance by 100 pm (see Fig. 8(a)). At larger distances (see Fig. 8(b)), the low-current state is clearly favoured and after occasional transitions to the high-current state, the molecule quickly switches back. At intermediate distances (see Fig. 8(c)), both states are occupied with similar probability, i.e. have similar lifetimes. At smaller distances (see Fig. 8(d)), the high-current state is clearly favoured and after occasional transitions to the low-current state, the molecule quickly switches back. We do not see an increase of the overall switching rate with decreasing tip–sample distance/increasing tunnelling current which we would expect for an inelastic excitation.34 In particular, when looking at the high-current state of the molecule, upon approaching the tip, i.e. increasing the current, the probability to switch to the low-current state declines which is at odds with the assumption of a mechanism based on inelastic excitations. Note that the variation of the tunnelling current for each state is smaller than the difference in the current between the two states so that an experiment with a closed feed-back loop (i.e. at constant current) would obscure this behaviour.
Finally, we cannot fully exclude thermal switching following an Arrhenius-law, where the barrier height is a function of both, bias and z-position.35 Remarkably, this switching has only been observed for this very TPM derivative and not for similar ones that absorb in a similar way with SAc groups exposed to the STM tip23 which underlines the influence of the foot structure on the molecular arrangement within the islands and thus the behaviour of the head group.
Note that, when the tip is approached even further towards the sample (>130 pA), the low current state is favoured again (see Fig. S5, ESI†). A simple figurative explanation is given by the steric interaction or even deformation of the molecule at very low distances between tip and sample.
As the experiments above clearly hint towards an electric-field induced torque acting on the dipole moment of the protruding molecular group, we also expect the orientations of the molecular head groups to reflect an inter-molecular dipole–dipole coupling. We modelled the molecular arrangement by a regular dipole lattice with the dipoles placed at the centres of rotation of the molecular motifs, that is at the edges of equilateral triangles. In analogy with the observation, the two possible orientations of each dipole were aligned with two sites of the triangle (see Fig. 3). For a dipole moment ![[p with combining right harpoon above (vector)]](https://www.rsc.org/images/entities/i_char_0070_20d1.gif) 1 in the field of a second dipole
1 in the field of a second dipole ![[p with combining right harpoon above (vector)]](https://www.rsc.org/images/entities/i_char_0070_20d1.gif) 2 at a distance of
2 at a distance of ![[r with combining right harpoon above (vector)]](https://www.rsc.org/images/entities/i_char_0072_20d1.gif) 1 −
1 − ![[r with combining right harpoon above (vector)]](https://www.rsc.org/images/entities/i_char_0072_20d1.gif) 2, the interaction energy is given by:
2, the interaction energy is given by:
 . With this, for a single equilateral triangle, |
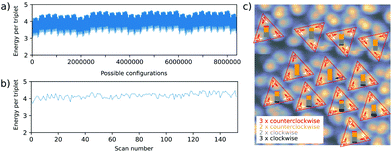
![[p with combining right harpoon above (vector)]](https://www.rsc.org/images/entities/i_char_0070_20d1.gif) | = 1 and r = 1, the dipolar energy for the eight possible configurations then amounts to 3 or 4.25 (in arbitrary units), for all dipoles orientated cw (ccw) or 2 cw and 1 ccw (2 ccw and 1 cw), respectively. This suggests that an orientation of all molecular dipoles in either cw or ccw direction within their respective triangle is preferred. We further calculated the total dipolar energy for the eight triangles of the domain on the lower part of Fig. 4 with the positions of the triangles inferred from the experiment, also considering the interaction across neighbouring triangles. Again, the configuration where all molecules are oriented cw (ccw) within their respective triangle is energetically slightly preferred (corresponding to configuration number 0 in Fig. 9(a)). Extraction of the experimentally observed configurations and calculation of the corresponding interaction energy in the same framework suggests that, in the experiment, configurations with higher energy, i.e., less preferable dipole orientations, were observed far more often (see Fig. 9(b)). As depicted in Fig. 9(c), pure cw/ccw configurations on the level of individual triangles are statistically underrepresented (less than 2 out of 8 possible configurations) and mixed configurations appear to be preferred. Clearly, the suggested model is too simple to reproduce the experiment for the whole scan area. Please note that in this system, the ground state is neighboured by many other states of similar energy and relaxation is expected to be extremely slow. The time for cool down from room temperature to 5.3 K is about 2 hours, which might not be sufficiently slow to bring the system into the ground state. All following 152 samples of the dipole configuration were not obtained by annealing and subsequent cool down, but by scanning the same area at a positive sample bias. Thus, the switching of the molecular head groups might not be isotropic but influenced by the movement of the electric field induced by the STM tip which prevents the system from taking the ground state. A detailed analysis of the underlying physics, however, is beyond the scope of this paper.
| = 1 and r = 1, the dipolar energy for the eight possible configurations then amounts to 3 or 4.25 (in arbitrary units), for all dipoles orientated cw (ccw) or 2 cw and 1 ccw (2 ccw and 1 cw), respectively. This suggests that an orientation of all molecular dipoles in either cw or ccw direction within their respective triangle is preferred. We further calculated the total dipolar energy for the eight triangles of the domain on the lower part of Fig. 4 with the positions of the triangles inferred from the experiment, also considering the interaction across neighbouring triangles. Again, the configuration where all molecules are oriented cw (ccw) within their respective triangle is energetically slightly preferred (corresponding to configuration number 0 in Fig. 9(a)). Extraction of the experimentally observed configurations and calculation of the corresponding interaction energy in the same framework suggests that, in the experiment, configurations with higher energy, i.e., less preferable dipole orientations, were observed far more often (see Fig. 9(b)). As depicted in Fig. 9(c), pure cw/ccw configurations on the level of individual triangles are statistically underrepresented (less than 2 out of 8 possible configurations) and mixed configurations appear to be preferred. Clearly, the suggested model is too simple to reproduce the experiment for the whole scan area. Please note that in this system, the ground state is neighboured by many other states of similar energy and relaxation is expected to be extremely slow. The time for cool down from room temperature to 5.3 K is about 2 hours, which might not be sufficiently slow to bring the system into the ground state. All following 152 samples of the dipole configuration were not obtained by annealing and subsequent cool down, but by scanning the same area at a positive sample bias. Thus, the switching of the molecular head groups might not be isotropic but influenced by the movement of the electric field induced by the STM tip which prevents the system from taking the ground state. A detailed analysis of the underlying physics, however, is beyond the scope of this paper.
Complicating factors include the presence of additional molecules or molecular fragments in the spaces between the equilateral triangles and the presence of the moving tip which does not interact equally with different orientations of the molecules. It has been shown in similar systems recently that charged molecular fragments significantly influence the switching of nearby molecules.11 In addition, individual molecules that did not switch at all during the series of 153 scans obviously obscure the statistics and more measurements would be necessary for a conclusive analysis.
On a local level, an electric dipole–dipole interaction would also be reflected in the correlation of individual pairs of molecules. We therefore analysed the series of 680 individual scans for each polarity, some of which are shown exemplarily in Fig. 3. The switching of each molecule throughout the series can be presented as a time trace as function of the file number as is shown in the upper panels of Fig. 10 for the molecules marked by coloured arrows in Fig. 3. As a measure of the possible correlation between switching behaviour of two individual molecules we measured the Jaccard index36 of the corresponding time traces. The Jaccard index is obtained by calculating the intersection of the two signals normalised by the union of the two. A value of 100% corresponds to maximal correlation and a value of 0% corresponds to no correlation. In order to further exclude coincidental high values, the Jaccard index is plotted as a function of the shift between the two time traces (see lower panels in Fig. 10(a–d)). The molecules represented by bright green and cyan arrows in Fig. 3 indeed show a maximum at 0 shift between the two time traces which clearly indicates a correlation between the orientation of the corresponding molecular head groups (see Fig. 10(a)). A weaker but still significant correlation is found for the cyan and the red molecular head groups in Fig. 3 as presented in Fig. 10(b). In other words, these molecules prefer to be in the cw/ccw state when the neighbouring molecule also is in cw/ccw state in full agreement with the modelled dipole–dipole interaction energies discussed above. We tried to study the molecule–molecule interaction on isolated dipoles by selective removal of acetyl groups (see Fig. S3, ESI†) and on the rims of smaller islands (see Fig. S8, ESI†). The single isolated dipole group shown in Fig. S3 (ESI†) did not show bi-stable behaviour, but on the rim of an island a pair of isolated molecular head groups did indeed show the behaviour expected for interacting dipoles (see Fig. S8, ESI†).
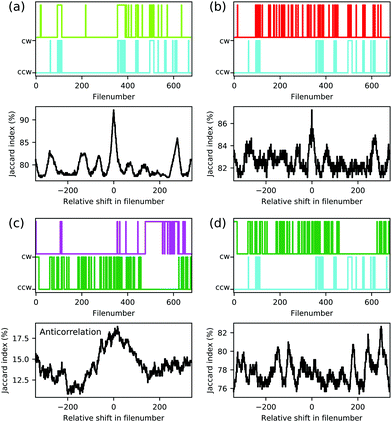 | ||
| Fig. 10 Correlation of the orientations of molecular dipoles. The upper panels of (a–d) show the time traces of the orientations of five molecules extracted from a series of 680 scans (see Fig. 3). A cw orientation is represented by the upper value, a ccw orientation is represented by the lower value. Lower panels of (a–d) show the corresponding Jaccard index as function of the relative shift in file number. | ||
Assuming thermal equilibrium, we can use Boltzmann statistics and estimate how the energy difference between cw and ccw states changes for one molecule depending on the state of the neighbouring one. We obtain the following numbers for the populations pc of the cyan molecule:
This corresponds to a change in the energy difference between cw and ccw states of the cyan molecule of
depending on the state of the bright green molecule. While the series of scans of the area shown in Fig. 4 provides two more examples of correlated cw/ccw orientation of two pairs of molecules (see Fig. S6, ESI†), one pair of molecules has been found to show a weak anti-correlation (see Fig. 10(c)). Other pairs of molecules showed weaker or no significant correlation (see e.g.Fig. 10(d)), also because of too low numbers of transitions within the series of 680 and 153 scans. We do not have conclusive data on a possibly different behaviour for molecules within a domain and at the domain boundary: while Fig. S6 (ESI†) shows that correlated switching also occurs at domain boundaries, molecules located right at the domain boundaries seem to be less likely to switch at all under the conditions we applied (see Fig. 9(c), Fig. S7 and S8, ESI†). While we cannot fully rule out a simple steric interaction, the distance between neighbouring head groups speaks against this. In previous work, the molecular dipole–dipole interaction has been found to be reflected in the (static) pattern formed during the deposition process.37 Here, we believe that indeed the electric dipole–dipole interaction drives the correlation between the molecular groups manipulated by the STM tip.
4 Conclusions
In summary, we have presented the synthesis, adsorption and switching behaviour of a TPM derivative on Au(111), which is decorated with three SAc groups and one triflate group and adsorbs such that single SAc groups point out of the molecular film. The STM tip induces a characteristic switching between different metastable conformational states, which appears as a rotation between two discrete orientations of the protruding SAc group. This switching unveils the underlying structure and it is found that the molecules are grouped in triplets arranged in equilateral triangles. The triflate groups adsorbed on the substrate are tightly nestled which suggests that they contribute to the cluster formation. The analysis of the corresponding RTN as a function of sample bias and tip–sample distance yields an electric field dependence of the energy landscape of the two conformational states. Interestingly, we found a correlation of neighbouring molecular head groups within the lattice which can be explained by electric dipole–dipole interaction.Conflicts of interest
There are no conflicts to declare.Acknowledgements
We acknowledge financial support from the Helmholtz Research Program STN (“Science and Technology of Nanosystems”) and DFG Grants (MA 2605/6-1) and (GE 2989/2-1). T. F. acknowledges support from DFG Grant (WU349/13-1) and the Landesstiftung Baden-Württemberg. M. M. acknowledges support from the 111 project (90002-18011002).References
- L. Bartels, Nat. Chem., 2010, 2, 87–95 CrossRef CAS.
- B. Baisch, D. Raffa, U. Jung, O. M. Magnussen, C. Nicolas, J. Lacour, J. Kubitschke and R. Herges, J. Am. Chem. Soc., 2009, 131, 442–443 CrossRef CAS.
- M. Valášek, M. Lindner and M. Mayor, Beilstein J. Nanotechnol., 2016, 7, 374–405 CrossRef.
- N. A. Wasio, D. P. Slough, Z. C. Smith, C. J. Ivimey, S. W. Thomas Iii, Y.-S. Lin and E. C. H. Sykes, Nat. Commun., 2017, 8, 16057 CrossRef CAS.
- S. De Feyter and F. De Schryver, Chem. Soc. Rev., 2003, 32, 139–150 RSC.
- Y. Liu, L. Mu, B. Liu and J. Kong, Chem. – Eur. J., 2005, 11, 2622–2631 CrossRef CAS.
- Y. Zhang, H. Kersell, R. Stefak, J. Echeverria, V. Iancu, U. G. E. Perera, Y. Li, A. Deshpande, K.-F. Braun, C. Joachim, G. Rapenne and S.-W. Hla, Nat. Nanotechnol., 2016, 11, 706–712 CrossRef CAS.
- D. Dattler, G. Fuks, J. Heiser, E. Moulin, A. Perrot, X. Yao and N. Giuseppone, Chem. Rev., 2020, 120, 310–433 CrossRef CAS.
- T. Jasper-Tönnies, A. Garcia-Lekue, T. Frederiksen, S. Ulrich, R. Herges and R. Berndt, Phys. Rev. Lett., 2017, 119, 066801 CrossRef.
- L. Gerhard, K. Edelmann, J. Homberg, M. Valášek, S. G. Bahoosh, M. Lukas, F. Pauly, M. Mayor and W. Wulfhekel, Nat. Commun., 2017, 8, 14672 CrossRef.
- T. Jasper-Toennies, M. Gruber, S. Johannsen, T. Frederiksen, A. Garcia-Lekue, T. Jäkel, F. Roehricht, R. Herges and R. Berndt, ACS Nano, 2020, 14, 3907–3916 CrossRef CAS.
- L. Gao, Q. Liu, Y. Y. Zhang, N. Jiang, H. G. Zhang, Z. H. Cheng, W. F. Qiu, S. X. Du, Y. Q. Liu, W. A. Hofer and H.-J. Gao, Phys. Rev. Lett., 2008, 101, 197209 CrossRef CAS.
- D. Zhong, T. Blömker, K. Wedeking, L. Chi, G. Erker and H. Fuchs, Nano Lett., 2009, 9, 4387–4391 CrossRef CAS.
- S. W. Wu, N. Ogawa, G. V. Nazin and W. Ho, J. Phys. Chem. C, 2008, 112, 5241–5244 CrossRef CAS.
- P. Liljeroth, J. Repp and G. Meyer, Science, 2007, 317, 1203–1206 CrossRef CAS.
- T. Miyamachi, M. Gruber, V. Davesne, M. Bowen, S. Boukari, L. Joly, F. Scheurer, G. Rogez, T. K. Yamada, P. Ohresser, E. Beaurepaire and W. Wulfhekel, Nat. Commun., 2012, 3, 938 CrossRef.
- G. J. Simpson, V. García-López, A. Daniel Boese, J. M. Tour and L. Grill, Nat. Commun., 2019, 10, 4631 CrossRef.
- D. Lensen and J. A. A. W. Elemans, Soft Matter, 2012, 8, 9053–9063 RSC.
- C. Manzano, W.-H. Soe, H. S. Wong, F. Ample, A. Gourdon, N. Chandrasekhar and C. Joachim, Nat. Mater., 2009, 8, 576–579 CrossRef CAS.
- J. Homberg, M. Lindner, L. Gerhard, K. Edelmann, T. Frauhammer, Y. Nahas, M. Valášek, M. Mayor and W. Wulfhekel, Nanoscale, 2019, 11, 9015–9022 RSC.
- W. R. Browne and B. L. Feringa, Annu. Rev. Phys. Chem., 2009, 60, 407–428 CrossRef CAS.
- O. Nachtigall, C. Kördel, L. H. Urner and R. Haag, Angew. Chem., Int. Ed., 2014, 53, 9669–9673 CrossRef CAS.
- M. Lindner, M. Valášek, M. Mayor, T. Frauhammer, W. Wulfhekel and L. Gerhard, Angew. Chem., Int. Ed., 2017, 56, 8290–8294 CrossRef CAS.
- M. Lindner, M. Valášek, J. Homberg, K. Edelmann, L. Gerhard, W. Wulfhekel, O. Fuhr, T. Wächter, M. Zharnikov, V. Kolivoška, L. Pospíšil, G. Mészáros, M. Hromadová and M. Mayor, Chem. – Eur. J., 2016, 22, 13218–13235 CrossRef CAS.
- M. Valášek, K. Edelmann, L. Gerhard, O. Fuhr, M. Lukas and M. Mayor, J. Org. Chem., 2014, 79, 7342–7357 CrossRef.
- H. Häkkinen, Nat. Chem., 2012, 4, 443–455 CrossRef.
- Y. Liu and V. Ozolins, J. Phys. Chem. C, 2012, 116, 4738–4747 CrossRef CAS.
- K. J. Franke and J. I. Pascual, J. Phys.: Condens. Matter, 2012, 24, 394002 CrossRef.
- M. Alemani, M. V. Peters, S. Hecht, K.-H. Rieder, F. Moresco and L. Grill, J. Am. Chem. Soc., 2006, 128, 14446–14447 CrossRef CAS.
- T. Kudernac, N. Ruangsupapichat, M. Parschau, B. Maciá, N. Katsonis, S. R. Harutyunyan, K.-H. Ernst and B. L. Feringa, Nature, 2011, 479, 208–211 CrossRef CAS.
- J. N. Ladenthin, L. Grill, S. Gawinkowski, S. Liu, J. Waluk and T. Kumagai, ACS Nano, 2015, 9, 7287–7295 CrossRef CAS.
- R. Harsh, F. Joucken, C. Chacon, V. Repain, Y. Girard, A. Bellec, S. Rousset, R. Sporken, A. Smogunov, Y. J. Dappe and J. Lagoute, J. Phys. Chem. Lett., 2019, 10, 6897–6903 CrossRef CAS.
- M. Bouatou, C. Chacon, F. Joucken, Y. Girard, V. Repain, A. Bellec, S. Rousset, R. Sporken, C. González, Y. J. Dappe and J. Lagoute, J. Phys. Chem. C, 2020, 124, 15639–15645 CrossRef CAS.
- L. Gerhard and M. Valášek, in Encyclopedia of Interfacial Chemistry, ed. K. Wandelt, Elsevier, Oxford, 2018, pp. 271–280 Search PubMed.
- J. C. Gehrig, M. Penedo, M. Parschau, J. Schwenk, M. A. Marioni, E. W. Hudson and H. J. Hug, Nat. Commun., 2017, 8, 14404 CrossRef CAS.
- P. Jaccard, Bull. Soc. Vaudoise Sci. Nat., 1901, 37, 547–579 Search PubMed.
- X. Liu, Y. Wei, J. E. Reutt-Robey and S. W. Robey, J. Phys. Chem. C, 2014, 118, 3523–3532 CrossRef CAS.
Footnote |
| † Electronic supplementary information (ESI) available. See DOI: 10.1039/d0cp06146h |
| This journal is © the Owner Societies 2021 |

