
Investigation of the thermal removal steps of capping agents in the synthesis of bimetallic iridium-based catalysts for the ethanol oxidation reaction†
Carolin
Prössl
a,
Markus
Kübler
a,
Mohammad Ali
Nowroozi
 b,
Stephen
Paul
a,
Oliver
Clemens
b and
Ulrike I.
Kramm
*a
b,
Stephen
Paul
a,
Oliver
Clemens
b and
Ulrike I.
Kramm
*a
aTechnical University of Darmstadt, Catalysts and Electrocatalysts Group, Graduate School of Excellence Energy Science and Engineering, Department of Materials- and Earth Sciences and Department of Chemistry, Otto-Berndt-Str. 3, 64287 Darmstadt, Germany. E-mail: kramm@ese.tu-darmstadt.de
bTechnical University of Darmstadt, Materialdesign durch Synthese Group, Department of Materials- and Earth Sciences, Alarich-Weiss-Str. 2, 64287 Darmstadt, Germany
First published on 24th November 2020
Abstract
Two iridium-based catalysts (namely IrSn and IrNi) are synthesised via a polyol route involving capping agents. The capping agents are removed according to a time-consuming multistep heat-treatment protocol described in the literature (N2 → N2/O2 → H2). In this work the effect of each of these steps on the structural composition and catalytic activity is investigated by X-ray diffraction (XRD), transmission electron microscopy (TEM), Fourier-transform infrared spectroscopy (FT-IR), X-ray photoelectron spectroscopy (XPS) and electrochemistry. It is shown that heating in nitrogen is not required, whereas air is the most effective for the removal of the capping agents. Besides FT-IR, the analysis of sp3 carbon (from XPS) turned out to give reasonable insights into capping agent removal. Induced by hydrogen treatment no further change of the surface occurs, while particles tend to grow and become more crystalline. While structural changes are similar for both catalysts, the impact of each of the steps on the catalysis is different: the activity per gram of iridium becomes even lower for IrSn (an electrochemical cleaning agent that was used as reference measurements, seems best suited) while the activity is doubled for the IrNi case. Our results illustrate that the selection of the cleaning procedure strongly depends on the investigated system and should be optimised individually.
Introduction
Today, the worldwide efforts being made for the replacement of fossil fuels by renewable energies are increasing. Typically, renewable energies are stationary applications such as wind turbines, solar power, solar heat converters and others. Taking into account that 25 to 30 percent of the global energy consumption is related to the transport sector illustrates the need for portable energy storage solutions. In this context electrochemistry plays a major role in the form of battery, fuel cell and electrolyser applications. For several of the reactions, catalysts are required to enhance the kinetics or tune the selectivity. For example, in the case of ethanol oxidation CO2 is the desired product, but acetic acid or acetaldehyde might also be formed. Catalytic systems usually contain a precious metal like platinum or iridium in combination with at least one second metal that should be oxophilic and in the best case enhance the CO tolerance of the precious metal.1–3Iridium has an increased oxophilic character and is suggested as a catalyst to enable a better adsorption of ethanol via an Ir–C interaction so that ethanol can be oxidised already at lower potentials.4 Furthermore, the use of tin or nickel as a co-catalyst was found to be beneficial. With their addition the surface becomes terminated with Oads and OHads and the electronic structure is modified. Both enhance the CO oxidation capability of the main catalyst.3,5–9 In order to maximize the surface area, nanoparticle synthesis is favourable. Polyol-based synthesis strategies are often used to synthesize size- and shape-controlled nanoparticles (NPs).10–12 During the precipitation reaction, capping agents bind on the surface and limit the overall growth or push it in distinct directions to obtain shape-controlled nanoparticles.13 While the capping agents are of advantage during the synthesis, strongly binding capping agents have a negative impact on the catalytic properties of the particles because they block active sites from reactant adsorption.14,15 Based on this, their removal is required and in the literature a variety of cleaning strategies have been reported: UV/ozone radiation,14,16 electrochemical conditioning,17,18 alkaline methanol wash,10 washing with organic solvents like hexane and ethanol,15 thermal annealing in air,14 and CO adsorption/stripping processes10,19 to name some of them.
A problem that emerges during the cleaning procedure is the maintenance of the shape, size and surface structure.10 Even if the shape and size of NPs is preserved, the surface atomic arrangement might change. This was evidenced from hydrogen adsorption/desorption features after UV/ozone radiation and potential cycling up to 1.2 VRHE on Pt shape-controlled NPs.16,18
The choice of the cleaning method depends on the interaction strength between the capping agent and the metal surface. For example, the combination of oleic acid (OAc)/oleylamine (OAm) binds less strongly on a Pt surface compared to poly(vinylpyrrolidone) (PVP).18
Washing procedures do not alter the atomic surface arrangement. However, polar protic solvents e.g. acetone and ethanol, are unsuccessful in their role as OAm/OAc removers from Pt NPs whereas hexane is able to remove the capping agents to a certain extent with residual organic contaminations.10 Li et al. evaluated thermal annealing in air at 185 °C, acetic acid (HAc) washing and UV/ozone radiation on OAm-capped Pt NPs and observed no significant change in the particle size or morphology after the treatments, whereas the activity was maximum after air treatment.14 Furthermore, thermal annealing shows the best performance in electrochemical experiments as it exhibits the most pronounced characteristic Hupd features and the highest ORR activity. Liu et al. reported annealing in either air at 185 °C or in Ar/H2 at 400 °C effectively removes OAm from Pt NPs; the latter however led to particle growth.20 No Pt oxidation, particle size or grain growth was observed after the air treatment. But the authors observed particle sintering after heating in Ar/H2.
On the contrary, an improved metal interaction (under H2 or Ar), crystalline growth (under H2) and metal oxidation (under O2) was reported for bimetallic PtSn particles after treatments in aforementioned atmospheres.21 Nevertheless, in all cases the activity was higher compared to that of the untreated catalyst. To conclude, the thermal removal of capping agents is frequently used in the literature but has not been reported step-by-step, yet. Based on this, the aim of this paper is to investigate the individual steps and study morphological changes upon their application in detail on two Ir-based catalysts.
A multistep thermal process as reported in the literature is applied to remove the capping agent mixture OAc/OAm which comprises of a polyol mediated synthesis of carbon supported IrSn and IrNi NPs, adapted to Ir-based systems from Erini et al.22 The influence of the treatment in different atmospheres on the composition, particle morphology, and crystallinity is traced by identical location transmission electron microscopy (IL-TEM), X-ray diffraction (XRD) and X-ray photoelectron spectroscopy (XPS). The effectiveness of the cleaning method is evaluated via Fourier-transform infrared spectroscopy (FT-IR), XPS and electrochemical active surface area (ECSA) and compared to the ethanol oxidation reaction (EOR) activity.
Experimental
Materials
For the preparation of Ir-based NPs, the metal salts iridium acetylacetonate Ir(acac)3, (98%, Strem Chemicals), tin acetate Sn(ac)2 (Strem Chemicals, 99%) and nickel acetate tetra hydrate Ni(ac)2·4H2O (Alfa Aesar/ThermoFisher, 99.999%) were used as precursors in diethylene glycol dibutyl ether (DEDB) (99%, Sigma-Aldrich) with the reducing substance 1,2-tetradecanediol (90%, Sigma-Aldrich) and the capping agents oleylamine (OAm) (70%, Sigma-Aldrich) and oleic acid (OAc) (Ph. Eur., Sigma-Aldrich). Additional chemicals are acetone (99%, Fisher scientific) and n-hexane (95%, Carl Roth).The 0.1 M KOH and 0.5 M NaOH electrolyte was prepared from KOH pellets (>85%, Grüssing) and NaOH pellets (99%, Grüssing), respectively, with addition of deionized water (house line). For the ink in half cell measurements, water (house line), Nafion® solution (5 wt%, Sigma Aldrich) and isopropanol (99.5%, Fisher Scientific) were used. The EOR electrolyte was prepared by addition of ethanol (99.8%, Carl Roth).
Synthesis of IrSn and IrNi NPs
The synthesis from Erini et al.22 has been adapted to Ir-based systems. For the preparation of IrSn and IrNi NPs, the metal salts Ir(acac)3 [0.8 eq.] and Sn(ac)2 [0.2 eq.] or Ni(ac)2·4H2O [0.2 eq.] were calculated to yield a total amount of 50 mg of reduced metal. The precursors were suspended in 8.5 mL DEDB. As a reducing substance 482 mg 1,2-tetradecanediol [1.26 mmol] and the capping agents 82.5 μL OAm [0.18 mmol] and 400 μL OAc [1.26 mmol] were added. The opaque orange suspension was stirred inside a heating mantle and heated to reflux at a temperature of 255 °C for 4 h in a nitrogen atmosphere. The formation of NPs was initiated by a change to a darker orange colour and finally the precipitation of a black reaction mixture. After cooling down, 10 mL acetone was added and the suspension aged overnight. 50 mg of Vulcan XC 72 pellets were dispersed ultrasonically in 7 mL n-hexane for 1 h on ice. Subsequently the NP suspension was added with a mixture of 3 mL acetone and 3 mL n-hexane to the carbon support, dispersed ultrasonically for 1 h on ice and stirred overnight. The catalyst was collected via centrifugation for 20 min at 10![[thin space (1/6-em)]](https://www.rsc.org/images/entities/char_2009.gif) 000 rpm and the supernatant discarded. To remove residual organics, the material was washed twice with 3 mL n-hexane, dispersed for 2 min in the ultrasonic bath, precipitated with 3 mL acetone and collected via centrifugation for 20 min at 10000 rpm. The as prepared catalysts are labelled IrSn and IrNi. In the case of IrSn the synthesis needed to be repeated (denoted as IrSn_N°2), as sufficient material was not available for all experiments within the first batch. After drying in air, the obtained yield of the capping agent coated IrSn and IrNi on carbon was determined as the ratio between the final mass in relation to the initial mass. As the initial mass, the calculated, anticipated mass of metal (assuming overall reduction) plus the carbon mass was used. Yields of 97% for IrSn (116% for IrSn_N°2) and 108% for IrNi were obtained. A value >100% indicates that additional species, e.g. capping agent residuals are contributing to the catalyst mass after drying. A value of 100% or lower does not necessarily mean that no capping agents residuals are present, but more likely, that the overall metal precursors were not reduced or during the individual steps a partial mass loss occurred. In the case of IrSn, all experiments were made with the first batch of IrSn, only for IL-TEM IrSn_N°2 was required. The near surface elemental composition of both IrSn catalysts was checked by XPS (compare Table S1, ESI† for elemental compositions).
000 rpm and the supernatant discarded. To remove residual organics, the material was washed twice with 3 mL n-hexane, dispersed for 2 min in the ultrasonic bath, precipitated with 3 mL acetone and collected via centrifugation for 20 min at 10000 rpm. The as prepared catalysts are labelled IrSn and IrNi. In the case of IrSn the synthesis needed to be repeated (denoted as IrSn_N°2), as sufficient material was not available for all experiments within the first batch. After drying in air, the obtained yield of the capping agent coated IrSn and IrNi on carbon was determined as the ratio between the final mass in relation to the initial mass. As the initial mass, the calculated, anticipated mass of metal (assuming overall reduction) plus the carbon mass was used. Yields of 97% for IrSn (116% for IrSn_N°2) and 108% for IrNi were obtained. A value >100% indicates that additional species, e.g. capping agent residuals are contributing to the catalyst mass after drying. A value of 100% or lower does not necessarily mean that no capping agents residuals are present, but more likely, that the overall metal precursors were not reduced or during the individual steps a partial mass loss occurred. In the case of IrSn, all experiments were made with the first batch of IrSn, only for IL-TEM IrSn_N°2 was required. The near surface elemental composition of both IrSn catalysts was checked by XPS (compare Table S1, ESI† for elemental compositions).
Capping agent removal protocol
The experimental part related to the electrochemical and structural characterization can be found in the ESI.†
Results and discussion
A time-consuming thermal treatment is regularly used for cleaning polyol-synthesized NPs capped with surfactants.22 In order to investigate the influence of each of the reported heating steps, two iridium-based catalysts, IrSn and IrNi, were prepared via polyol synthesis and subjected to a thermal heating routine of subsequent cleaning steps in N2 (280 °C), N2/O2 (250 °C) and H2 atmospheres (400 °C) as is described by e.g. Strasser's group22,23 and others.24 The individual steps of the cleaning protocol (see Experimental section) are evaluated in the following. The near surface bimetallic ratios of the spherical particles with the size of 1.7 ± 0.5 nm and 2.0 ± 0.5 nm (TEM) were Ir0.6Sn0.4 and Ir0.9Ni0.1, with an iridium loading of 35 wt% and 33 wt%, respectively, as determined by XPS analysis. These bimetallic ratios have been optimized in previous work for the at hand synthesis route with respect to EOR activity (EOR activity per geometric area, see Fig. S1, ESI†). Details of the elemental composition are found in Table S1 (ESI†).In the following we will first discuss the impact of each of the cleaning steps on the structural and chemical composition of the catalyst and then discuss the impact on the ECSA and EOR activity.
Impact of thermal treatment steps on structural composition
In order to see whether the cleaning steps induce crystalline growth or alloy formation, X-ray powder diffraction was performed on the samples and the diffractograms are shown in Fig. 1.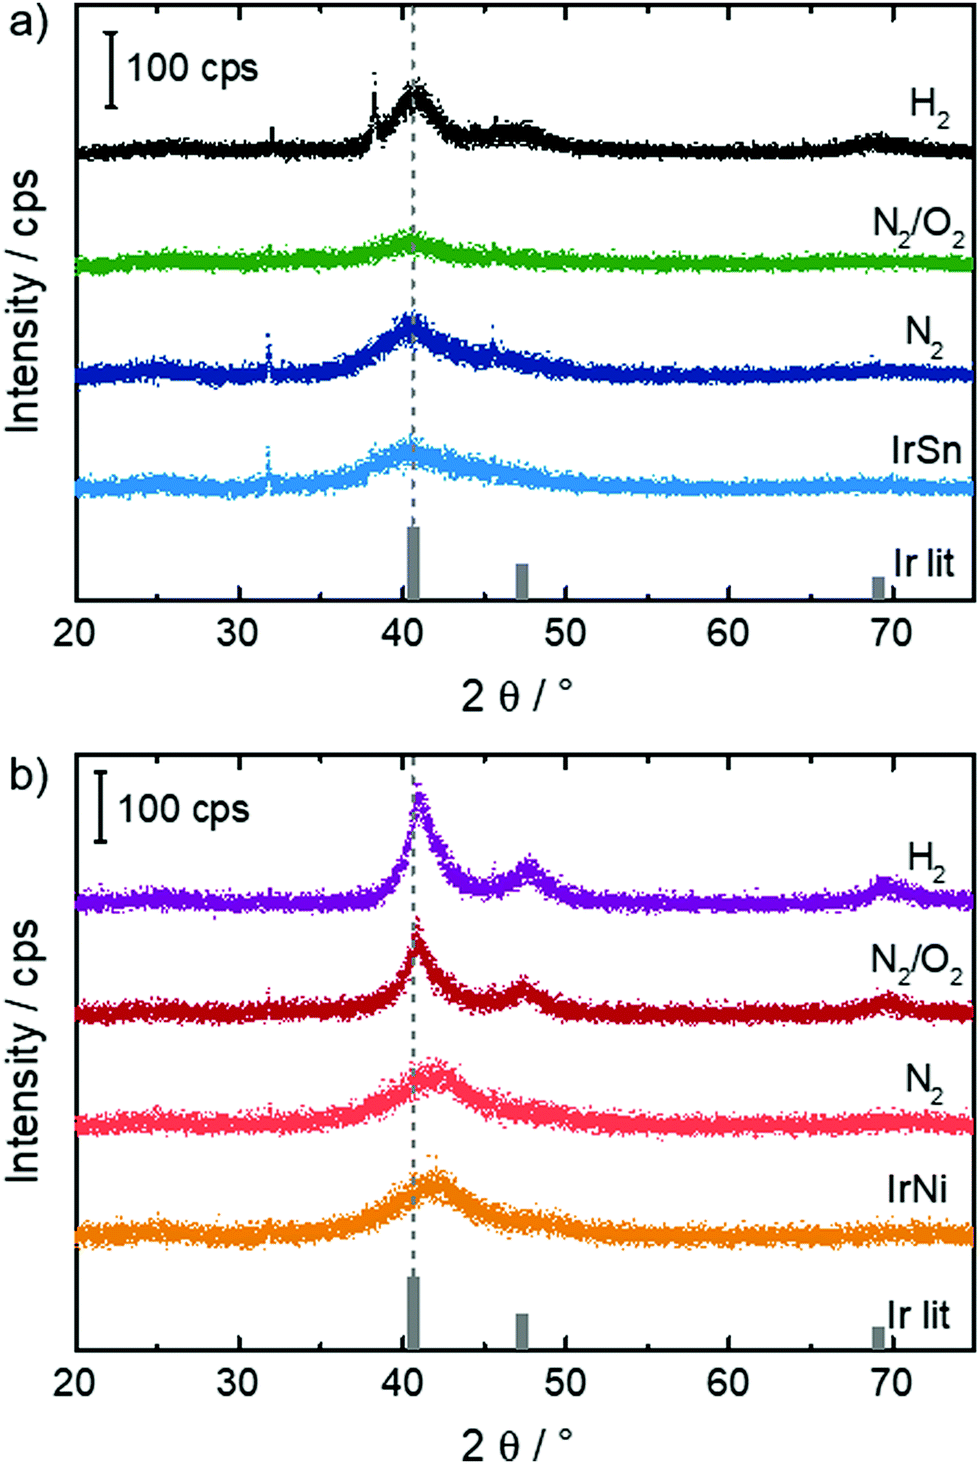 | ||
| Fig. 1 XRD of (a) IrSn (Ir0.6Sn0.4) and (b) IrNi (Ir0.9Ni0.1) (XPS concentrations) catalysts with subsequent heatings as indicated. The Ir fcc literature reflexes29 are added for comparison with the bimetallic reflex positions. | ||
Ir is known to crystallize in an fcc structure (Fm![[3 with combining macron]](https://www.rsc.org/images/entities/char_0033_0304.gif) m, a = 3.839 Å).25 Ni (Fmm, a = 3.524 Å) is known to be soluble in Ir.26 In contrast, Ir and Sn are known to form ordered intermetallic phases such as IrSn2, the structure of which is derived from an fcc packing of Ir with Sn filling all of the tetrahedral sites (Fmm, a = 6.34 Å),27 or IrSn (P63/mmc, a = 3.98 Å, c = 5.63 Å).28 Although those phases can be easily distinguished from iridium in the well-crystallized state by XRD, their patterns appear rather similar once strong reflection broadening sets in, since the strongest reflections fairly coincide with the ones expected from fcc packing.
m, a = 3.839 Å).25 Ni (Fmm, a = 3.524 Å) is known to be soluble in Ir.26 In contrast, Ir and Sn are known to form ordered intermetallic phases such as IrSn2, the structure of which is derived from an fcc packing of Ir with Sn filling all of the tetrahedral sites (Fmm, a = 6.34 Å),27 or IrSn (P63/mmc, a = 3.98 Å, c = 5.63 Å).28 Although those phases can be easily distinguished from iridium in the well-crystallized state by XRD, their patterns appear rather similar once strong reflection broadening sets in, since the strongest reflections fairly coincide with the ones expected from fcc packing.
For IrSn, broad reflections were found for the initial IrSn as well as the IrSn-N2 sample. In both cases, a small indication was given for the formation of nanoparticulate IrSn2 or IrSn in addition to Ir due to broad reflections around 25° 2θ, which would however strongly overlap with a similar broad reflection from the Vulcan additive at the same angular range and was therefore not considered for the final analysis. By treatment in N2/O2 the crystallite size decreases slightly which might be caused by the formation of an amorphous oxidic layer. After H2 treatment a sharpening of the reflection and increase of the crystallite size from 1–1.5 nm to 2–2.5 nm can be observed (see Table S2, ESI†). On H2 treatment, the formation of a small amount of an additional cubic, presumably Sn-rich phase with high crystallite size in the order of ∼40 nm is found.
For IrNi, a pronounced reflection asymmetry was found for the samples IrNi and IrNi-N2, which is indicative for the formation of nanoparticles with slightly inhomogeneous Ni content. On heating (IrNi-N2/O2 and IrNi-H2), a small degree of recrystallization occurs with changes of the crystallite size similar to that in the IrSn system. Then, the reflections become more symmetric, with a lattice parameter resembling that of metallic Ir, which causes an apparent shift. This is indicative of a dealloying process or strong segregation in both cases, which is most pronounced after treatment with H2. All investigated catalysts reveal to some extent reflexes at 31.8 and 45.5° 2θ. The origin of both, however, remains unclear, as they do not match expectations for the Ir-Sn and Ir-Ni systems, while a contribution of the sample holder can also be excluded.
The lattice spacing is a known descriptor of the activity of electrocatalytic reactions.30 In the course of the cleaning steps the two parameters, crystalline size and lattice spacing, change to different degrees for the two metal combinations. Nevertheless, in both cases, the strongest effect is found after applying the N2/O2 heating. Further, a dealloying/segregation process and crystallite growth influence EOR activity and selectivity. The extent of their impact is not in the scope of this paper but they are possible factors. In order to see whether crystallite growth is also visible in TEM, measurements at identical locations (IL-TEM) were performed and are discussed in the following.
Analysis of transmission electron microscopy images
IL-TEM was used to follow changes as a consequence of N2 or N2/O2 treatment. For the IrSn catalyst a second and identically prepared catalyst batch was used and denoted as IrSn_N°2. In the ESI,† Fig. S2, the related TEM images are shown. Neither particle growth, detachment nor sintering is directly visible from Fig. S2 (ESI†). Circles were added to highlight characteristic areas. In terms of particle size distribution, as given in Fig. 2, there is a slight increase for the treatment in N2 and N2/O2, but is not well pronounced. The situation changes when applying the annealing step in H2. For both catalysts, the particles become larger, almost double for IrNi-H2, compared to the initial catalyst. These results are in line with the discussion of the powder diffractograms where the narrowing of the line shape after the H2 step is assigned to an increasing crystallite size. (Please note, the last step of the cleaning protocol was not applied to the IL-TEM mesh but on the catalyst powder and subsequently compared to the initial catalyst.)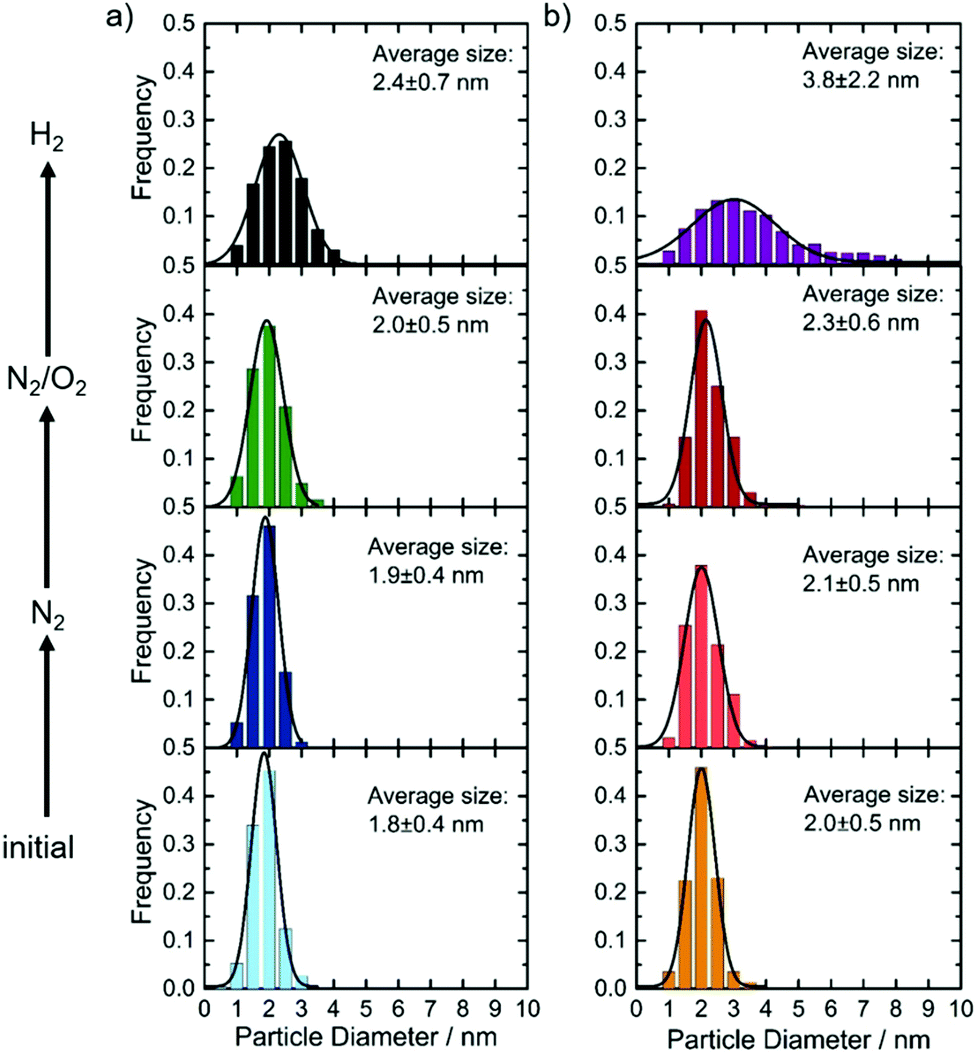 | ||
| Fig. 2 Comparison of the effect of the different cleaning steps on the particle size distribution for (a) IrSn and (b) IrNi catalysts. The average particle size was determined from counting of the particles (>200 particles), in the case of initial, N2 and N2/O2 identified in IL-TEM images. In the case of H2 treatment step it was determined from conventional TEM images. | ||
In a next step, the changes on the surface of the nanoparticles were investigated by FT-IR.
Analysis of FT-IR spectra
The capping agents OAm and OAc contain functional groups and an aliphatic backbone which induces specific IR-active modes. Their presence on the NPs before and after the different cleaning steps is monitored by FT-IR spectra in Fig. 3. At first, the spectra of the untreated IrSn and IrNi catalysts (Fig. 3d) are discussed.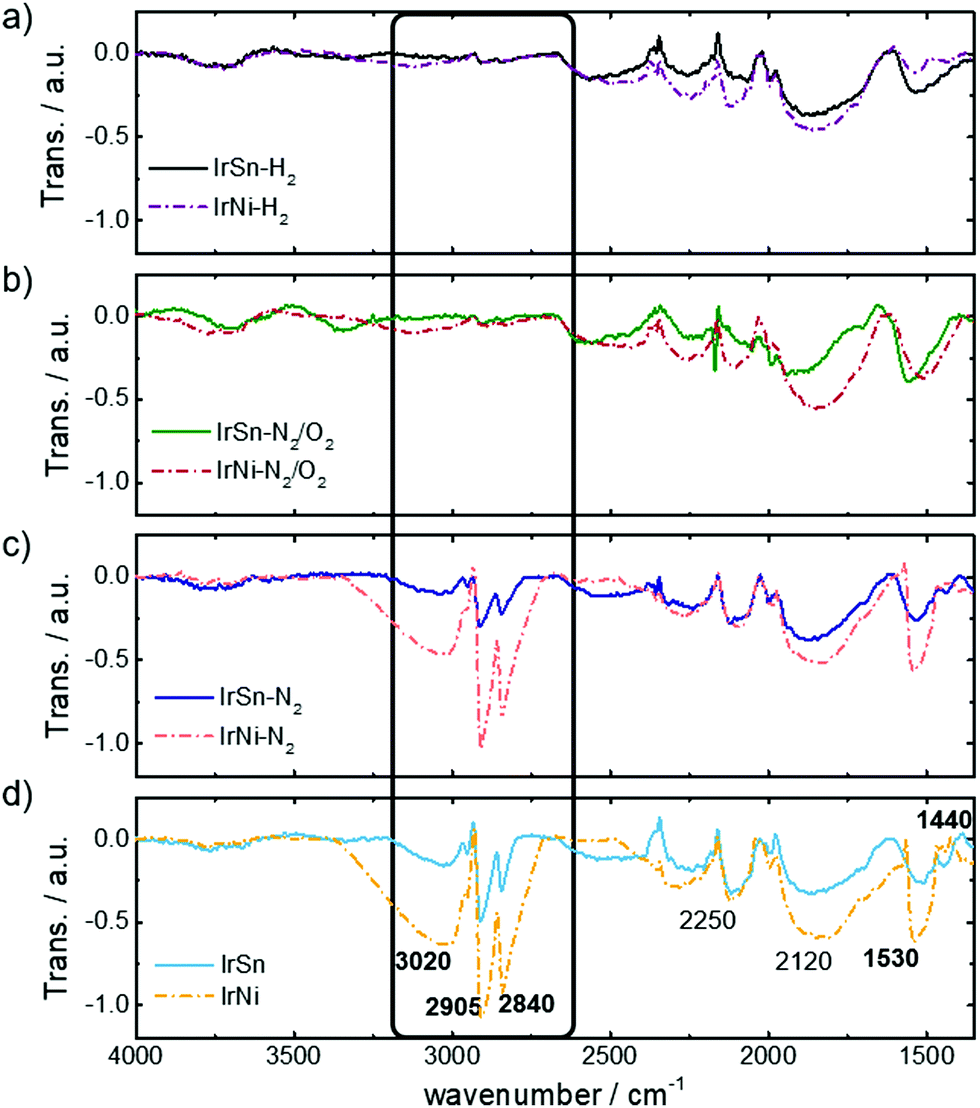 | ||
| Fig. 3 FT-IR spectra of the pristine IrSn and IrNi catalysts (bottom, d) and after the different cleaning steps in N2 (c), N2/O2 (b) and H2 (a) gas atmosphere. See main text for the assignment of indicated bands. | ||
The stretching bands of vinyl and alkyl C–H and metal bound carbonyl are specific for the used capping agents OAc and OAm. The vinyl group of the aliphatic backbone in OAm and OAc induces a broad stretching band ν(![[double bond, length as m-dash]](https://www.rsc.org/images/entities/char_e001.gif) C–H) at 3040–3010 cm−1.31 Furthermore, the shoulder νas(C–H3) at 2950 cm−1,32,33 and the intense and sharp bands νas(C–H2) at 2905 cm−1 and νs(C–H2) 2840 cm−1 arise from the alkyl chain of the capping agents.14,34,35
C–H) at 3040–3010 cm−1.31 Furthermore, the shoulder νas(C–H3) at 2950 cm−1,32,33 and the intense and sharp bands νas(C–H2) at 2905 cm−1 and νs(C–H2) 2840 cm−1 arise from the alkyl chain of the capping agents.14,34,35
The most specific band of pure liquid OAc is the sharp CO stretching mode at 1705–1710 cm−1 which is induced from monodentate coordinated OAc as well.31,34,36 This mode is not observed in any of the IR data shown in Fig. 3 and therefore neither free acid or monodentate OAc are present on the catalyst surface. The untreated IrSn and IrNi NPs in Fig. 3d exhibit carbonyl stretching bonds νas(COO–metal) at 1530–1540 cm−1 and νs(COO–metal) at 1440 cm−1 corresponding to the downshift of the COO− band by coordination to a metal.32,34–38
Therefore, only covalently bound OAc but no free OAc is present on the catalyst surface suggesting the removal of excess OAc during washing and precipitation steps in hexane/acetone. The band positions of νas(COO–metal) and νs(COO–metal) indicate a chelating bidentate interaction between COO− and metal.35,37,38 The presence of a bidentate chelation is confirmed by a carbonyl band separation of Δ(νas − νs) ≈ 100 cm−1.35
The spectra do not show the amine specific feature of νs(N–H) stretching at 3300–3320 cm−1,31,34 or νs(N–H2) scissoring at 1593 cm−1,31 as observed by Liu et al.20 and Xu et al.39 on Pt and Fe oxide NPs purely capped by OAm. These findings are in agreement with the spectra of OAc/OAm mixtures on NPs in the literature, where the νs(N–H) stretching and νs(N–H2) scissoring mode in IR spectra are observed as broad, poorly defined bands and shoulders, which are overlapping with the νas(COO–metal) mode or are not observed at all.31,34,36 In addition, a lower content of OAm is present in the capping agent mixture compared to OAc (OAm:OAc = 1:7) and therefore contributes less to the spectra than OAc. Bands in the middle frequency region, 2250 cm−1 and 2120 cm−1, are attributed to the aromatics of the Vulcan® support. The assignment of FT-IR bands is summarised in Table S3 (ESI†).
The intensities of the bands are always more pronounced for the IrNi catalyst compared to IrSn. This appears for the pristine catalysts and also remains for all steps of cleaning.
After subjecting the catalysts to the cleaning procedure, there is a decrease in the capping agent specific bands. Again, the crucial step is the oxidative removal during heating under N2/O2. Fig. 3b shows the removal of OAc/OAm by diminishing of the alkyl chain vibrations νas(C–H3) at 2950 cm−1, νas(C–H2) at 2905 cm−1 and νs(C–H2) 2840 cm−1. These results are in agreement with the disappearance of alkyl stretching vibrations after OAm removal by thermal annealing in air at 185 °C.20 Furthermore, the bands of the OAc coordinated carbonyl to metal surface ν(COO–Me) are reduced especially for IrNi-N2/O2 and IrNi-H2, indicating the removal of the capping agent during these steps. For IrSn-N2/O2 and IrSn-H2 the νas(COO–Me) at 1530–1540 cm−1 is still present but not the νs(COO–Me) at 1440 cm−1. However, since the alkyl chain bands have vanished the removal of the capping agents and organic residuals is successful. The nature of this band remains unclear, but it might be connected to a partial oxidation of the surface (compare XRD and XPS) induced by N2/O2 treatment.
TGA data showed that OAm on Pt NPs is completely removed at 185 °C/air,14,20 whereas OAc desorbed from Fe3O4 NPs in inert atmosphere only around 400 °C/N2.35 An OAc/OAm mixture on PtVFe NPs was completely decomposed at 300 °C in 20% O2.40 These literature data are comparable to what is found in this study, suggesting that heating in N2 at 280 °C does not remove a chemisorbed OAc/OAm mixture from the NP surface but after 250 °C in air significant amounts are decomposed. The additional step in H2 atmosphere does not seem to be required for capping agent removal: no further change in the FT-IR spectra is found because the capping agents were already removed before, namely during the N2/O2 step.
In the following, conclusions drawn from FT-IR are reviewed using XPS.
Analysis of X-ray photoelectron spectra
XPS was employed to obtain the surface near elemental composition and chemical states of the catalysts. The chemical composition in terms of atomic ratios are listed in Table S1 (ESI†). As expected, the catalysts contain the elements Sn or Ni, Ir, O and C. The metal ratios were Ir0.6Sn0.4 for IrSn and Ir0.9Ni0.1 for IrNi. The bimetallic ratios stay constant in the course of the cleaning procedure regarding the margin of error (±5–10%). Ni is significantly less built into the catalysts compared to Sn. In general, a solid solution of IrNi can form over the whole composition range, whereas for a crystalline combination of Ir with Sn different IrxSny phases and no alloy formation are reported.41The most pronounced changes are assigned to the increase of the O, Ir, Ni and Sn contents and the decrease of the C content after the N2/O2 cleaning step. On this account, the narrow spectra of C 1s are analysed in more detail in Fig. 4a and b. The main component of all catalysts is sp2 bonded carbon (284.3 eV) corresponding to the graphene layers of the Vulcan® support. Besides the sp2 hybridized C species, significant amounts of sp3 (18–38%, 285.2 eV) within the carbon are present in the initial catalysts as well.
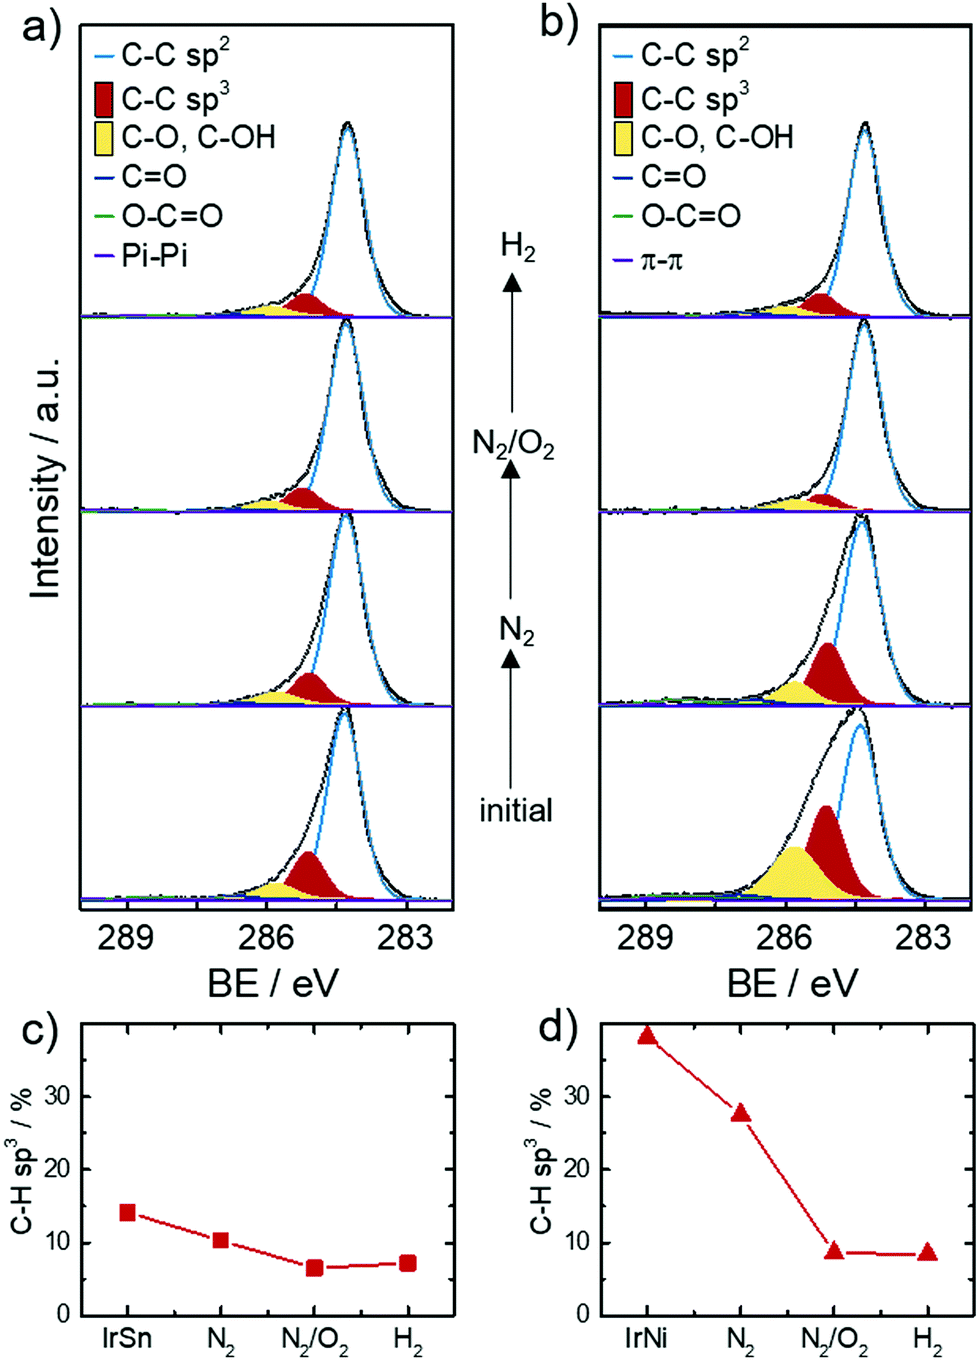 | ||
| Fig. 4 XPS narrow scans of C 1s (a) IrSn (Ir0.7Sn0.3) and (b) IrNi (Ir0.9Ni0.1) with subsequent cleaning steps. Deconvolution and species assignment according to the Experimental section, all spectra are normalized to the maximum intensity. In (c) and (d) the change in content of CH–sp3 species determined from C 1s spectra in the course of the cleaning protocol is shown for IrSn and IrNi. | ||
Ether bound carbons have a 7–11% share and carbonyl/carboxylic carbons a 2–4% share of the total carbon content. Monodentate capping agents contribute to the C–O, C–N (286.0 eV) and CO (287.2 eV) species and bidentate ones to O–CO (288.7–289.4 eV).42 Morever, carbon blacks like Vulcan® are known to contain carbon–oxygen surface groups introduced during their production. The type of surface oxide (e.g. acidic or basic) changes with increasing temperature and varying atmosphere.43 The contribution of the support to carbon–oxygen species impedes their informative value in respect to capping agent removal. The role of sp3 carbon is of importance as it is the main carbon speciation of the saturated C–H chain in the capping agents OAc and OAm. For example, sp3 is the dominant carbon species found in the XPS analysis of OAm/OAc capped Fe3O4 NPs.42 XPS spectra from Wilson et al.42 also showed a decrease of aliphatic carbon due to the decomposition of the aliphatic tail when heating the samples from 250 °C to 550 °C in ultra-high vacuum (UHV).
Based on this discussion, Fig. 4c and d illustrate the development of the sp3 carbon content in the C 1s spectra with subsequent cleaning steps. After the N2 step and the N2/O2 step the sp3 content decreases and stays approximately constant after the H2 step. This trend evidences that the capping agent removal was initiated by the N2 step and completed under N2/O2. These results fit well with the FT-IR spectra that showed OAc/OAm was still present after heating under N2 but was completely removed after heating under N2/O2. XPS analysis of the sp3 carbon has not yet been reported in the literature as a reference to compare different capping agent removal procedures but was found to be a valuable parameter in this work.
For the sake of completeness, the narrow scans of the Ir 4f, Sn 3d, Ni 2p and O 1s orbital are found in Fig. S3 (IrSn) and S4 (ESI†) (IrNi). The O 1s orbital is deconvoluted in metal oxides (MeO), metal hydroxides (MeOH), carbonyl/ether (C–O, CO) and carboxyl (O–CO) species. According to the literature, the organic oxygen species are shifted to slightly lower binding energies in order to correspond to monodentate (C–O, CO at 531.4–531.9 eV) and bidentate (O–CO at 533.0–533.4 eV) coordinated capping agents.42 Other functional oxygen groups are present on the carbon of the Vulcan® support in the initial catalysts and can be formed or diminished in the course of the cleaning procedure. Therefore, the O 1s spectra are not used to follow the removal of the capping agent OAc.
The oxidation states of the metals have in general a strong influence on the catalytic activity. However, the precious element Ir shows already mixed metallic and oxidic states in the initial catalysts but also in the course of the cleaning steps. Only a slight increase of the oxide component is noticed for both samples after the N2/O2 step (IrSn-N2/O2 and IrNi-N2/O2) from Fig. S3 and S4 (ESI†). The small changes in the Ir oxide content are not supposed to change the EOR activity to the extent discussed in the following section and are summarised in Fig. 8.
The activity trends for IrSn-N2/O2 and IrNi-N2/O2 are reversed and at the same time the Ir4+ contents increased. Even though SnO2 was not detected in the XRD, the XPS analysis reveals that tin is mainly composed of Sn4+ but the contributions of Sn2+ are also present in the initial IrSn catalyst. The metallic state Sn0 has a minor contribution. Du et al. explained the existence of SnO2 in XANES and EXAFS spectra and its absence in the diffraction pattern of an IrSn catalyst with the amorphous structure of Sn oxides.44 This behaviour is coherent for the presented catalyst system as well. In the course of the cleaning protocol Sn2+ is converted to Sn4+ according to the shift in XPS binding energies in Fig. S3 (ESI†). Even after the reductive atmosphere the major Sn state is Sn4+ with 93% within the Sn 3d. The XANES and EXAFS spectra showed that alloyed IrSn is obtained at 205 °C in H2 which transforms to SnO2 when exposed to air, even at room temperature.44 Similarly to Ir the Sn oxidation states do not follow activity trends observed for EOR in Fig. 8 (see below). In Fig. S4 (ESI†) the signal-to-noise ratio of Ni 2p in the IrNi catalysts is too low for a quantitative chemical state analysis but different metallic, oxide and hydroxide species do exist. The atomic concentrations assigned to the different iridium and tin oxidation states for IrSn, as well as iridium and nickel for IrNi, are plotted as a function of the treatment step in Fig. S6 (ESI†); we will refer to it, when discussing the EOR activity.
After analysing the morphological and surface related changes, we would like to investigate the related changes in the electrochemical behaviour in the following.
Electrochemical analysis
The untreated IrSn and IrNi catalysts were subjected to a potential cycling between 0.0 and 0.8 VRHE with 0.5 V s−1 in 0.5 M NaOH previous to the underpotential hydrogen adsorption/desorption (Hupd) and EOR evaluation. This electrochemical pre-treatment was reported to remove the capping agents OAc/OAm from Pt nanocubes by Yang et al.18The CVs in N2-saturated 0.1 M KOH are shown in Fig. 5 for the pristine catalysts and after different thermal treatment steps. The evaluation of Hupd processes is a commonly applied method for platinum and other noble metals like iridium.45,46 The reversibility and definition of the adsorption and desorption states is a measure of the surface cleanliness.10,16,47 Furthermore, the transferred charge is proportional to the number of accessible surface atoms;10,45 in turn, those are active centres for electrocatalytic reactions like the herein studied EOR.
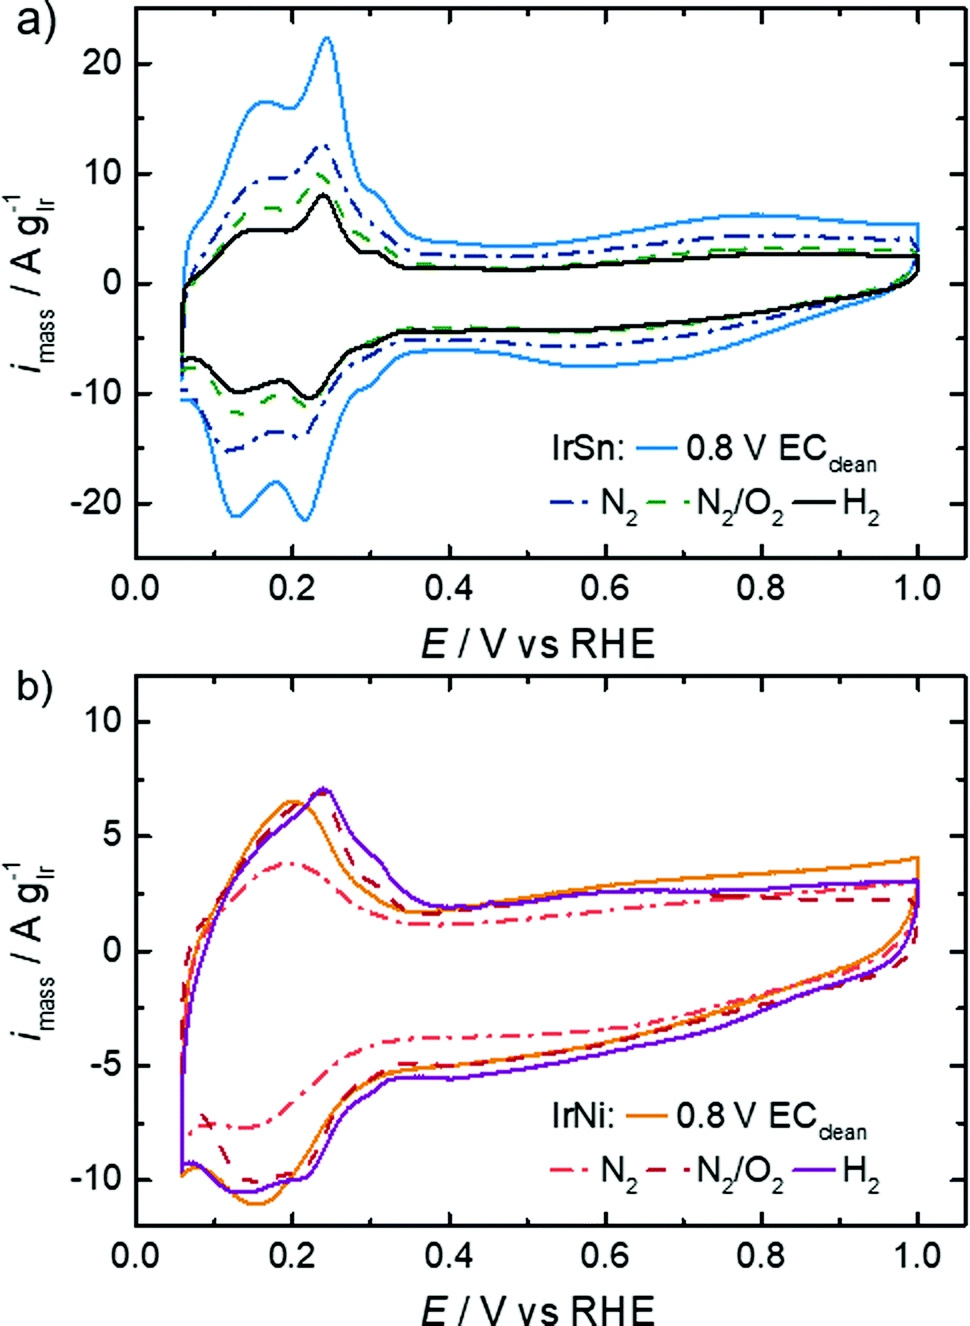 | ||
| Fig. 5 CVs of IrSn and IrNi catalysts after the corresponding cleaning steps in N2-saturated 0.1 M KOH with a sweep rate of 10 mV s−1 and 84 μg cm−2 catalyst loading. The uncleaned catalysts were previously subjected to fast potential sweeps between 0.0 and 0.8 VRHE in 0.5 M NaOH. All displayed CVs are taken after activation scans between 0.06 and 1.0 VRHE (see the Experimental part for details). | ||
The profiles of the untreated IrSn NPs in Fig. 5 already show developed characteristic features of hydrogen ad/desorption (0.06–0.35 VRHE), double layer formation (0.4–0.5 VRHE) and formation of (hydr)oxide species (>0.6 V VRHE). However, the untreated IrNi catalyst exhibits far less developed Hupd and oxide formation regions. At first view, it seems that in the course of the cleaning steps the IrSn catalysts decrease in double layer capacitance with every step. If for both catalyst variation series, instead of the current densities being normalised to the iridium content (A gIr−1), the geometric current densities (mA cmgeom.−2) are considered (see Fig. S5 in ESI†), the differences between the samples are marginal except for the EC-cleaned IrSn. The main contribution to the double layer capacitance is the adsorption of solvated molecules on the catalyst surface. Thus, surface related variations of the different elements in the catalyst, or a change in the type of adsorbed species could be at the origin of the higher capacity for IrSn. In Fig. S5 (ESI†), the CV of the uncleaned IrSn sample is included and gives similar values to the thermally annealed samples. Based on this, it is assumed, that the EC cleaning protocol is the origin of this change. As such an effect cannot be found for IrNi, it is assumed that for IrSn possibly residuals from the EC cleaning in NaOH remained attached on the surface and might have contributed to the change in the double layer capacitance by a change in the cation size.
The anodic sweeps of IrSn NPs are marked with a peak at 0.24 VRHE and two shoulders at 0.17 VRHE and 0.30 VRHE, originating from different H-binding energies of Ir low index facets. These Hupd peak positions are in accordance with reported voltammograms of Ir NPs/nanostructures/wires in alkaline solutions.48–50 In comparison to acidic solutions, the higher H-binding energy with increasing pH is shifting the position to more positive potentials by ≈10 mVRHE pH−1.51 The Hupd features are present for IrSn catalysts after all examined cleaning steps. However, after the N2/O2 step the shoulders in the Hupd region do take shape and symmetry for IrSn-N2/O2 and IrSn-H2, indicating a surface cleaning process.10,47
On the contrary, the CV of untreated IrNi in Fig. 5 shows exclusively one broad maximum at 0.20 VRHE in the anodic sweep. Heating the catalyst under N2 atmosphere (IrNi-N2) decreases the double layer capacity. In addition, the Hupd maximum is broadening. After the N2/O2 step (IrNi-N2/O2) the Hupd peak is shifted to 0.23 VRHE and a shoulder at 0.31 VRHE develops. The H2 step (IrNi-H2) is increasing the capacity slightly but the peak and shoulder shapes are remaining. Surface cleaning is again indicated to proceed during the N2/O2 cleaning step. For the ECSA evaluation, an appropriate subtraction of current contributions, resulting from the double layer charging and the hydrogen evolution reaction, is required which is described in the Experimental section. In Fig. 6 the ECSAs for IrSn and IrNi in the course of the cleaning steps are displayed. IrSn is starting with a higher ECSA of 156 m2 gIr−1 than IrNi with 55 m2 gIr−1 which is in accordance with their different Hupd shapes in the CVs. In addition, the ECSA also reflects a different behaviour with subsequent cleaning steps:
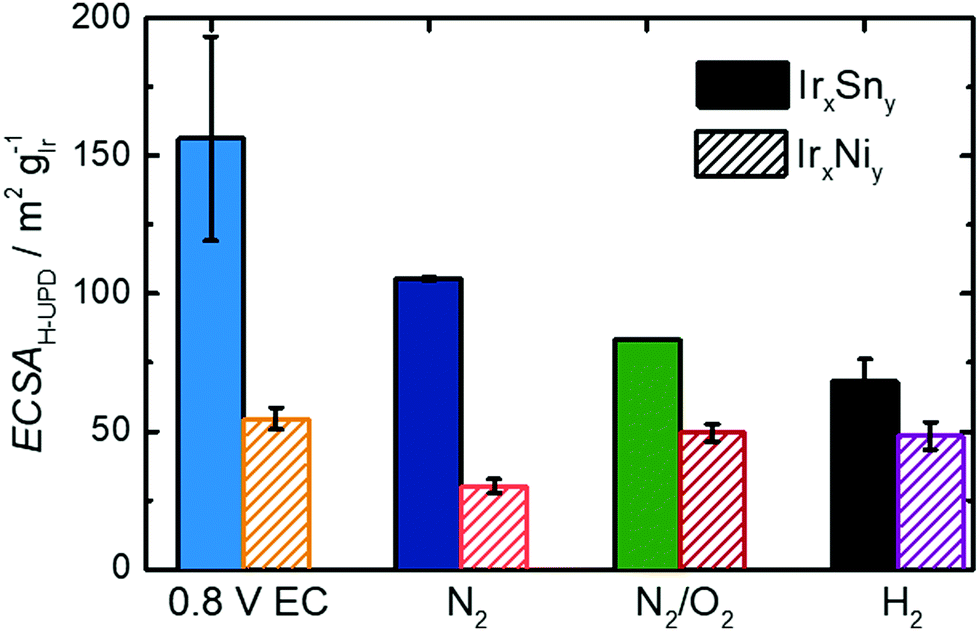 | ||
| Fig. 6 ECSA of IrSn and IrNi catalysts and after the corresponding cleaning steps in N2-saturated 0.1 M KOH with a sweep rate of 10 mV s−1 and 84 μg cm−2 catalyst loading. The uncleaned catalysts were previously subjected to fast potential sweeps at 0.0–0.8 VRHE in 0.5 M NaOH. All displayed values are taken after activation scans at 0.06–1.0 VRHE. | ||
The IrSn catalyst loses ECSA with every cleaning step down to 68 m2 gIr−1 whereas IrNi drops to 30 m2 gIr−1 after heating in N2 (IrNi-N2), recovers at 49 m2 gIr−1 after N2/O2 (IrNi-N2/O2) and stays constant thereafter. Hydrogen under potential deposition requires the iridium to appear in the metallic state. While there is no obvious correlation for both individual series, considering both sample series, a higher content of Ir0 leads to higher ECSA value (see Fig. S6c, ESI†). To what extent the derived structural and surface related changes affect the EOR activity will be addressed in the next part.
Activity towards the ethanol oxidation reaction
In order to evaluate the activity of these bimetallic catalysts, the ethanol oxidation reaction was investigated. In the literature, it is reported that the main reaction product on Pt and Ir in the alkaline solution is acetate, but Ir is also capable of C–C bond splitting because of a stronger metal–ethanol interaction.52 In comparison to Pt, Ir has a more oxophilic surface which enables the formation of an OHads layer at low potentials starting from 0.3 to 0.4 VRHE in alkaline solution.49,51 For Ir(111) single crystals it was even evidenced at 0.3 VRHE in an alkaline electrolyte.52In Fig. 7, the CVs in 0.1 M KOH with 0.5 M EtOH for both sample series are shown. Focussing first on the IrSn catalysts the following observations can be made. The onset potential of 0.24 VRHE does not change with the cleaning steps and is in the same range as for truly bimetallic PtSn.53 During the anodic sweep all IrSn catalysts exhibit a broad oxidation current with two maxima at ∼0.6 VRHE and at ∼0.80 VRHE. According to Mancharan and Goodenough54 only the second peak is related to a complete oxidation of the alcohol, while the first indicates incomplete or residual oxidation. Contrary to the forward scans a much higher and defined oxidation peak is observed at a potential of 0.40 VRHE during the cathodic sweep of IrSn catalysts.
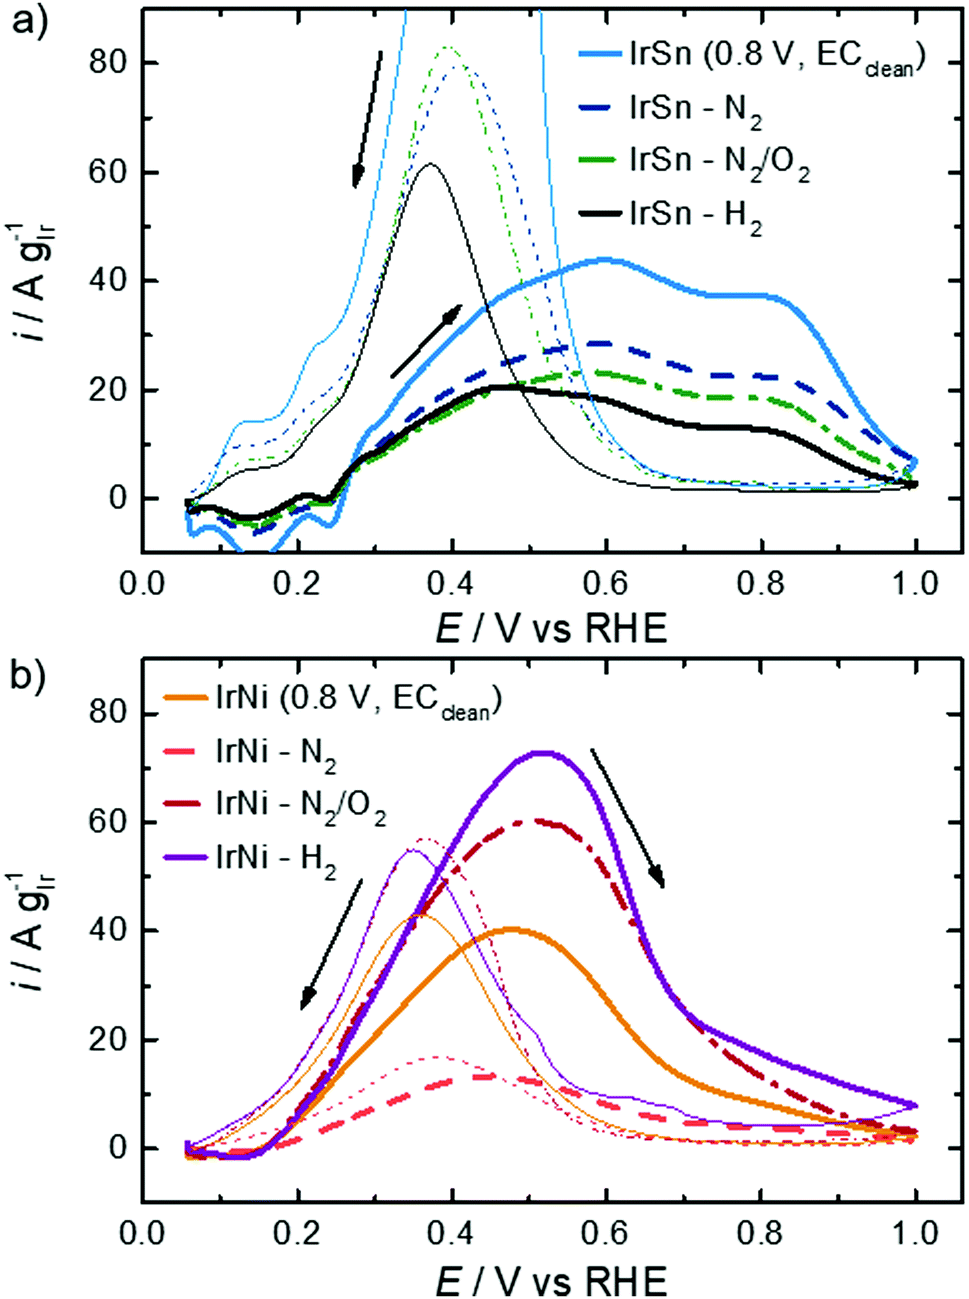 | ||
| Fig. 7 CVs of EOR on (a) IrSn, IrSn-N2, IrSn-N2/O2 and IrSn-H2 and (b) IrNi, IrNi-N2, IrNi-N2/O2 and IrNi-H2 in 0.1 M KOH with 0.5 M EtOH with a scan rate of 10 mV s−1 and 84 μg cm−2 catalyst loading. Curves were corrected for CVs in N2-saturated 0.1 M KOH. | ||
According to a recent work by Chung et al. the backward peak is indicative of the oxophilic character of the catalyst.55 This seems to be the highest for the EC-cleaned IrSn, gets much smaller but is similar for IrSn-N2 and Ir-N2/O2 and decreases further for IrSn-H2. The similarity in EOR activity for IrSn-N2 and Ir-N2/O2 was quite unexpected, as the N2/O2 treatment was confirmed to be the most relevant step for capping agent removal, as discussed before. Therefore, in the case of IrSn catalysts the capping agents do not block the iridium surface but might interact more strongly with tin.
For a complete oxidation of ethanol, the catalysts need to enable ethanol adsorption but should also provide sufficient OHads. The early formation of OH species on the electrode surface is notable by the overlapping between desorption of strongly bound H and adsorption of OH.49,56 From the CVs in Fig. 5 the onset of hydroxyl formation is therefore difficult to determine. The observable onset is around 0.5 VRHE for the IrSn catalysts.
Cao et al.57 reported two peaks during the anodic sweep at 0.45 VRHE and 1.0 VRHE and one oxidation peak during the cathodic sweep at 0.4 VRHE in 0.5 M H2SO4 for Ir3Sn. IrSn is EOR-active especially in the low potential region. However, the low peak potential results mainly from the oxidation to acetic acid without C–C-bond cleavage (in acidic electrolyte).44 Du et al.44 submitted a surfactant free IrSn catalyst to an annealing in H2 or oxidation in air. The XANES spectra of Sn K-edge revealed that the H2 at 205 °C and 300 °C induced the Ir–Sn alloy formation and reduced SnO2. In contrast, annealing in air at 250 °C dealloyed Ir–Sn and created SnO2. While in our work there is only minor difference in the performance of IrSn-N2/O2 and IrSn-H2, the EOR activity was almost an order of magnitude higher after H2 treatment in their work. Nevertheless, Du et al.44 already observed a decrease in activity from 205 °C to 300 °C; both temperatures are much smaller than the 400 °C used in this work. For future evaluation, other treatment temperatures should be considered, as well.
In Fig. 7b the IrNi catalysts are compared. Again, the onset potential of 0.13 VRHE does not change with cleaning steps but is lower than that for the IrSn catalysts with 0.24 VRHE. Also, the peak maximum related to EOR appears at a lower potential (ca. 0.5 VRHE). One explanation for the lowered onset and peak maximum for EOR on IrNi catalysts is the formation of OHads species at a lower potential, which can be observed in the CVs (Fig. 5b) at 0.4 VRHE. Overall, the EOR activity follows the expected trend based on the conclusions derived from structural analysis, namely a strong increase in activity from IrNi-N2 to IrNi-N2/O2 that is assigned to the capping agent removal and a further increase by hydrogen treatment that might be related to the increase in crystallinity. Concerning the reverse sweep of IrNi catalysts in Fig. 7, the oxidation peaks are observed at a potential of 0.37 VRHE but with a comparable peak current as during the forward scan. As the IrSn catalysts exhibited a quite pronounced anodic peak in the backward scan, but only reached low EOR activities while IrNi catalysts behaved almost opposite (high EOR activity in anodic sweep and much lower anodic peak in the backward scan), it seems that the high oxophilic character of IrSn catalysts leads to a blockage of metal sites for ethanol adsorption but the surface is mainly terminated by OHads and Oads.52
Not only is the onset and peak potential for EOR on IrNi lower than that for IrSn, but also the activity changes with cleaning steps differ between the bimetallic systems as depicted in Fig. 8. Both catalysts, without any thermal cleaning but after fast potential cycles in 0.5 M NaOH (for the electrochemical capping agent removal, denoted 0.8 V EC), display similar mass activities of 37 A gIr−1 and 43 A gIr−1 at 0.5 VRHE for IrSn and IrNi, respectively. After the N2 step both catalysts decrease in activity: the IrSn-N2 catalyst to 27 A gIr−1 and the IrNi-N2 catalyst to 13 A gIr−1. However, after the cleaning step in oxidative atmosphere the development of the two bimetallic systems diverges: IrSn-N2/O2 drops to 22 A gIr−1 while IrNi-N2/O2 increases to 57 A gIr−1. With the annealing step under a reductive atmosphere the activity of IrSn-H2 stays constant at 22 A gIr−1 whereas IrNi-H2 further increases to 77 A gIr−1.
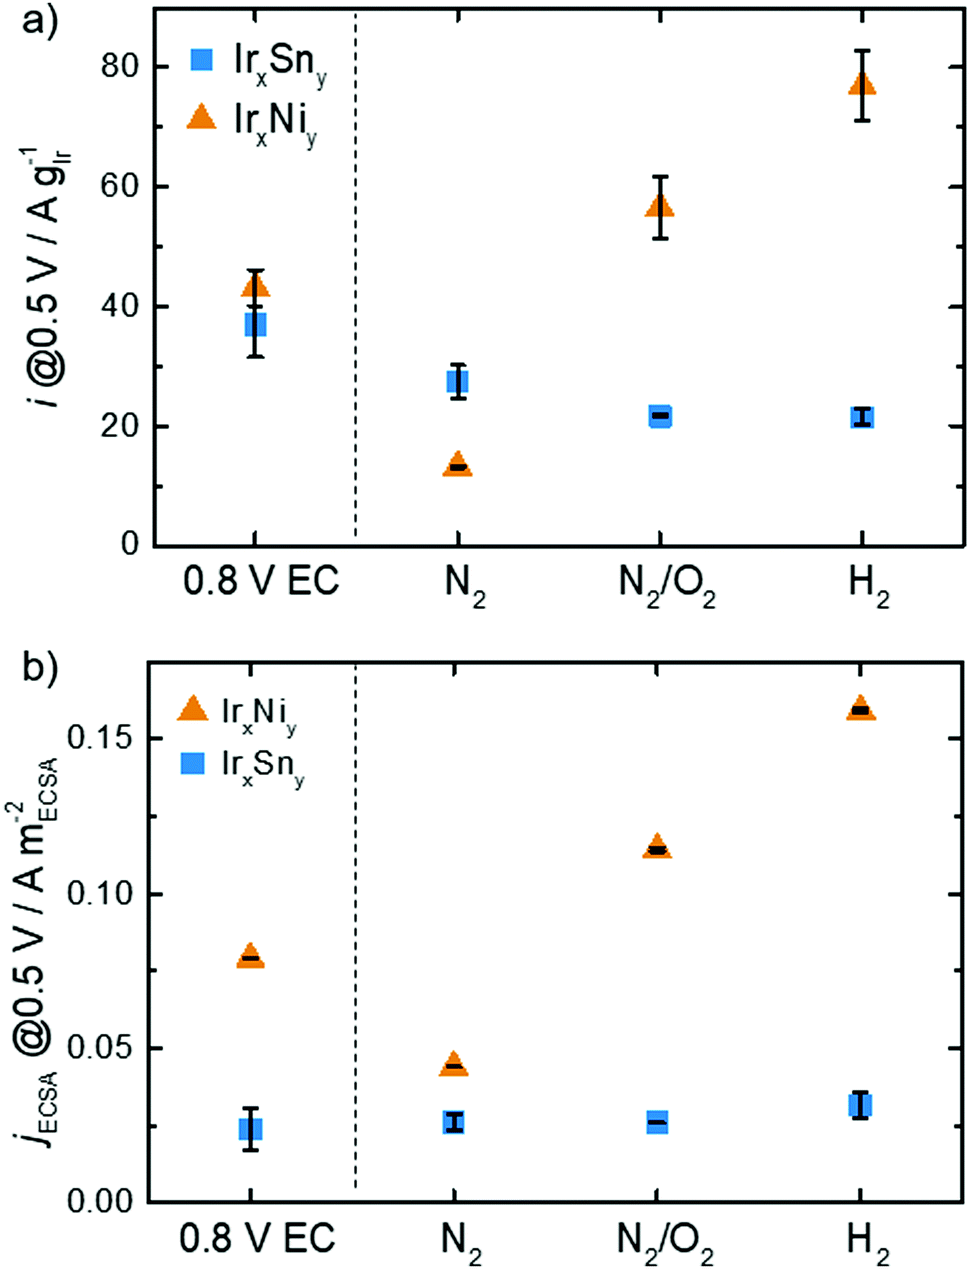 | ||
| Fig. 8 (a) EOR activity and (b) ECSA current density at 0.5 VRHE in 0.5 M EtOH of IrNi (Ir0.9Ni0.1) and IrSn (Ir0.6Sn0.4) (XPS concentrations) in the course of the cleaning steps (0.1 M KOH, N2-sat, 10 mV s−1, 84 μg cm−2 catalyst loading, N2 corrected). | ||
The ECSA is a strong descriptor for the catalytic activity of a given material. In order to elucidate if there the mass activity is solely a function of the ECSA, the current density is normalized to the ECSA calculated from HUPD and analysed in Fig. 8b. For IrSn the jECSA is almost constant with a slight increase to 32 mA mECSA−2 for IrSn-H2 compared to the initial value of 24 mA mECSA−2 for IrSn. Thus, the change in ECSA is responsible for the observed activity changes. The situation is different for IrNi: the ECSA is not the only parameter determining the EOR activity. Compared to the EC-cleaned sample with 79 mA mECSA−2 the current density drops to 44 mA mECSA−2 for IrNi-N2 and increases to 114 mA mECSA−2 and 159 mA mECSA−2 for IrNi-N2/O2 and IrNi-H2, respectively. As already discussed before, an increase in the crystallite size (Table S2, ESI†), and an increasing contribution of Ir0 as shown in Fig. S6, ESI† (up to the N2/O2 cleaning step) might contribute.
Conclusions
In this work, bimetallic IrSn and IrNi catalysts were synthesised using a polyol method using OAm and OAc as capping agents. It was investigated as to what type of morphological (XRD, IL-TEM) and surface related (FT-IR and XPS) changes occurred induced by each step of the thermal heating protocol. In particular, the analysis of the C 1s region in XPS was found to give important insights into chemical changes in the surface near region. The following conclusions can be made for each of the steps.Heating in N2: for the first heating in N2 at 280 °C there is no significant effect on either the morphology or the surface related composition of the nanoparticles. However, the ECSA decreased, so that even lower performance in comparison to the EC cleaned reference catalyst was obtained.
Heating in N2/O2: the second heating in air (N2/O2, 250 °C) is the most important step with respect to capping agent removal as evidenced by FT-IR and XPS. However, the effect on EOR activity was very different for the two catalysts. While there was an increase in the activity for IrNi, the IrSn catalyst remained low in activity.
Heating in H2/Ar: the third and last heating in forming gas (400 °C) changed back the surface constitution from a high degree of oxidation to a less oxygen terminated surface. Moreover, the most pronounced changes are associated with an increase in crystallinity and particle growth. Nevertheless, this step was found to be beneficial for the IrNi case, but not for the IrSn case.
For IrNi the highest activity of ca. 75 A gIr−1 (0.5 VRHE) was found after the final step in forming gas, whereas IrSn was less active in all thermal cleaning steps, being most active with ca. 35 A gIr−1 (0.5 VRHE) after EC cleaning in NaOH.
To conclude while the N2/O2 and H2 cleaning steps are both of crucial importance to maximise the EOR activity of IrNi catalysts, the electrochemical cleaning in NaOH is obviously the better strategy for the IrSn system. The heating step in N2 can or should be omitted within the cleaning protocol in terms of time saving and with respect to the EOR activity.
While the impact of the cleaning procedure on the EOR activity is already well addressed in future work, the impact of the cleaning strategy on the selectivity might also be considered.
Conflicts of interest
There are no conflicts to declare.Acknowledgements
This work was funded by the Graduate School of Excellence Energy Science and Engineering (GSC1070). We thank Wolfram Jaegermann for making it possible to measure our samples in the DAISY-FUN system (XPS).Notes and references
- E. Antolini, ChemElectroChem, 2014, 1, 318–328 CrossRef.
- J. M. Léger, S. Rousseau, C. Coutanceau, F. Hahn and C. Lamy, Electrochim. Acta, 2005, 50, 5118–5125 CrossRef.
- F. Vigier, C. Coutanceau, F. Hahn, E. M. Belgsir and C. Lamy, J. Electroanal. Chem., 2004, 563, 81–89 CrossRef CAS.
- J. Tayal, B. Rawat and S. Basu, Int. J. Hydrogen Energy, 2011, 36, 14884–14897 CrossRef CAS.
- F. C. Simões, D. M. dos Anjos, F. Vigier, J.-M. Léger, F. Hahn, C. Coutanceau, E. R. Gonzalez, G. Tremiliosi-Filho, A. R. d. Andrade, P. Olivi and K. B. Kokoh, J. Power Sources, 2007, 167, 1–10 CrossRef.
- Q. Jiang, L. Jiang, H. Hou, J. Qi, S. Wang and G. Sun, J. Phys. Chem. C, 2010, 114, 19714–19722 CrossRef CAS.
- K.-W. Park, J.-H. Choi, B.-K. Kwon, S.-A. Lee, Y.-E. Sung, H.-Y. Ha, S.-A. Hong, H. Kim and A. Wieckowski, J. Phys. Chem. B, 2002, 106, 1869–1877 CrossRef CAS.
- D. Soundararajan, J. H. Park, K. H. Kim and J. M. Ko, Curr. Appl. Phys., 2012, 12, 854–859 CrossRef.
- E. V. Spinacé, M. Linardi and A. O. Neto, Electrochem. Commun., 2005, 7, 365–369 CrossRef.
- R. M. Arán-Ais, F. J. Vidal-Iglesias, J. Solla-Gullón, E. Herrero and J. M. Feliu, Electroanalysis, 2015, 27, 945–956 CrossRef.
- S. Mourdikoudis and L. M. Liz-Marzán, Chem. Mater., 2013, 25, 1465–1476 CrossRef CAS.
- Y. Yan, K.-b. Chen, H.-r. Li, W. Hong, X.-b. Hu and Z. Xu, Trans. Nonferrous Met. Soc. China, 2014, 24, 3732–3738 CrossRef CAS.
- P. Strasser, M. Gliech, S. Kuehl and T. Moeller, Chem. Soc. Rev., 2018, 47, 715–735 RSC.
- D. Li, C. Wang, D. Tripkovic, S. Sun, N. M. Markovic and V. R. Stamenkovic, ACS Catal., 2012, 2, 1358–1362 CrossRef CAS.
- I. A. Safo and M. Oezaslan, Electrochim. Acta, 2017, 241, 544–552 CrossRef CAS.
- F. J. Vidal-Iglesias, J. Solla-Gullón, E. Herrero, V. Montiel, A. Aldaz and J. M. Feliu, Electrochem. Commun., 2011, 13, 502–505 CrossRef CAS.
- I. A. Safo, C. Dosche and M. Oezaslan, Z. Phys. Chem., 2018, 232, 1319–1333 CrossRef CAS.
- H. Yang, Y. Tang and S. Zou, Electrochem. Commun., 2014, 38, 134–137 CrossRef CAS.
- H.-X. Zhang, H. Wang, Y.-S. Re and W.-B. Cai, Chem. Commun., 2012, 48, 8362–8364 RSC.
- Z. Liu, M. Shamsuzzoha, E. T. Ada, W. M. Reichert and D. E. Nikles, J. Power Sources, 2007, 164, 472–480 CrossRef CAS.
- L. Jiang, Z. Zhou, W. Li, W. Zhou, S. Song, H. Li, G. Sun and Q. Xin, Energy Fuels, 2004, 18, 866–871 CrossRef CAS.
- N. Erini, R. Loukrakpam, V. Petkov, E. A. Baranova, R. Yang, D. Teschner, Y. Huang, S. R. Brankovic and P. Strasser, ACS Catal., 2014, 4, 1859–1867 CrossRef CAS.
- N. Erini, P. Krause, M. Gliech, R. Yang, Y. Huang and P. Strasser, J. Power Sources, 2015, 294, 299–304 CrossRef CAS.
- R. Loukrakpam, B. N. Wanjala, J. Yin, B. Fang, J. Luo, M. Shao, L. Protsailo, T. Kawamura, Y. Chen, V. Petkov and C.-J. Zhong, ACS Catal., 2012, 2, 1461 CrossRef CAS.
- R. H. Schroeder, N. Schmitz-Pranghe and R. Kohlhaas, Z. Metallkd., 1972, 63, 12–16 CAS.
- E. Raub and E. Roeschel, Z. Metallkd., 1970, 61, 113–115 CAS.
- H. N. Nowotny, K. Schubert and U. Dettinger, Metallforschung, 1946, 1, 137–145 CAS.
- H. W. Mayer, M. Ellner and K. Schubert, J. Less-Common Met., 1978, 61, P1–P7 CrossRef CAS.
- R. W. G. Wyckoff, Cryst. Struct., 1963, 7–83 Search PubMed.
- L. Gan and P. Strasser, in Electrocatalysis in Fuel Cells: A Non- and Low-Platinum Approach, ed. M. Shao, Springer, London, 2013, pp. 533–560 DOI:10.1007/978-1-4471-4911-8_18.
- N. Shukla, C. Liu, P. M. Jones and D. Weller, J. Magn. Magn. Mater., 2003, 266, 178–184 CrossRef CAS.
- Y. Lu and J. D. Miller, J. Colloid Interface Sci., 2002, 256, 41–52 CrossRef CAS.
- A. Hoffmann, Dr. rer. nat., Freie Universität, Berlin, 2010 Search PubMed.
- H. G. Bagaria, E. T. Ada, M. Shamsuzzoha, D. E. Nikles and D. T. Johnson, Langmuir, 2006, 22, 7732–7737 CrossRef CAS PubMed.
- L. Zhang, R. He and H.-C. Gu, Appl. Surf. Sci., 2006, 253, 2611–2617 CrossRef CAS.
- I. O. Perez De Berti, M. V. Cagnoli, G. Pecchi, J. L. Alessandrini, S. J. Stewart, J. F. Bengoa and S. G. Marchetti, Nanotechnology, 2013, 24, 175601 CrossRef CAS PubMed.
- C. W. Kim, H. G. Cha, Y. H. Kim, A. P. Jadhav, E. S. Ji, D. I. Kang and Y. S. Kang, J. Phys. Chem. C, 2009, 113, 5081–5086 CrossRef CAS.
- X. Wang, K. Han, F. Wan, Y. Gao and K. Jiang, Mater. Lett., 2008, 62, 3509–3511 CrossRef CAS.
- Z. Xu, C. Shen, Y. Hou, H. Gao and S. Sun, Chem. Mater., 2009, 21, 1778–1780 CrossRef CAS.
- J. Luo, L. Han, N. N. Kariuki, L. Wang, D. Mott, C.-J. Zhong and T. He, Chem. Mater., 2005, 17, 5282–5290 CrossRef CAS.
- B. Predel, Ir-Ni (Iridium-Nickel), in Hg-Ho – La-Zr, ed. O. Madelung, Landolt-Börnstein – Group IV Physical Chemistry, Springer-Verlag Berlin Heidelberg, 1997, vol. 5G, DOI:10.1007/10506626_1791.
- K. Sridharan, E. H. Wilson, D. F. Lawrence and J. R. Jacobs, Appl. Surf. Sci., 2004, 222, 208–214 CrossRef CAS.
- K. Kinoshita, Carbon: Electrochemical and Physicochemical Properties, Wiley, New York, 1988 Search PubMed.
- W. Du, Q. Wang, D. Saxner, N. A. Deskins, D. Su, J. E. Krzanowski, A. I. Frenkel and X. Teng, J. Am. Chem. Soc., 2011, 133, 15172–15183 CrossRef CAS PubMed.
- S. Trasatti and O. A. Petrii, J. Electroanal. Chem., 1992, 327, 353–376 CrossRef CAS.
- R. Woods, J. Electroanal. Chem. Interfacial Electrochem., 1974, 49, 217–226 CrossRef CAS.
- M. A. Montiel, F. J. Vidal-Iglesias, V. Montiel and J. Solla-Gullón, Curr. Opin. Electrochem., 2017, 1, 34–39 CrossRef CAS.
- M. A. Montero, M. R. G. d. Chialvo and A. C. Chialvo, J. Electroanal. Chem., 2016, 767, 153–159 CrossRef CAS.
- J. Mozota and B. E. Conway, Electrochim. Acta, 1983, 28, 1–8 CrossRef CAS.
- J. Zheng, Z. Zhuang, B. Xu and Y. Yan, ACS Catal., 2015, 5, 4449–4455 CrossRef CAS.
- J. Durst, A. Siebel, C. Simon, F. Hasché, J. Herranz and H. A. Gasteiger, Energy Environ. Sci., 2014, 7, 2255–2260 RSC.
- P. P. Lopes, D. Strmcnik, J. S. Jirkovsky, J. G. Connell, V. Stamenkovic and N. Markovic, Catal. Today, 2016, 262, 41–47 CrossRef CAS.
- K. Artyushkova, B. Halevi, M. Padilla, P. Atanassov and E. A. Baranova, J. Electrochem. Soc., 2015, 162, H345–H351 CrossRef CAS.
- R. Mancharan and J. B. Goodenough, J. Mater. Chem., 1992, 2, 875–887 RSC.
- D. Y. Chung, K.-J. Lee and Y.-E. Sung, J. Phys. Chem. C, 2016, 120, 9028–9035 CrossRef CAS.
- M. M. Jaksic, B. Johansen and R. Tunold, Int. J. Hydrogen Energy, 1994, 19, 321–335 CrossRef CAS.
- L. Cao, G. Sun, H. Li and Q. Xin, Electrochem. Commun., 2007, 9, 2541–2546 CrossRef CAS.
Footnote |
| † Electronic supplementary information (ESI) available. See DOI: 10.1039/d0cp04900j |
| This journal is © the Owner Societies 2021 |