
A ‘mixed’ dielectric response in langasite Ba3NbFe3Si2O14
Satyapal S.
Rathore
 *ab,
Rashi
Nathawat
a and
Satish
Vitta
b
*ab,
Rashi
Nathawat
a and
Satish
Vitta
b
aFunctional Ceramics and Smart Materials Lab, Department of Physics, Manipal University Jaipur, Jaipur 303007, India. E-mail: satyapal03@gmail.com; satyapalsingh.rathore@jaipur.manipal.edu
bDepartment of Metallurgical Engineering and Materials Science, Indian Institute of Technology Bombay, Mumbai 400076, India
First published on 17th November 2020
Abstract
The temperature dependence of the structural and dielectric properties of polycrystalline Ba3NbFe3Si2O14 has been studied using high temperature X-ray diffraction and impedance spectroscopy. In situ X-ray diffraction with temperature (330–873 K) and subsequent Rietveld refinement shows that Fe-langasite crystallizes in a single phase P321 structure, in the measured temperature range. The dielectric constant ε′ exhibits low frequency dispersion and large variation (25–104), with temperature and frequency. The real part of the ac conductivity (σ′) also shows a change of seven orders of magnitude (10−6 to 10−13). The conductivity was observed to diverge from the ‘universal dielectric response’ (UDR), σ(ω,T) = σdc + A1ωn. Three frequency (10 Hz–10 MHz) and temperature (123–573 K) dependent regions were observed: (a) a low frequency, frequency independent region, (b) a mid frequency, dispersive region, and (c) a high frequency, dispersive region. This behaviour can be understood by a double power law: σ(ω,T) = σdc + A1ωn2 + A2ωn1, which is similar to the modified Jonscher's law and holds good for other complex dielectric materials as well. The ‘sub-linear’ variation with frequency for n2 at all temperatures and for n1 above 323 K is attributed to hopping polarization. Remarkably, a ‘super-linear’ ac conductivity was observed with n1 ≥ 1 below 323 K. This anomalous behaviour is attributed to hopping between non-uniform potential wells. The dielectric relaxation studies in combination with Seebeck measurements (300–573 K) reveal that the colossal dielectric permittivity and deviation from the UDR are predominantly due to the hopping polarization of positively charged species in a distributed potential. It is suggested that this model may be applicable to understand the conductivity mechanism in a broad range of complex materials.
1. Introduction
The langasite, La3Ga5SiO14 (LGS), family of compounds has attracted significant attention because of their functional properties, such as high piezoelectric coupling, temperature compensation, low acoustic loss, and nonlinear optical and electro-optical properties.1–4 Notably, LGS compounds retain their ferroelectric and crystalline state up to the melting point, ∼1470 °C, making them an ideal material for high temperature piezoelectric applications.5,6 However, at high temperatures their electrical conductivity increases, which results in increased dielectric losses. Thus, the conductivity plays an important role in determining the functional temperature window for a device, and materials with low conductivity (i.e. low dielectric loss) are desired. The electrical conductivity of the langasite family was reported to be highly sensitive to microstructural parameters such as oxygen pressure during processing, defects, and substitution and to the temperature and frequency of use.7,8 The conductivity mechanism of langasites is not well understood, and more detailed theoretical and experimental investigations are required. The complex structure of langasites with many ions makes them potential candidates to display deviation from the famous ‘universal dielectric response’ (UDR) proposed by Joncher.9,10 The universality of Joncher's law is overwhelming as it is applicable to a wide range of materials irrespective of their chemical composition, synthesis process and crystalline structure. Divergence from the UDR was initially reported in ionically conducting glasses, polymers, and amorphous systems.11–16 This universality was later challenged in highly ordered crystalline systems as well, and many theories were proposed to explain this ‘new universality’,17 which will be discussed in Section 3.3.In the present work, an attempt is made for the first time to investigate the ac conductivity of Ba3NbFe3Si2O14, belonging to the langasite family of compounds. The compound Ba3NbFe3Si2O14 is a more recent addition to the functional langasite family and is reported to exhibit magneto-electric coupling at low temperatures. It is the first reported compound in the langasite family to exhibit multiferroic behaviour, in which switchable electric polarization was observed to appear below the magnetic ordering temperature TN ∼ 26 K, depicting a magnetic origin of ferroelectricity. Naturally coupled electric and magnetic orders are of great technological relevance as they provide flexibility to generate electric dipoles (magnetic moments) by means other than external electric (magnetic) fields. The magnetic properties of Fe-substituted langasite were studied by various groups both experimentally and theoretically.18–21 However, there is only one report on the investigation of the dielectric properties as a function of temperature (5–300 K) and frequency (10 Hz–500 KHz).22,23
The dielectric response of this compound was reported to show a relaxor-like ferroelectric transition near the antiferromagnetic transition temperature TN. This transition to the ferroelectric state near TN indicates that it is of magnetic origin and hence the electric and magnetic orders are strongly coupled. In addition, a highly dispersive ‘glassy’ behaviour was also reported in the temperature range 40–125 K. The high and low temperature dielectric response were attributed respectively to the initiation and completion of the magnetic ordering process.22,23 The ferroelectricity in Ba3NbFe3Si2O14 is plausibly driven by antisymmetric DM interactions which induce polarization by displacing the oxygen ions orthogonal to the magnetic spin axis near the Néel temperature, TN. The frequency and temperature dependence of the dielectric relaxations clearly show that the dielectric behaviour of the compound requires a more detailed investigation. In addition, the dielectric properties of Fe-langasite are not studied in the technologically important temperature range i.e. near (above and below) room temperature. Dielectric studies of Ba3NbFe3Si2O14 will be extremely useful in determining the dielectric response of the isostructural langasite family of compounds.
Therefore, in the present work the dielectric response of Ba3NbFe3Si2O14 has been investigated in the temperature range 123–573 K as a function of frequency, 10 Hz–10 MHz. The dielectric properties were observed to exhibit a high correlation with its aliovalent nature, magnetic interactions, polycrystallinity and underlying crystal structure. The langasite compound Ba3NbFe3Si2O14 herein reported follows the ‘universal dielectric response’ in the high temperature/low frequency region and deviates from it on cooling below a relatively low temperature. A double power law and Seebeck studies were utilized to explain the conductivity mechanism and the ‘mixed’ dielectric response.
2. Experimental methods
For the synthesis of polycrystalline Ba3NbFe3Si2O14, a solid state reaction technique was employed. Stoichiometric amounts of high purity BaCO3, Nb2O5, Fe2O3, and SiO2 powders were taken as starting materials. The powders were well mixed and calcined several times to ensure the formation of single phase Ba3NbFe3Si2O14. The powder was then mixed with polyvinyl alcohol binder and cold pressed into a compact pellet of 12 mm diameter. The green compact powder was then sintered at 1150 °C in air to get a dense pellet and these pellets were used for structural and dielectric characterizations. Temperature dependent (303–873 K) structural characterization was carried out using Cu-Kα radiation (1.5406 Å) using a PANalytical powder X-ray diffractometer for angular range (2θ) 10° to 100°. High temperature X-ray diffraction (HTXRD) experiments were performed in an ambient atmosphere at a heating rate of 10 K min−1. The microstructure was studied using a Hitachi A-3400N scanning electron microscope (SEM). The dielectric properties were studied over a wide range of frequency (0.1 Hz–10 MHz) and temperature (123–573 K) using a Novacontrol GmbH, Concept 80, broadband dielectric spectrometer. The sample pellet was well polished, and the two wide surfaces were coated with gold as electrode by thermal evaporation. The dielectric properties were studied for the pellet with silver electrodes as well for determining the electrode contribution. A rms voltage of 0.5 V was used to study dielectric response. The Seebeck coefficient measurements were carried out in the temperature range 300–1073 K.3. Results and discussion
3.1 Structural studies
The in situ powder X-ray diffraction patterns of polycrystalline Ba3NbFe3Si2O14 measured in the temperature range 303–873 K are shown in Fig. 1(a–d). The Rietveld method was employed24 to refine the crystal structure and to determine the change in the lattice parameters and atomic positions with temperature. The refinement was performed using the FullProf Suite and the results of the refinement along with the agreement factors are summarized in Table 1. Ba3NbFe3Si2O14 having one formula unit per unit cell crystallizes into a single phase with hexagonal P321 structure, at all measured temperatures. The evolution of the lattice parameters (a, c) with temperature obtained from Rietveld analysis is shown in Fig. 1(e). The in-plane lattice parameter (a) remains almost constant with an increase in temperature up to 423 K and increases continuously on further increasing the temperature. The out of plane lattice parameter, c, on the other hand, was observed to increase monotonically with temperature.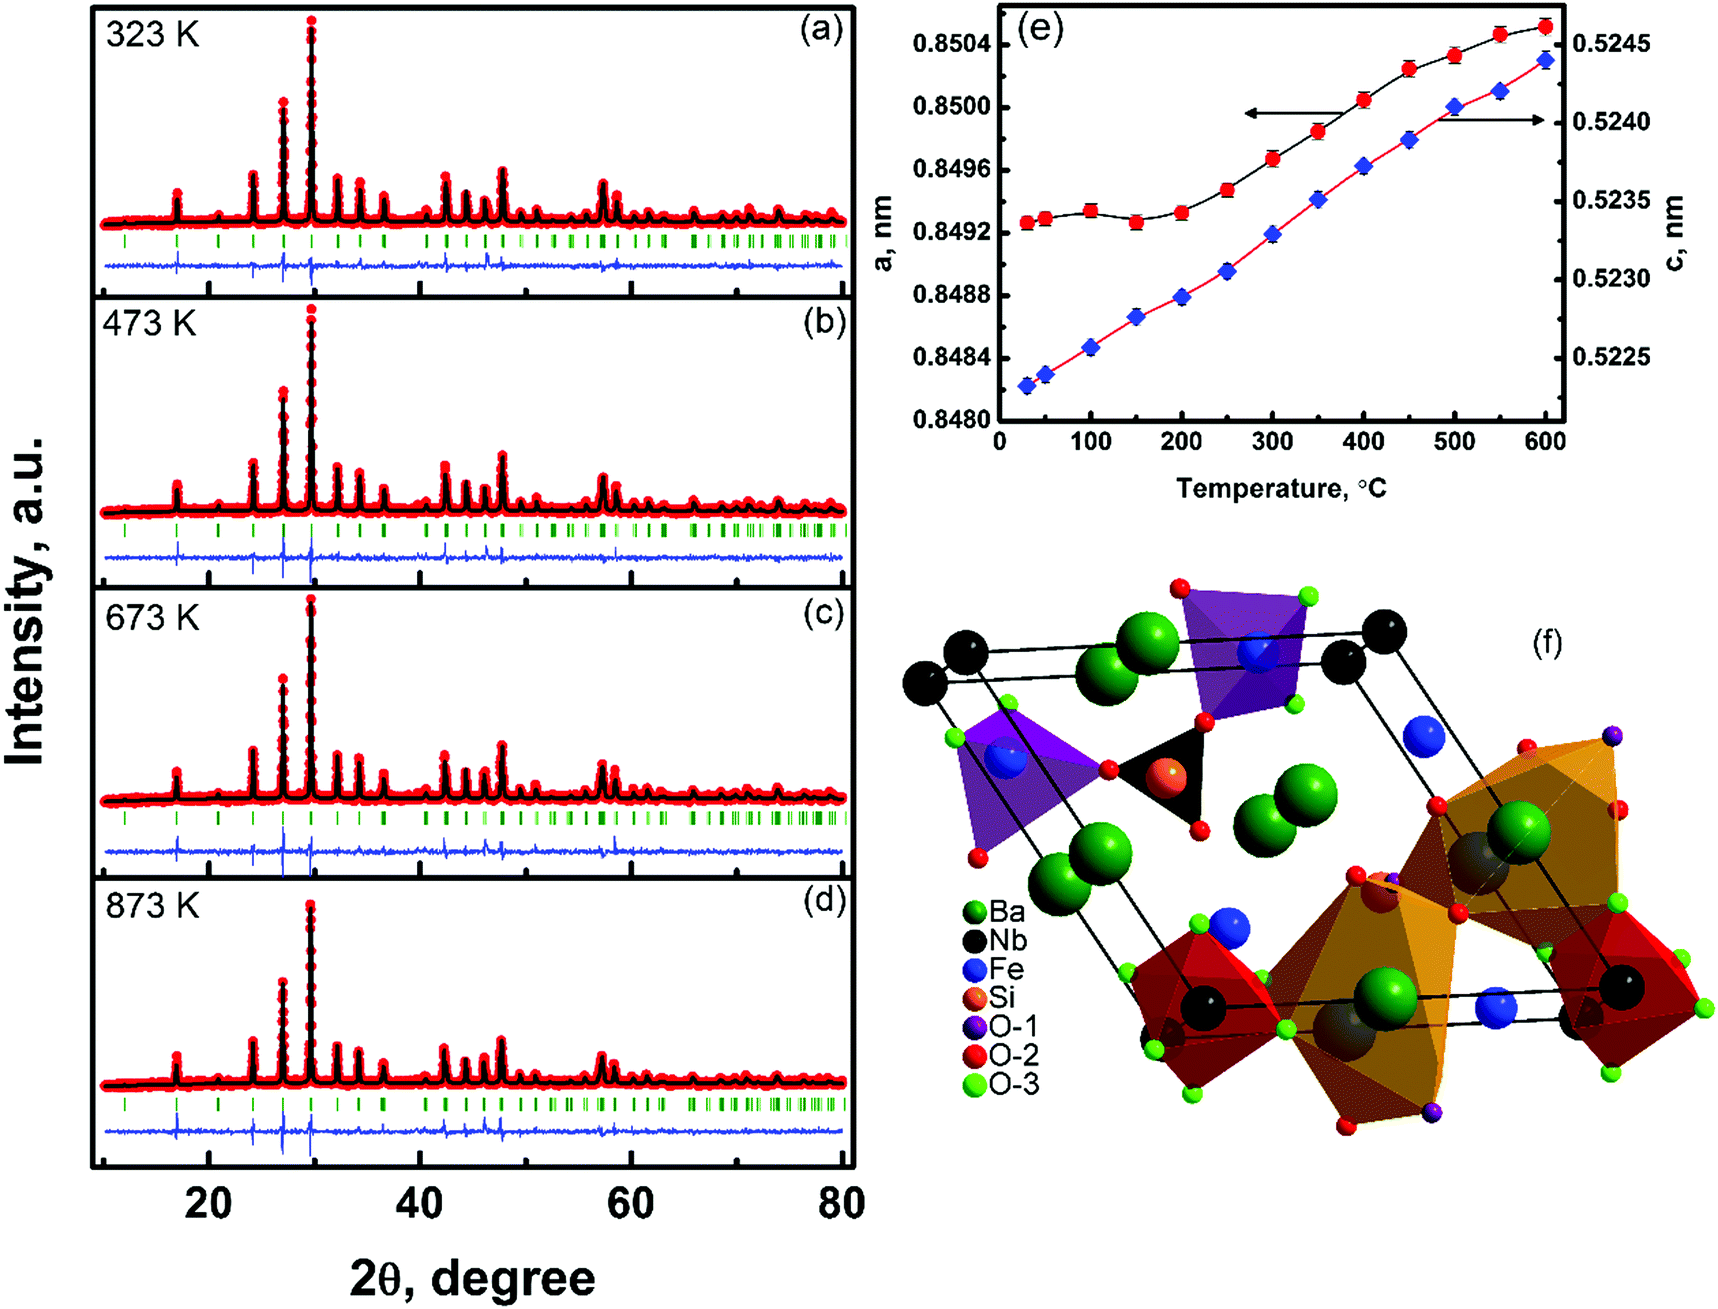 | ||
| Fig. 1 The Rietveld plot of the X-ray diffraction pattern for Ba3NbFe3Si2O14 at different temperatures: (a) 323 K, (b) 473 K, (c) 673 K, and (d) 873 K. The red symbols (black line) represent the observed (calculated) XRD patterns and the discrepancy between the two (Iobs − Ical) is shown as a blue line. The Bragg reflections are shown by short vertical lines. The temperature variation of the refined lattice parameters is shown in (e). A polyhedral representation of Ba3NbFe3Si2O14 is shown in (f). O1, O2 and O3 represent oxygen ions having different atomic position (Table 1). | ||
| Atom | Wyckoff | X | Y | Z | Occu. |
|---|---|---|---|---|---|
| Ba | 3e | 0.4365(4) | 0 | 0 | 0.5 |
| 0.4384(4) | |||||
| Nb | 1a | 0 | 0 | 0 | 0.166 |
| Fe | 3f | 0.751(1) | 0 | 0.5 | 0.5 |
| 0.755(1) | |||||
| Si | 2d | 0.333 | 0.666 | 0.4993(4) | 0.333 |
| 0.498(5) | |||||
| O1 | 2d | 0.333 | 0.666 | 0.840(1) | 0.333 |
| 0.850(6) | |||||
| O2 | 6g | 0.489(1) | 0.306(3) | 0.620(9) | 1.00 |
| 0.487(7) | 0.308(4) | 0.615(5) | |||
| O3 | 6g | 0.233(3) | 0.103(2) | 0.218(5) | 1.00 |
| 0.253(4) | 0.111(2) | 0.233(6) |
Thus, similar to LGS compounds, Ba3NbFe3Si2O14 also remains in a non-centrosymmetric hexagonal state and does not undergo any structural phase transition in the measured temperature range. The crystal structure determined from refinement was also found to be identical to the prototypical langasite family compound La3Ga5SiO14 with general formula A3BC3D2O14.25 The Ba2+ and Nb5+ cations occupy decahedral A sites and octahedral B sites, respectively. The Fe3+ and Si4+ ions occupy large and small tetrahedron sites C and D, respectively (Fig. 1(f)). The four cation sites in the structure allow a large possibility of material design through cation substitution, and many combinations of compositions have been reported.26 The SEM micrograph shows that the microstructure has average grains of size ∼5 μm, Fig. 2(a). This type of microstructure with large grains is typical of sintered oxide materials in general and shows the formation of a microstructure with a small amount of porosity. The density of the sintered pellets was found to be ∼96% of the theoretical density (4.85 g cm−3), calculated using the refined lattice parameters. Compositional analysis was performed using energy dispersive spectroscopy (EDS), Fig. 2(b). The EDS spectrum shows the presence of a relatively higher amount of Nb in the compound than expected. The energy of Lα emission of Nb, 2.166 keV, is very close to the energy of the M emission line of gold, 2.120 keV. Thus, the high value of Nb is attributed to the contribution from the conducting gold coating to the spectrum, which in turn affects the accuracy of the EDS measurement. EDS also shows a smaller amount of oxygen than calculated because the EDS detector is less sensitive to lighter elements, and as a result the percentage composition of oxygen cannot be determined accurately. Thus, considering the above facts, the observed weight and atomic percentage of the elements present in the sample are found to be in good agreement with the calculated weight and atomic percentages of the different heavy elements, Table 2.
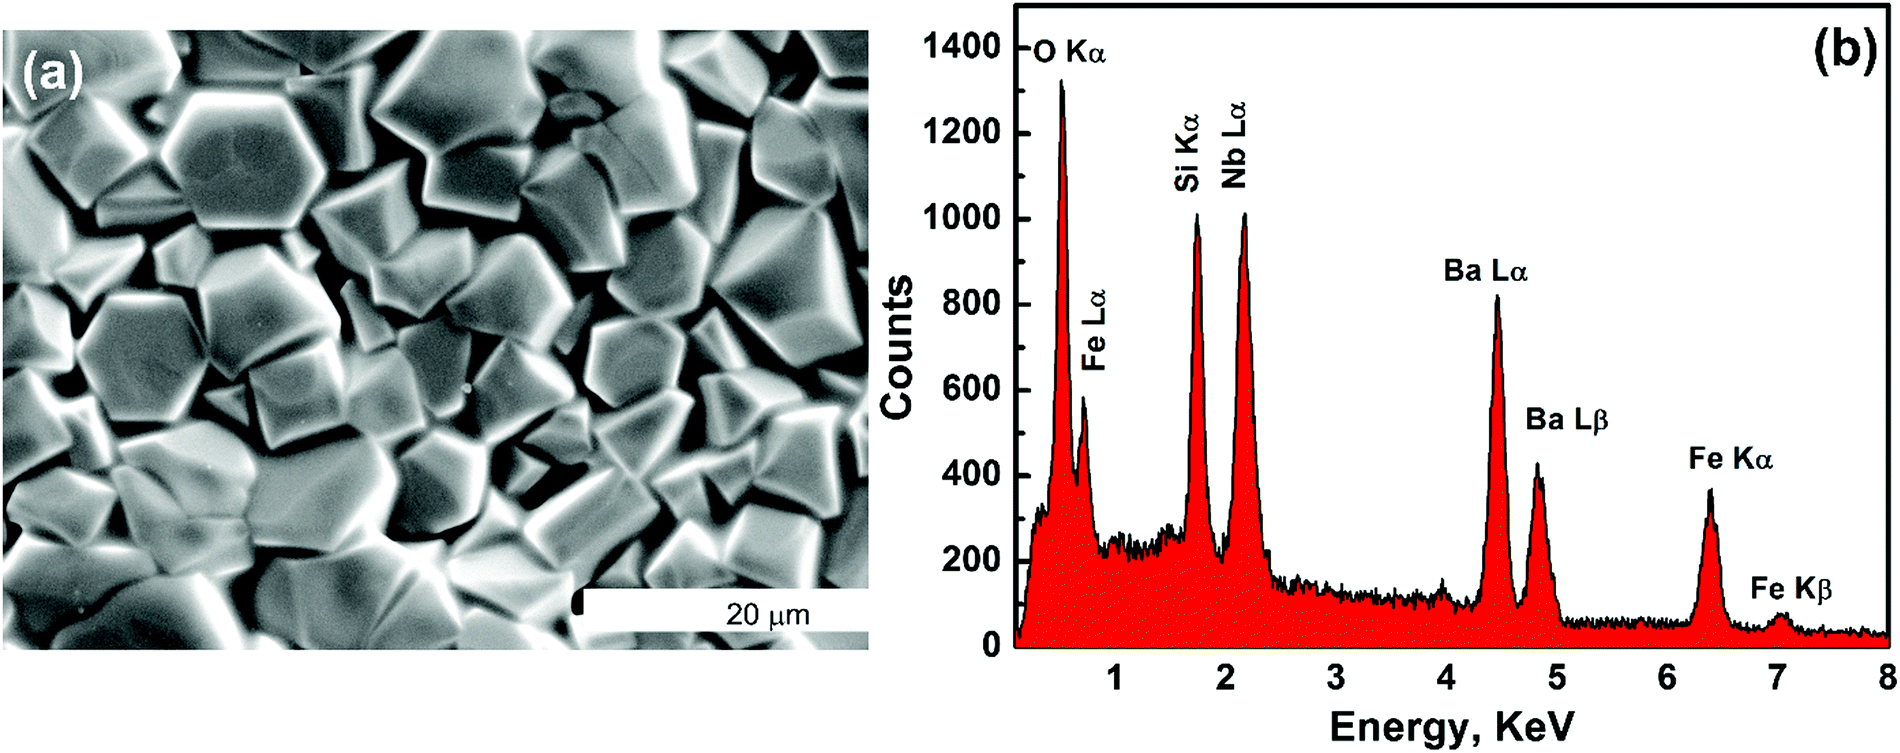 | ||
| Fig. 2 The microstructure of a Ba3NbFe3Si2O14 pellet, sintered at 1150 °C for 12 h, showing a single-phase system with uniform grain distribution. The value of the elemental composition determined from the EDS spectrum shows a nearly stoichiometric distribution of elements. | ||
| Element | Wt% observed | Wt% expected | At% observed | At% expected |
|---|---|---|---|---|
| Ba | 43.15 | 43.25 | 12.99 | 13.04 |
| Nb | 11.19 | 9.75 | 5.19 | 4.35 |
| Fe | 17.31 | 17.59 | 12.83 | 13.04 |
| Si | 6.17 | 5.90 | 9.09 | 8.70 |
| O | 22.18 | 23.15 | 59.9 | 60.87 |
3.2 Dielectric studies
The variation of the dielectric constant, ε′, with frequency is shown in Fig. 3, Y–Z plane, and with temperature in the Z–X plane. ε′ was observed to show both temperature and frequency dependence. At a given temperature, as the frequency of the applied field increases the dielectric constant was observed to decrease monotonically and achieve a nearly constant value at high frequencies. ε′ shows large variation with frequency: at 573 K it achieves a very large value ∼104 at low frequency (10 Hz), which decreases by four orders of magnitude to ∼37 on increasing the frequency to 1 MHz. The room temperature value of ε′ ∼ 25 was found to be in good agreement with literature values. On the contrary, for a given frequency ε′ increases continuously with an increase in temperature. Therefore, the observed dielectric response of Ba3NbFe3Si2O14 is divided into two parts: (a) a highly dispersive low frequency part in which the dielectric constant changes from ∼25 to 104 and (b) a nearly frequency independent high frequency part in which a relatively small variation from 37 to 25 was observed. The large variation of the dielectric constant in a low frequency-high temperature region is termed as low frequency dispersion (LFD).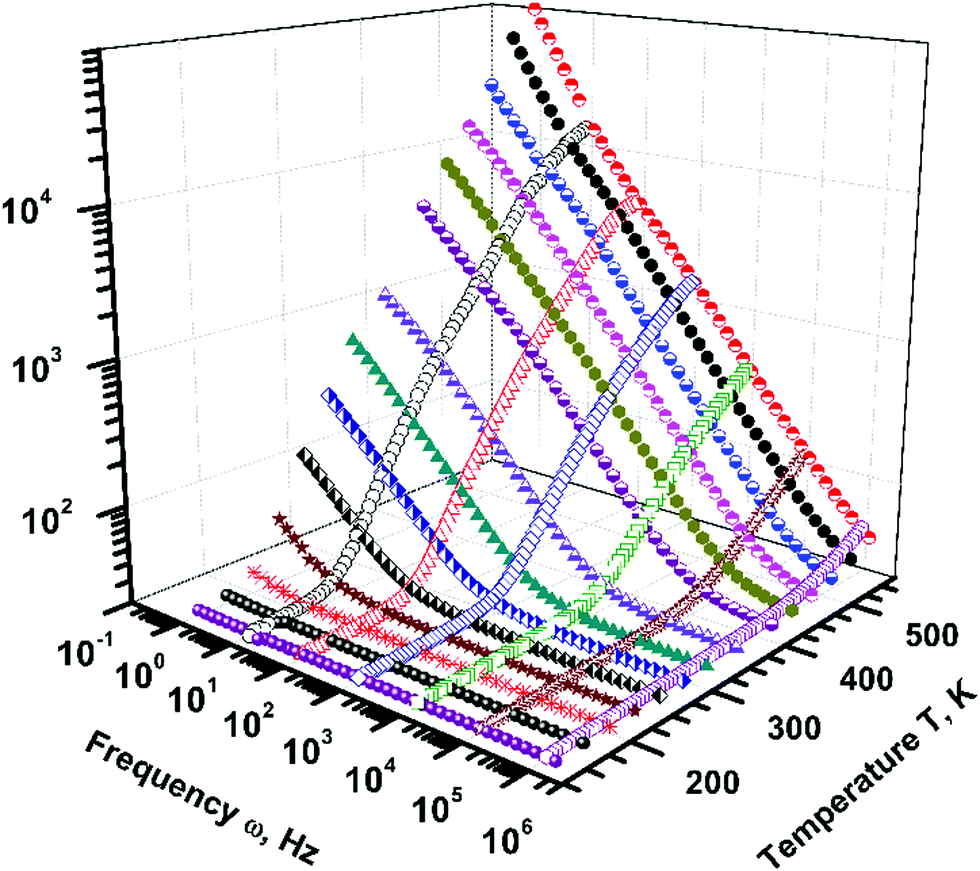 | ||
| Fig. 3 A 3D plot of dielectric constant ε′ (Z-axis) showing its dependence on frequency ω (Y-axis) and temperature T (X-axis). The variation of the dielectric constant with frequency (Y–Z plane) and temperature (Z–X plane) shows low frequency dispersion and it attains a constant value at low temperature and high frequency. | ||
The dielectric constant of a material in general is due to polarization species such as electrons/holes, ions, pre-existing dipoles, and space charge polarization. These four polarization mechanisms govern the dielectric properties in different frequency ranges. The polarization switching of electrons and ions is extremely fast and hence they are dominant only at high frequencies, typically 1010 to 1016. Relatively slow processes such as realignment of pre-existing dipoles and space-charge will be dominant in the measured frequency range.27 The observed LFD could be a bulk property or originate from the electrode–sample interface, also known as Maxwell–Wagner polarization.28 Thus, to determine the contribution from the electrode to LFD, measurements were carried out using both silver and gold electrodes. A very small change in the value of the dielectric constant was detected and the overall dielectric behaviour was observed to be similar in both cases. Thus, the LFD is shown to be an intrinsic bulk property of Fe-langasite with negligible contribution from the sample–electrode interface or Maxwell–Wagner polarization.
Another polarization mechanism which manifests in the form of LFD is hopping polarization. Hopping polarization occurs because of localized charges (ions, vacancies, electrons etc.). These localized charges (for example a positively charged particle) can hop from one site, leaving a negative charge on the former site and creating a positive charge on the new site, thus creating a dipole due to charge separation.27 When subjected to a time varying electric field of low frequency, these dipole moments follow the change of the electric field easily, resulting in a large value of the dielectric constant at low frequencies. As the frequency of the applied field increases it is difficult for them to track the field variation, thus showing a very low value of ε′ when subjected to high frequencies. Hopping is a quantum mechanical phenomenon, whose probability depends both on the magnitude and width of the potential barrier. Usually, for a barrier width less than ∼a few Å, the contribution due to tunneling cannot be ignored.27 Otherwise, for a successful hop from one site to another, the charge carrier must overcome a potential barrier using energy provided thermally, and at high temperatures hopping polarization will be facilitated. This explains the large value of the dielectric constant at high temperature and low frequencies. Hence, LFD in Ba3NbFe3Si2O14 can be predominantly associated with hopping polarization. In thermal equilibrium, the time averaged probability for a charged particle (for example a negatively charged particle) to hop from site X to Y, leaving a positive charge on site X and thus creating a negative charge on site Y to form a dipole, is: P(X→Y) = C![[thin space (1/6-em)]](https://www.rsc.org/images/entities/char_2009.gif) exp(−U/KT), where C is a constant and U is the activation energy for the hopping transition.
exp(−U/KT), where C is a constant and U is the activation energy for the hopping transition.
3.3. AC conductivity of polycrystalline Ba3NbFe3Si2O14
The variation of the real part of the ac conductivity, σ′, with frequency at different temperatures is shown in Fig. 4. The conductivity was found to increase with temperature, indicating the presence of thermally activated charge transport. Depending on the frequency variation, the conductivity spectrum can be broadly divided into three regions viz.: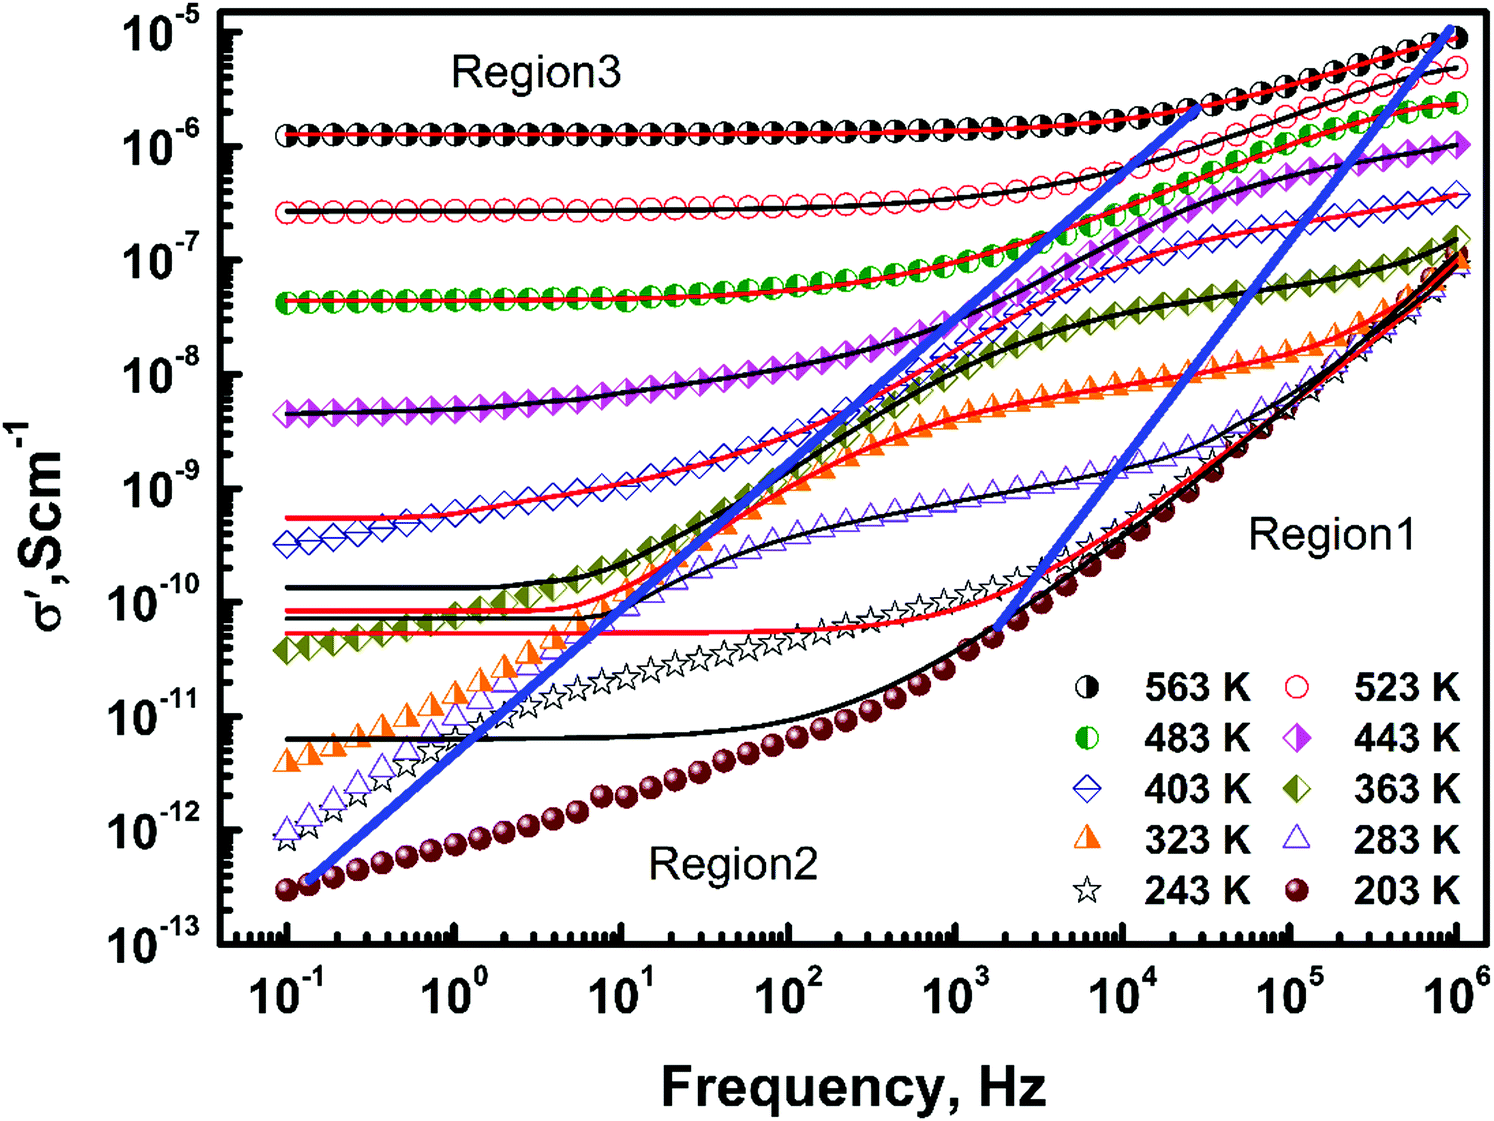 | ||
| Fig. 4 The frequency variation of conductivity at different temperatures shows three regions, namely region 1, 2 and 3, depending on their frequency dependence; see the text for details. The symbols indicate experimental data and the solid line shows fitting using a double power law. | ||
(i) the high frequency, dispersive part (region 1),
(ii) the mid frequency, dispersive part (region 2), and
(iii) the low frequency plateau or dc conductivity (region 3).
With a decrease in temperature both dispersive regions (1 and 2) were observed to grow at the expense of region 3. Below 203 K the conduction is governed by region 1 and 2 only, showing the absence of dc conductivity at low temperatures. On further decreasing the temperature region 1 grows and below 143 K (not shown in the above figure for clarity) the conduction is predominantly due to region 1 only. The frequency dependence of σ′ in region 2 and 3 for Ba3NbFe3Si2O14 shows behaviour similar to ionic glasses.11–17,29–31 The ac conductivity in mHz to MHz for ionic glasses, conducting polymers and some heavily doped crystals also shows three regions: (a) a frequency independent dc conductivity regime, (b) the high temperature/low frequency regime in which 0 < n < 1 (n is an exponent), also known as the ‘universal dielectric response’ (UDR) or Jonscher regime, and (c) the low temperature/high frequency regime n ≈ 1, known as the nearly constant loss (NCL) regime, wherein the conductivity varies linearly with frequency.
The universal response proposed by Jonscher for the real part of the ac conductivity, σ′, is given by:
| σ(ω,T) = σdc + A1ωn | (1) |
Deviation from the ‘universal’ response at relatively low temperatures/high frequencies was so far reported mainly in ionic glasses. There are very few crystalline compounds such as Gd3+ doped CeO2, Al3+ doped CaTiO3 and Sm3+ doped NaCl which exhibit an NCL response.17 Thus, for incorporating NCL behaviour, a third term is added and the UDR is modified to:
| σ(ω) = σdc + A1ωn + A2ω | (2) |
In Fe-langasite, although regions 2 and 3 are similar to ionic glasses, the high frequency part (region 1) was observed to be dispersive in nature, i.e. instead of the NCL regime (n ≈ 1), a nonlinear frequency dependence was seen. This behaviour can be explained by modifying eqn (2) to give a double power law:33
| σ′(ω,T) = σdc + A1ωn2 + A2ωn1 | (3) |
The first term in eqn (3) corresponds to the low frequency (dc conductivity) region 3, the second term (A1ωn2) accounts for the mid-frequency dispersion (region 2) and the third term (A2ωn1) corresponds to the high-frequency dispersion (region 1). The temperature dependence of exponents n1 (region 1) and n2 (region 2) determined from the above equation is plotted in the inset of Fig. 5(a). The values of the exponents and their temperature variation give valuable information about the types of conductivity mechanism present in a system.32 Initially, at high temperatures both regions (1 and 2) follow the UDR as the values of both exponents (n1 and n2) were found to be in the range of 0 to 1.10 The value of the exponents was determined to be in the range 0.58 to 0.73, which is a manifestation of the conductivity being dominated by hopping of charge carriers.34
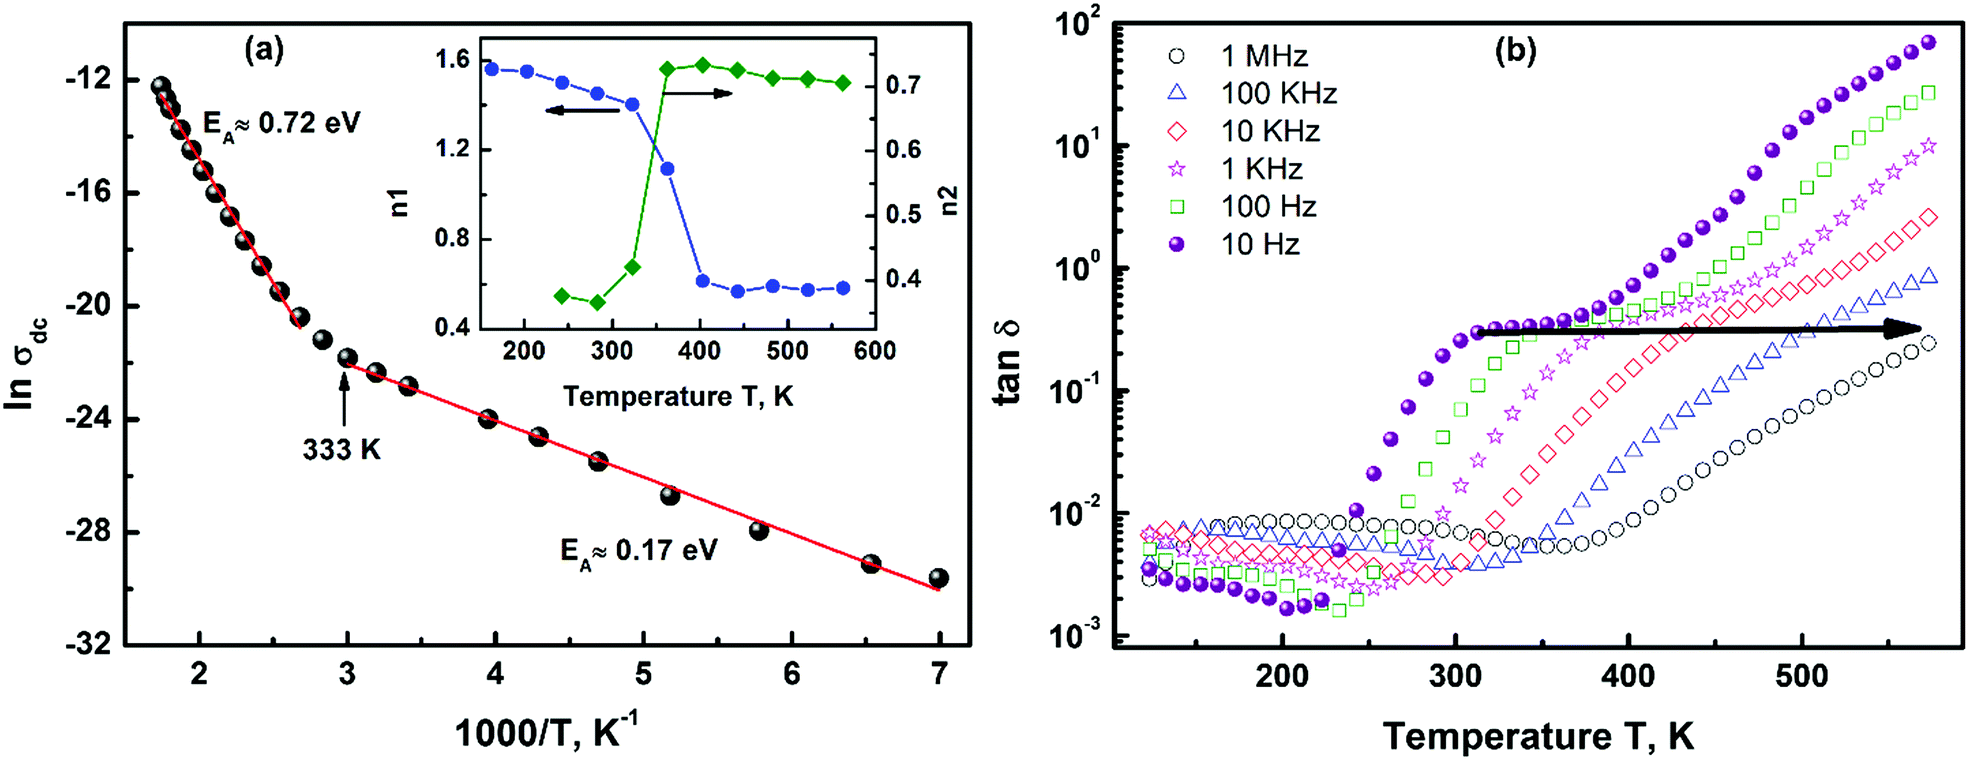 | ||
| Fig. 5 (a) The dc part of the conductivity follows Arrhenius behaviour, and the determined activation energies are: 0.72 ± 0.018 eV (above 353 K) and 0.17 ± 0.005 eV (below 333 K). The temperature variation of exponents n1 and n2 obtained from eqn (3) indicates a change in conductivity mechanisms near ∼323 K (inset (a)). (b) The variation of the loss tangent with frequency shows a low loss in the low temperature-high frequency part and a high loss in the high temperature-low frequency part of the spectrum. The frequency dispersion is shown by an arrow. | ||
A divergence from the UDR was observed on decreasing the temperature; at 323 K a sharp decrease in exponent n2 was seen. Region 2 still follows the UDR with 0 < n2 < 1. On the contrary, the value of exponent n1 was observed to increase rapidly near room temperature on cooling and was >1 below it. This crossover of n1 and n2 clearly depicts a change in the dominant conductivity mechanism near room temperature. The mid-frequency dispersion exponent, n2 (region 2), was determined to be in the range of 0 to 1 at all temperatures and is attributed to conduction due to translation hopping. Whereas, the value of high frequency exponent n1 lies between 0.58 and 0.61 at high temperatures and between 1 and 2 (1 < n2 < 1.5) at temperatures below 323 K. The simultaneous presence of sublinear (above 323 K) and non-linear (below 323 K) variation of conductivity is rare in a single-phase system.
This divergence from the UDR can be explained by various theoretical models such as the quantum tunneling mechanism proposed by Pollak and Gabelle.35 This mechanism predicts that the sublinear values of the exponents are due to phonon-assisted tunneling between localized states. The correlated barrier hopping model36,37 proposed by Pike (1972) and Elliot (1977) can be described as the classical hopping of carriers between localized sites separated by a potential barrier. In the present case both tunneling and the correlated barrier hopping model36,37 can be used to understand the ac conductivity in region 2 (above 323 K). The distribution of the magnitude of the barriers is caused by a random distribution of localized sites. The values of the exponent as predicted by the barrier hopping model decrease with an increase in temperature. Thus, the conductivity mechanism at high temperatures (above 323 K) is predominantly attributed to the classical hopping of charge carriers between localized sites with a small contribution from tunneling. As the temperature decreases the tunneling mechanism dominates over the classical hopping and at low temperatures the conductivity is attributed to the short range hopping assisted by tunneling of charge carriers. It is evident that the conductivity is independent of the contacts and non-linear dependence is indeed a bulk property of Fe-langasite.38 So called ‘super-linear’ frequency dependence with 0.7 < n1 < 1.6 was observed in amorphous Ge films by Gilbert and Adkins.39 This behaviour was attributed to variable range hopping between sites with different barrier potentials formed due to different types of defects in the system. This model can be applied to Ba3NbFe3Si2O14, which is a crystalline system, but was also reported to simultaneously possess both glassy electronic and magnetic phases.22 The langasite thus has a long-range atomic order (crystalline) and a short-range dielectric interaction, which makes it equivalent to a dielectric glass. The presence of phases which are electrically and magnetically distinct near room temperature in a structurally homogenous system may plausibly lead to variable potentials. Also, the presence of several cations with multiple valence states can lead to a large distribution of hopping potentials. The hopping polarization caused by transitions among these sites (∼a few Å) will result in the anomalous super-linear frequency dependence of conductivity.
The activation energies for these two conductivity mechanisms were obtained by fitting the frequency independent part (σdc) with the Arrhenius relation:
| σdc = σ0exp(−EA/kBT) | (4) |
3.4 Seebeck coefficient studies
To determine the type of electronic species responsible for conduction, Seebeck coefficient measurements were carried out in the temperature range 300–573 K. The positive value of the Seebeck coefficient in temperature range 300–573 K, Fig. 6, indicates that a positive charge carrier is responsible for conduction below 573 K. Thus, in Ba3NbFe3Si2O14 the conduction could be due to any four cations and/or oxygen vacancies. The conduction in Ba3NbFe3Si2O14 could be a result of a combination of both hopping of different species and defects. A signature of conductivity through oxygen vacancies was also evident in high temperature XRD. As shown in Table 1, a significant variation in the atomic position of oxygen ions is observed.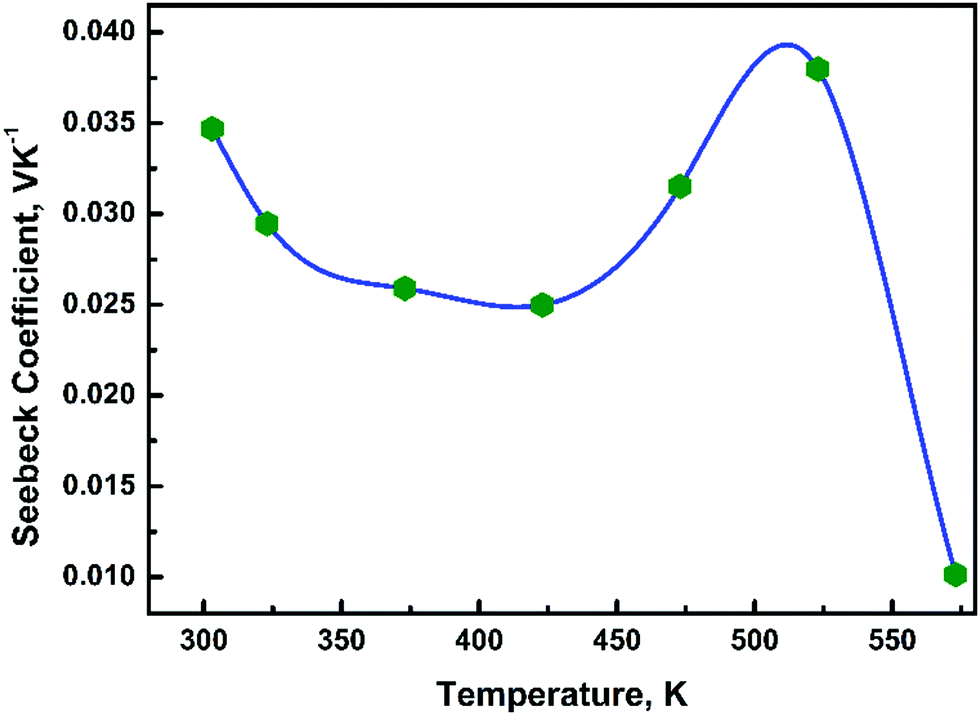 | ||
| Fig. 6 The temperature variation of the Seebeck coefficient shows a positive value in the temperature range 300–573 K. The Seebeck coefficient shows a change in polarity of charge carriers above 573 K. | ||
3.5 Dielectric loss
The variation of the loss tangent (tanδ) with temperature shows a dispersive behaviour and a broad peak in tanδ appears near ∼323 K which shift towards higher temperature with an increase in frequency, Fig. 5(b). Since the dielectric loss is directly proportional to the electric conduction, we observe a similar trend in tanδ as well. Dielectric loss can also be divided into two parts: a lossy high temperature part above 323 K and a relatively low loss low temperature part below it. Thus, two processes coexist in Ba3NbFe3Si2O14: one is dominant at higher temperature and the other at low temperatures with high and low losses, respectively.
The dielectric loss in Ba3NbFe3Si2O14 is preponderantly due to migration of ions/vacancies in the crystal giving rise to hopping conduction. The simplest hopping mechanism can be understood as hopping within an infinite crystal lattice with identical potentials, Fig. 7(a). This conduction in the absence of any other processes results in frequency independent conductivity. This back and forth hopping in a double well model gives a Debye-like constant conductivity at high temperature 41. In the present case, the dispersive high and mid-range frequency conductivity can be best understood by considering a potential profile with multiple activation energies, Fig. 7(b).41,42 Different hopping mechanisms will dominate the conduction depending on the signal frequency of the applied field and available activation energy. Inter-well hopping, which requires a large activation energy (0.72 eV), is dominant at high temperature, whereas on decreasing the temperature hopping with a lower activation energy (0.17 eV) dominates the dielectric relaxation. At low frequencies and high temperatures, the hopping between wells with a higher potential barrier can easily follow the reversal in the field, giving rise to high dielectric losses. However, at high frequency and low temperature, the charge carriers do not have enough energy and time for high barrier hopping before field reversal and low barrier hopping is preferred. As a result, with an increase in frequency and a decrease in temperature, tanδ and the dielectric constant decrease due to freezing of high barrier hopping.
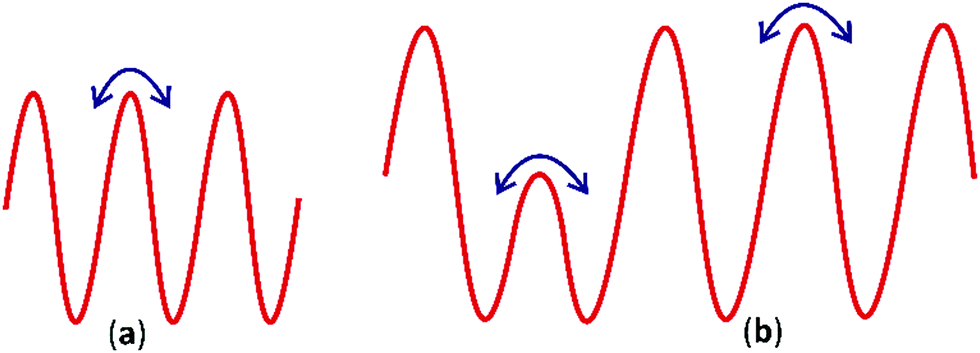 | ||
| Fig. 7 (a) The potential profile for a periodic potential well with constant height (i.e. unique activation energy for hopping) and (b) the potential profile for a distributed potential well, having a distributed well height and hence multiple activation energies. | ||
4. Conclusions
The correlation between the structural and dielectric properties of Ba3NbFe3Si2O14 has been studied as a function of temperature. The high temperature XRD shows that Fe-langasite is in a single hexagonal state with the absence of any structural phase transition up to 873 K. The dielectric relaxation is dominated by hopping polarization, which manifests itself by lossy LFD of the dielectric constant (ε′). The real part of the ac conductivity follows the UDR down to 323 K and below it the conductivity can be explained by a double power law. The ‘super-linear’ frequency dependence of conductivity is associated with the coexistence of magnetic and electric phases in a chemically homogenous system. The analysis using an Arrhenius plot reveals that there are two different temperature dependent mechanisms governing conduction. The distributed hopping model is proposed to explain the divergence from the UDR in conductivity. The change in activation energy shows that the conduction above 353 K (∼0.72 eV) and below 333 K (0.17 eV) is dominated by thermally assisted high and low potential well hopping polarization, respectively. Ba3NbFe3Si2O14 is an aliovalent compound with five different ions, namely Ba2+, Nb5+, Fe3+, Si4+, and O2−. Thus, it is difficult to predict which ions are responsible for conduction in such systems, especially in the polycrystalline form, which also contains imperfections. The dielectric relaxation in such technologically important complex systems needs further investigation. The distributed hopping model is utilized to explain the ‘mixed’ conductivity mechanism in complex dielectric systems which display divergence from the UDR.Conflicts of interest
There are no conflicts to declare.Acknowledgements
One author (SSR) acknowledges the financial support of Science and Engineering Research Board, India (ECR/2017/002691).References
- Yu. K. Pisarevs, P. A. Sertyushenkd, B. V. Mill and N. A. Moiseeva, IEEE International Frequency Control Symposium, 1998, p. 742 Search PubMed.
- H. Seh, H. L. Tuller and H. Fritze, Sens. Actuators, B, 2003, 93, 169–174 CrossRef CAS.
- V. B. Grouzinenko and V. V. Bezdelkin, IEEE Frequency Control Symposium, 1992, p. 17594 Search PubMed.
- R. C. Smythe, IEEE International Frequency Control Symposium, 1998, p. 761 Search PubMed.
- A. A. Kaminskii, B. V. Mill, G. G. Khodzhabagyan, A. F. Konstantinova, A. I. Okorochkov and I. M. Silvestrova, Phys. Status Solidi A, 1983, 80, 387–398 CrossRef CAS.
- M. Honal, R. Fachberger, T. Holzheu, E. Riha, E. Born, P. Pongratz and A. Bausewein, EIA International Frequency Control Symposium and Exhibition, 2000, p. 113 Search PubMed.
- H. Seh and H. L. Tuller, J. Electroceram., 2006, 16, 115–125 CrossRef CAS.
- H. Fritze, H. Seh, H. L. Tuller and G. Borchardt, J. Eur. Ceram. Soc., 2001, 21, 1473–1477 CrossRef CAS.
- A. K. Joncher, Nature, 1977, 263, 673 CrossRef.
- A. K. Joncher, J. Phys. D, 1999, 32, R57–R70 CrossRef.
- M. Pollak and G. E. Pike, Phys. Rev. Lett., 1972, 28, 449 CrossRef.
- S. R. Elliott, Solid State Ionics, 1994, 70–71, 27–40 CrossRef CAS.
- A. S. Nowick, B. S. Lim and A. V. Vaysleyb, J. Non-Cryst. Solids, 1994, 172–174, 1243–1251 CrossRef CAS.
- B. Roling, A. Happe, K. Funke and M. D. Ingram, Phys. Rev. Lett., 1997, 78, 2160 CrossRef CAS.
- David L. Sidebottom, Phys. Rev. Lett., 1999, 82, 3653 CrossRef CAS.
- D. L. Sidebottom, P. F. Green and R. K. Brow, Phys. Rev. Lett., 1995, 74, 5068 CrossRef CAS PubMed.
- W. K. Lee, J. F. Liu and A. S. Nowick, Phys. Rev. Lett., 1991, 67, 1559 CrossRef CAS PubMed.
- N. Lee, Y. J. Choi and S.-W. Cheong, Appl. Phys. Lett., 2014, 104, 072904 CrossRef.
- C. Lee, E. Kan, H. Xiang and M.-H. Whangbo, Chem. Mater., 2010, 22, 5290–5295 CrossRef CAS.
- H. D. Zhou, L. L. Lumata, P. L. Kuhns, A. P. Reyes, E. S. Choi, N. S. Dalal, J. Lu, Y. J. Jo, L. Balicas, J. S. Brooks and C. R. Wiebe, Chem. Mater., 2009, 21, 156–159 CrossRef CAS.
- K. Marty, V. Simonet, E. Ressouche, R. Ballou, P. Lejay and P. Bordet, Phys. Rev. Lett., 2008, 101, 247201 CrossRef CAS PubMed.
- S. S. Rathore and S. Vitta, Sci. Rep., 2015, 5, 9751, DOI:10.1038/srep09751.
- S. S. Rathore, S. K. Mishra and S. Vitta, J. Appl. Phys., 2012, 111, 074103, DOI:10.1063/1.3699198.
- FULLPROF Suite: http://www.ill.eu/sites/fullprof/index.html J. Rodriguez-Carvajal, Phys. B, 1993, 192, 55 CrossRef CAS.
- B. A. Maksimov, V. N. Molchanov, B. V. Mill, E. L. Belokoneva, M. Kh. Rabadanov, A. A. Pugacheva, Yu. V. Pisarevski and V. I. Simonov, Crystallogr. Rep., 2005, 50, 751–758 CrossRef CAS.
- V. M. Boris and Y. K. Pisarevsky, Proc. IEEE Freq. Control Symp., 2000, 33–144 Search PubMed.
- K. C. Kao, Dielectric phenomena in solids, Elsevier, 2004 Search PubMed.
- Kremer F. and Schönhals A. ed. Broadband Dielectric Spectroscopy, Springer, Berlin, Heidelberg, 2003 Search PubMed.
- A. S. Nowick, A. V. Vaysleyb and L. Wu, Solid State Ionics, 1998, 105, 121–128 CrossRef CAS.
- C. Leon, A. Rivera, A. Varez, J. Sanz and J. Santamaria, Phys. Rev. Lett., 2001, 86, 1279 CrossRef CAS PubMed.
- A. S. Nowick and B. S. Lim, Phys. Rev. B: Condens. Matter Mater. Phys., 2001, 63, 184115 CrossRef.
- K. Ngai, A. Jonscher and C. White, Nature, 1979, 277, 185–189 CrossRef CAS.
- K. Funke, Prog. Solid State Chem., 1993, 22, 111–195 CrossRef CAS.
- A. K. Joncher, J. Mater. Sci. Lett., 1998, 17, 1975–1977 CrossRef.
- M. Pollak and T. H. Gabelle, Phys. Rev., 1961, 122, 1745 CrossRef.
- S. R. Elliott, Philos. Mag., 1977, 36, 1291–1304 CrossRef CAS.
- G. E. Pike, Phys. Rev. B: Solid State, 1972, 6, 572–1580 CrossRef.
- A. K. Jonschesr, J. Phys. C: Solid State Phys., 1973, 6, L235, DOI:10.1088/0022-3719/6/11/006.
- M. Gilbert and C. J. Adkins, Philos. Mag., 1976, 34, 143 CrossRef CAS.
- M. Fritze, H. Schulz, H. L. Seh, S. Tuller and K. J. Ganschow, Solid State Ionics, 2006, 177(35–36), 3171–3174 CrossRef.
- T. Wong and M. Brodwin, Solid State Commun., 1980, 36, 503–508 CrossRef CAS.
- E. Barsoukov and J. Ross, Impedance Spectroscopy Theory, Experiment, and Applications, John Wiley & Sons, Inc., Hoboken, New Jersey, 2005 Search PubMed.
| This journal is © the Owner Societies 2021 |