
 Open Access Article
 This Open Access Article is licensed under a Creative Commons Attribution-Non Commercial 3.0 Unported Licence
A mechanism for ageing in a deeply supercooled molecular glass†
Andrew
Cassidy
 *a,
Mads R. V.
Jørgensen
b,
Artur
Glavic
c,
Valeria
Lauter
*d,
Oksana
Plekan
e and
David
Field
a
*a,
Mads R. V.
Jørgensen
b,
Artur
Glavic
c,
Valeria
Lauter
*d,
Oksana
Plekan
e and
David
Field
a
aCenter for Interstellar Catalysis and Department of Physics and Astronomy, Aarhus University, Ny Munkegade 120, Aarhus C, Denmark. E-mail: amc@phys.au.dk
bCenter for Materials Crystallography, iNano & Department of Chemistry, Aarhus University, Langelandsgade 140, Aarhus C, Denmark & MAX IV Laboratory, Lund University, Fotongatan 2, Lund, Sweden
cLaboratory for Neutron and Muon Instrumentation, Paul Scherrer Institut, 5231 Villigen PSI, Switzerland
dNeutron Scattering Division, Oak Ridge National Lab, Oak Ridge, TN 37831, USA. E-mail: lauterv@ornl.gov
eSincrotrone Trieste S.C.p.A., Area Science Park, Strada Statale 14, km 163.5, I-34149 Basovizza, Trieste, Italy
First published on 21st May 2021
Abstract
Measurements of the decay of electric fields, formed spontaneously within vapour-deposited films of cis-methyl formate, provide the first direct assessment of the energy barrier to secondary relaxation in a molecular glass. At temperatures far below the glass transition temperature, the mechanism of relaxation is shown to be through hindered molecular rotation. Magnetically-polarised neutron scattering experiments exclude diffusion, which is demonstrated to take place only close to the glass transition temperature.
Aging or relaxation in supercooled materials may be a two component process in polymeric films,1,2 metallic glasses3–6 liquid crystals7 and, as here, molecular glasses. When heated close to the glass transition temperature, Tg, the two processes, termed the primary and secondary relaxations, merge but in deeply supercooled materials they separate out with different rates and different temperature dependencies. Here, we use measurements of spontaneous dipole orientation in polarised, deeply supercooled molecular solids to follow both processes across a wide temperature range, from 0.5 Tg–Tg. We observe that the energy barrier for the secondary process drops as the growth temperature of the material is decreased.
The growth of glassy molecular solids by condensation of gas is the main growth mechanism for molecular solids in the interstellar medium,8 is frequently used for the production of molecular electronic components9 and, increasingly, for drug delivery solutions.10 It has recently been discovered that molecular ordering can occur in films formed through physical vapour deposition.11–14 The phenomenon appears to be a general consequence of the growth of thin films of molecular materials from the vapour phase. It has been established that a class of polar molecules can condense and harbour spontaneously-generated electric fields via molecular dipolar-orientation.11,12,15 Such fields are created with no external agency, such as an applied field, but are a natural consequence of deposition of a polar molecule. This so-called ‘spontelectric effect’ relies on molecular orientation and arises in the absence of any free charge.11 Since electric fields arise from collective dipole orientation, migration of dipoles, away from this ordered state, results in depolarisation. Thus, any observed decay of the field tracks molecular rotation. Accordingly, molecular rotations are followed here through the temporal decay of the spontelectric field in films of cis-methyl formate, henceforth MF. This is an extremely sensitive means of detecting molecular rotation in solids. Changes of a few hundredths of a degree in average angle of dipole orientation with time are readily observable, allowing for investigations on short time-scales of a few hours.
Fig. 1 shows that the spontelectric phenomenon gives a new and highly sensitive handle on molecular rotation in polarised glasses, at deeply supercooled temperatures, where secondary relaxation is active.16 The strength of the electric field harboured by a film of MF was inferred from the surface potential measured at the film-vacuum interface atop a film of a known thickness.17 Throughout, we assume that MF adopts the cis conformation as this is energetically preferred, with a 546 meV barrier blocking transformation to trans.18 The correlation between measured electric field strength and deposition temperature, Td, for MF is shown in Fig. 1. For Td = 80 K to 89 K, Fig. 1A, field strength decreases with time, with a lag period of up to ∼2000 s before this decay begins. In this temperature regime, the internal electric field also increases with increasing Td and this has been explained elsewhere.17
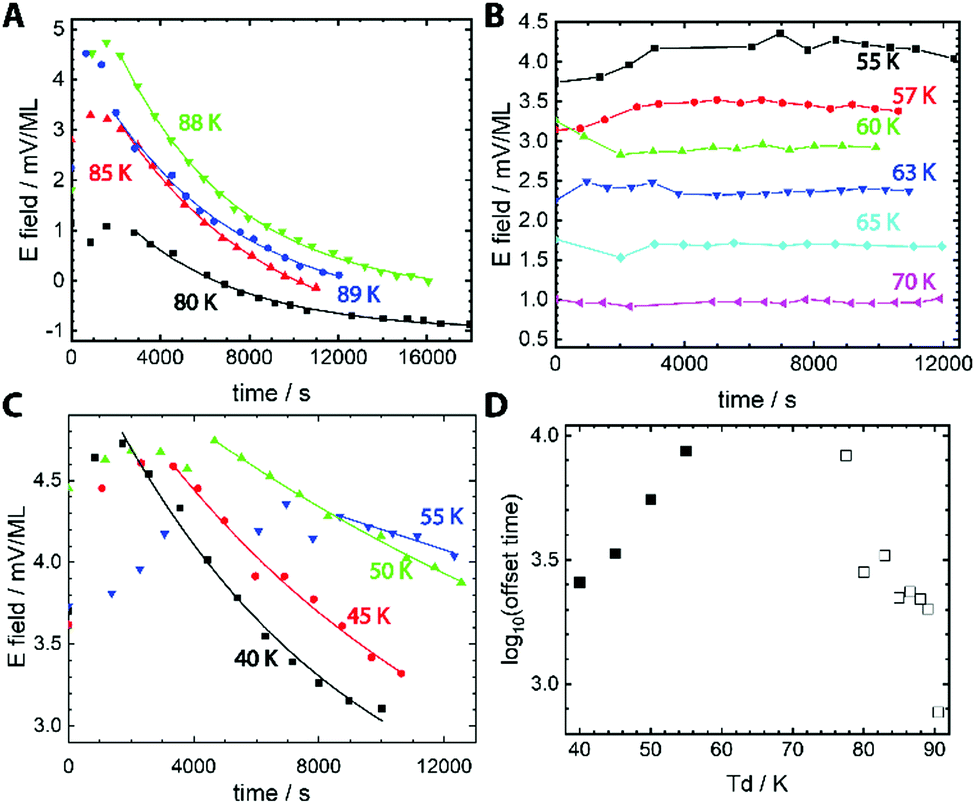 | ||
| Fig. 1 Isothermal surface potential decay. (A–C) The decay in the strength of electric field measured in films of cis-methyl formate is plotted for films prepared across a range of temperatures of deposition (Td). Measurements were performed during growth of the film, with each data point on a given curve representing a different film thickness, but data are plotted as a function of time. Data are divided into three temperature regimes: (A) high Td where the electric field decays to a constant value irrespective of Td; lines are results from fits (see text); (B) mid-range Td, where the electric field values are stable. Lines here are added as a guide to the eye and; (C) low Td, where the electric field does not decay to zero where lines here result from fits. (D) The lag period before field decay begins, for fits presented in (A and C) are plotted as a function of Td. Systematic errors in (E) field measurements arise from systematic errors in the film thickness, ±20%. | ||
Data are presented as a function of time, illustrating the rate of field decay. Data in Fig. 1A demonstrate exponential decay of the field to a constant value, c, and the solid lines represent fits resulting from y = y0![[thin space (1/6-em)]](https://www.rsc.org/images/entities/char_2009.gif) exp(−t/τ)β + c, where t is the elapsed time, y0 is the initial electric field before decay begins and τ is the time constant for the decay process.19 Fits resulted in β values very close to 1, and we set β = 1 throughout. This value of β may be related to the short timescales over which aging is reported here.20 The residual surface potential measured at extended time delays in Fig. 1A, represented by the constant c, are a measure of the work function of the MF film and are not related to the spontelectric effect.
exp(−t/τ)β + c, where t is the elapsed time, y0 is the initial electric field before decay begins and τ is the time constant for the decay process.19 Fits resulted in β values very close to 1, and we set β = 1 throughout. This value of β may be related to the short timescales over which aging is reported here.20 The residual surface potential measured at extended time delays in Fig. 1A, represented by the constant c, are a measure of the work function of the MF film and are not related to the spontelectric effect.
In the mid-temperature regime, for Td between 55 K and 70 K, Fig. 1B, the electric field values are constant at any given Td and this constant value decreases as Td increases. This is the behaviour expected of spontelectric materials.11,17 At low deposition temperatures, below 55 K in Fig. 1C and extending to the lowest temperature of 40 K, there is again a decay in the electric field as a function of time and, again, a lag period before electric field values start to decrease. The lag period decreases as Td is decreased. In addition, the final value to which the field decays, variable “c” above, is lower for lower values of Td, representing residual dipole alignment. The lag periods before decay, for Td ≤ 55 K and Td ≥ 75 K are collected in Fig. 1D. For 90 K > Td > 75 K the lag times change by an order of magnitude and decrease with increasing Td. Thus films age faster as the growth temperature is increased, as expected. Conversely, lag times for Td ≤ 55 K decrease as Td drops lower, meaning films age faster as growth temperature drops.
If the lag period represents the time taken before the first molecules begin to rotate away from a dipole-oriented conformation, then the inverse lag time can be used to establish a rate for this rotation process. The degree of dipole orientation is defined as 〈μz〉/μ, where 〈μz〉 indicates the component of the molecular dipole, μ, pointing in the direction of the electric field, that is, normal to the plane of the film. The process of the decay of 〈μz〉/μ has been modelled as first order and the corresponding rate coefficients and activation energies are shown in columns 2 and 3 of Table 1.
| T d (K) | Lag period (s) | Rate constant, k, for decay of 〈μz〉/μ (s−1) | Activation energy,
|
Time constant, τ, for exp decay of 〈μz〉/μ (s) |
|---|---|---|---|---|
| 40 | 2564 | 3.900 × 10⁻⁴ | 0.112 | 5622 |
| 45 | 3348 | 2.987 × 10⁻⁴ | 0.127 | 11185 |
| 50 | 5520 | 1.812 × 10⁻⁴ | 0.143 | 17230 |
| 55 | 8672 | 1.153 × 10⁻⁴ | 0.160 | 102894 |
| 77.5 | 8336 | 1.200 × 10⁻⁴ | 0.225 | 2.35 × 10+5 |
| 80 | 2816 | 3.551 × 10⁻⁴ | 0.225 | 5180 |
| 83 | 3298 | 3.032 × 10⁻⁴ | 0.234 | 5420 |
| 85 | 2222 | 4.500 × 10⁻⁴ | 0.237 | 6763 |
| 86.5 | 2350 | 4.255 × 10⁻⁴ | 0.241 | 4485 |
| 88 | 2200 | 4.545 × 10⁻⁴ | 0.245 | 5291 |
| 89 | 2010 | 4.975 × 10⁻⁴ | 0.247 | 6196 |
| 90.5 | 770 | 1.299 × 10⁻³ | 0.244 | 1031 |
The time constants used to produce the exponential fits in Fig. 1 represent the rate at which the decay of 〈μz〉/μ propagates throughout the film. The interpretation of this and an understanding of the dynamics of molecular rotations, in the context of the spontelectric field permeating the films, will be considered elsewhere.
We now show that molecular diffusion does not occur below ∼80 K and thus that aging between 40 K and 55 K is not caused by diffusion. Magnetically-contrasted neutron scattering was used to measure the self-diffusion of molecules of MF on molecular length scales as a function of sample temperature. Alternate dosing of D- and H-MF was used to prepare a pentalayered-sandwich of MF, in which the isotopic substitution does not affect the chemical, kinetic and thermodynamic properties of the MF film. Reflectivity plots, as a function of scattering vector magnitude Q, from two distinct, pentalayered-films, grown at Td = 45 K and Td = 65 K, and recorded repeatedly as both films were annealed to progressively higher temperatures, and data at Td = 45 K are shown in Fig. 2. Full datasets and data for trilayer-films with better temperature resolution are included as ESI.†
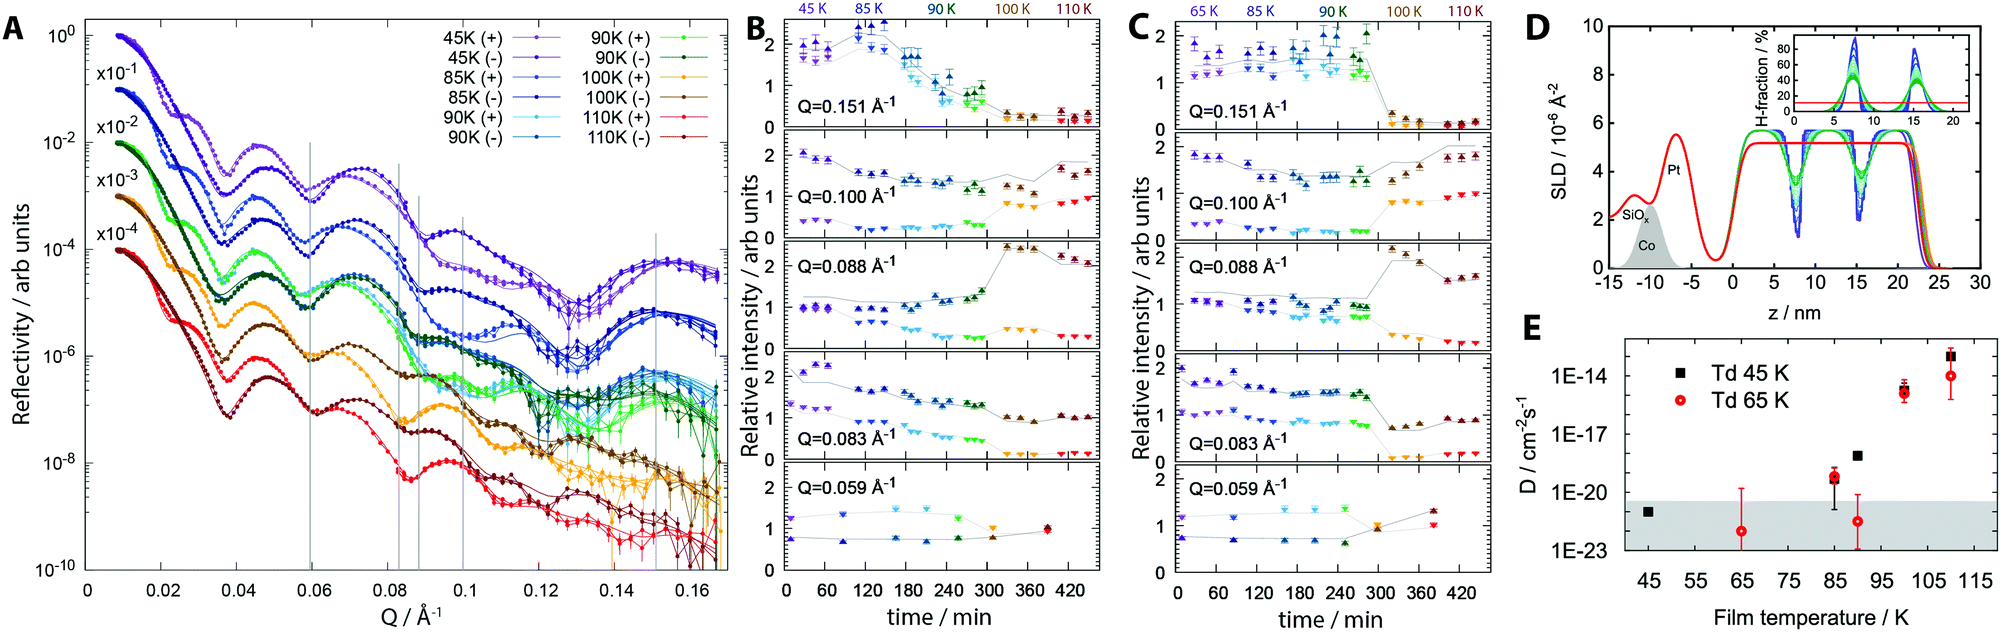 | ||
| Fig. 2 Neutron scattering data from distinct penta-layered films of methyl formate. (A) Reflectivity plot, as a function of scattering vector magnitude Q, for a film prepared at Td = 45 K and gradually annealed to higher temperatures. (B) Relative intensity for data in (A), Td = 45 K; fits at specific Q values were extracted and plotted as a function of time, where 0 min indicates the beginning of the first measurement. There are several time values for each annealing temperature (see main text and ESI†) and colour has been used to distinguish between annealing points. Errors arise from signal to noise limits. Lines represent fits resulting from the self-diffusion model. (C) Relative intensity at specific Q values for Td = 65 K. (D) Scattering length density profiles, Td = 45 K; inset shows H-fraction. (E) Self-diffusion coefficients for Td = 45 K and Td = 65 K measured as films were annealed to progressively higher temperatures. The grey area indicates the lower limit of detection and diffusion coefficient values in this regime are too low to be modelled reliably. | ||
The reflectivity profiles in Fig. 2A result from the depth-sensitive interaction of the polarised neutron beam with the various isotopically labelled interfaces created within the structure. Data were collected for approximately 1 hour at each temperature point, yielding the time dependence of physical changes. A model that allowed for loss of definition at isotopically labelled interfaces via diffusion, according to Fick's Law, was fit to the reflectivity profiles. The resulting fits in Fig. 2A allow us to produce; (i) time resolved data, Fig. 2B and C, where relative intensity values have been extracted at specific Q values as a function of both time and temperature for films with Td = 45 K and 65 K, and (ii) a real space visualisation of the interface diffusion as scattering length density (SLD) profiles, Fig. 2D (see ESI†). High values of Q are most sensitive to the layered structure of a film and changes in these values indicate mixing between layers. Neither the Td = 45 K nor the Td = 65 K films show any mixing upon growth and very little mixing after annealing to 85 K. Above 85 K and the 120 min mark, relative intensities at Q = 0.151 Å−1 in the Td = 45 K film begin to change gradually. Both Td = 45 K and Td = 65 K films show a step change above 90 K in Q data. Above 90 K, the composite film is no longer identifiable as distinct D- and H-layers, for either the Td 45 K or the Td 65 K films; above 100 K, the MF isotopologues have completely mixed homogeneously throughout the entire film (see ESI†). This mixing results from primary structural reorganisation of the films, and demonstrates that both films have now passed the glass transition temperature. Methyl formate remains adsorbed on the substrate up to 135 K.21 Mixing for the Td = 45 K film begins at a lower temperature, 90 K compared to 100 K for the Td = 65 K film, indicating a lower Tg, and a less stable material when Td = 45 K.
Self-diffusion coefficients, D, can be plotted as a function of anneal temperature for both penta-layered films, Fig. 2E, and trilayered films, ESI.† Following growth, films have an upper limit of D = 1 × 10⁻²⁰ cm−2 s−1, the lowest diffusion coefficient that can be reliably inferred from this analysis, and there is no measureable diffusion at a resolution of 0.5 nm. Upon annealing to 85 K, D = 4.8 × 10⁻²⁰ cm−2 s−1 for Td = 45 K and 6.6 × 10⁻²⁰ cm−2 s−1 for Td = 65 K. Thus, both systems demonstrate very small, but measureable molecular translational motions. On annealing to 100 K, the coefficient increases to 1.77 × 10⁻¹⁵ cm−2 s−1 for Td = 45 K and 1.24 × 10⁻¹⁵ cm−2 s−1 for Td = 65 K. Both values are representative of viscous glassy materials demonstrating liquid-like behaviour above the glass transition temperature.22 From 90 K and above, diffusion constants for the Td = 45 K film are consistently higher than the values for the Td = 65 K film, confirming the film with Td = 65 K to be the more stable glass.23 In a separate experiment, films with Td = 45 K subjected to slow thermal anneal produce a gradual reduction in surface potential as the temperature is increased, while films with Td = 65 K demonstrate stable surface potentials under the same conditions; see ESI.†
Decay in the electric field for films with Td ≤ 55 K, Fig. 1C, is not associated with structural reorganisation caused by diffusion and therefore cannot be ascribed to the primary relaxation process. The depolarisation mechanism in MF films is directly linked to the secondary relaxation mechanism for glassy solids and electric field decay can act as a direct probe of molecular dynamics. For films of MF we see that this occurs over laboratory time scales, through molecular rotation. Films with Td ≤ 55 K relax via this secondary relaxation pathway, on laboratory timescales, while films with Td > 55 K do not. We note that our observations are in accord with the formation of ‘ultra-stable’ glasses, as distinct from ordinary glasses. These have been observed to form if Td falls within a critical temperature window, when grown, as here, via physical vapour deposition. This window has been reported to lie between 0.8 to 0.91 Tg.24 Here we find that the critical window for ultra-stable MF glasses lies between 60 K and 75 K, that is, 0.66 Tg to 0.83 Tg given Tg = 90 K.
These real-time measurements of molecular motions are complimentary to other measurements of relaxation, such as solid-state NMR or dielectric spectroscopies, that rely on interpretation of data in the frequency domain.25,26 Solid-state NMR spectroscopy has revealed that molecular mobility may originate from collective oscillations of individual molecules within a tightly confined volume, with energy barriers limiting the degree of oscillation possible.25,26 Such motions may not always be evident from dielectric spectroscopy measurements, leading to some confusion in the literature about the generality of the secondary relaxation pathway for species which form molecular glasses.26 Other measurements of dipole ordering via ellipsometry or X-ray scattering, for example, have not been used to probe secondary relaxations.12,27
The spontelectric effect offers a new and very sensitive means of studying relaxation phenomena in glasses far below the glass transition temperature. In a separate paper, a mean field model of the spontelectric effect is used to consider the energetics of the molecular rotations presented here. Neutron scattering data, allow us to exclude diffusion in this temperature regime. Recent work with metallic glasses has suggested that on short time scales, as reported here, it may be useful to separate out secondary relaxation processes into enthalpy and entropy changes.28 Electric field measurements, similar to those reported here, may also prove useful in studying memory effects in the rejuvenation of glasses successively annealed to different temperatures on short time scales, which have been reported for a variety of glassy materials.29,30
AC&MRVJ thank the Danish National Research Foundation (Center for Interstellar Catalysis, DNRF150 & Center for Materials Crystallography, DNRF93, respectively) and the Danish Agency for Science, Technology, and Innovation for funding the instrument center DANSCATT. This research used resources at the Spallation Neutron Source, a DOE Office of Science User Facility operated by the Oak Ridge National Laboratory. We thank H. Ambaye & A. C. Steffen during the preparation of the equipment for the NR experiments; and Drs M. Milas, U. Mueller and I. Kantor at the MAX IV Lab. during beam time at the BioMAX beamline.
Conflicts of interest
There are no conflicts to declare.Notes and references
- D. Cangialosi, V. M. Boucher, A. Alegría and J. Colmenero, Phys. Rev. Lett., 2013, 111, 095701 CrossRef PubMed.
- V. M. Boucher, D. Cangialosi, A. Alegría and J. Colmenero, J. Chem. Phys., 2017, 146, 203312 CrossRef PubMed.
- L. Song, W. Xu, J. Huo, J.-Q. Wang, X. Wang and R. Li, Intermetallics, 2018, 93, 101–105 CrossRef CAS.
- D. P. B. Aji and G. P. Johari, J. Chem. Phys., 2015, 142, 214501 CrossRef CAS PubMed.
- Q. Yang, S.-X. Peng, Z. Wang and H.-B. Yu, Natl. Sci. Rev., 2020, 7, 1896–1905 CrossRef CAS.
- M. Gao and J. H. Perepezko, Phys. Rev. Mater., 2020, 4, 025602 CrossRef CAS.
- J. Fan, E. I. Cooper and C. A. Angell, J. Phys. Chem., 1994, 98, 9345–9349 CrossRef CAS.
- E. F. Van Dishoeck, E. Herbst and D. A. Neufeld, Chem. Rev., 2013, 113, 9043–9085 CrossRef CAS PubMed.
- W. Brütting, S. Berleb and A. G. Mückl, Org. Electron., 2001, 2, 1–36 CrossRef.
- O. Shalev, S. Raghavan, J. M. Mazzara, N. Senabulya, P. D. Sinko, E. Fleck, C. Rockwell, N. Simopoulos, C. M. Jones, A. Schwendeman, G. Mehta, R. Clarke, G. E. Amidon and M. Shtein, Nat. Commun., 2017, 8, 711 CrossRef PubMed.
- D. Field, O. Plekan, A. Cassidy, R. Balog, N. C. Jones and J. Dunger, Int. Rev. Phys. Chem., 2013, 32, 345–392 Search PubMed.
- D. Yokohama, Y. Setoguchi, A. Sakaguchi, M. Suzuki and C. Adachi, Adv. Funt. Mater., 2010, 20, 386–391 CrossRef.
- H.-W. Lin, C.-L. Lin, H.-H. Chang, Y.-T. Lin, C.-C. Wu, Y.-M. Chen, R.-T. Chen, Y.-Y. Chien and K.-T. Wong, J. Appl. Phys., 2004, 95, 881–886 CrossRef CAS.
- D. Yokoyama, A. Sakaguchi, M. Suzuki and C. Adachi, Appl. Phys. Lett., 2008, 93, 173302 CrossRef.
- I. K. Gavra, A. N. Pilidi and A. A. Tsekouras, J. Chem. Phys., 2017, 146, 104701 CrossRef PubMed.
- G. P. Johari and M. Goldstein, J. Chem. Phys., 1970, 53, 2372–2388 CrossRef CAS.
- O. Plekan, A. Cassidy, R. Balog, N. C. Jones and D. Field, Phys. Chem. Chem. Phys., 2012, 14, 9972–9976 RSC.
- M. Roman, A. Dunn, S. Taj, Z. G. Keolopile, A. Rosu-Finsen, M. Gutowski, M. R. S. S. McCoustra, A. M. Cassidy and D. Field, Phys. Chem. Chem. Phys., 2018, 20, 29038–29044 RSC.
- A. Amir, Y. Oreg and Y. Imry, Proc. Natl. Acad. Sci. U. S. A., 2012, 109, 1850–1855 CrossRef CAS PubMed.
- Z. W. Wu, W. Kob, W.-H. Wang and L. Xu, Nat. Commun., 2018, 9, 5334 CrossRef CAS PubMed.
- D. J. Burke, F. Puletti, W. A. Brown, P. M. Woods, S. Viti and B. Slater, Mon. Not. R. Astron. Soc., 2015, 447, 1444–1451 CrossRef CAS.
- S. F. Swallen, K. Traynor, R. J. Mcmahon, M. D. Ediger and T. E. Mates, J. Phys. Chem. B, 2009, 113, 4600–4608 CrossRef CAS PubMed.
- S. F. Swallen, K. L. Kearns, M. K. Mapes, Y. S. Kim, R. J. McMahon, M. D. Ediger, T. Wu, L. Yu and S. Satija, Science, 2007, 315, 353–356 CrossRef CAS PubMed.
- K. L. Ngai, L. M. Wang and H. Bin Yu, J. Phys. Chem. Lett., 2017, 8, 2739–2744 CrossRef CAS PubMed.
- M. Vogel and E. Rössler, J. Chem. Phys., 2001, 115, 10883–10891 CrossRef CAS.
- M. Vogel, C. Tschirwitz, G. Schneider, C. Koplin, P. Medick and E. Rössler, J. Non-Cryst. Solids, 2002, 307–310, 326–335 CrossRef CAS.
- T. Komino, H. Nomura, M. Yahiro and C. Adachi, J. Phys. Chem. C, 2012, 116, 11584–11588 CrossRef CAS.
- L. Song, W. Xu, J. Huo, F. Li, L.-M. Wang, M. D. Ediger and J.-Q. Wang, Phys. Rev. Lett., 2020, 125, 135501 CrossRef CAS PubMed.
- H. Yardimci and R. L. Leheny, EPL, 2003, 62, 203 CrossRef CAS.
- C. Scalliet and L. Berthier, Phys. Rev. Lett., 2019, 122, 255502 CrossRef CAS PubMed.
Footnote |
| † Electronic supplementary information (ESI) available: Demonstrating neutron scattering from trilayer films and X-ray diffraction data from cryo-cooled samples of methyl formate. See DOI: 10.1039/d1cc01639c |
| This journal is © The Royal Society of Chemistry 2021 |