Imaging the distribution of DMPBD and terpinen-4-ol inclusion complexes with 2-hydroxypropyl-β-cyclodextrin by using TOF-SIMS†
Auraya
Manaprasertsak
a,
Per
Malmberg
 b,
Theerachart
Leepasert
a and
Thitinun
Karpkird
 *a
*a
aDepartment of Chemistry, Faculty of Science, Kasetsart University, 10900 Bangkok, Thailand. E-mail: fscitnm@ku.ac.th
bDepartment of Chemistry and Chemical Engineering, Centre for Imaging Mass Spectrometry, Chalmers University of Technology, 41296 Gothenberg, Sweden
First published on 25th November 2020
Abstract
The distribution of terpinen-4-ol (TP4ol) and DMPBD inclusion complexes with 2-hydroxypropyl-β-cyclodextrin (HPbCD) in human skin has been investigated using the TOF-SIMS technique. TP4ol and DMPBD have been found to be major components of Zingiber cassumunar Roxb. (Plai) oil extracted by steam distillation. The results mainly show accumulation of TP4ol and DMPBD inclusion complexes with HPbCD in the epidermis and dermis whereas these two compounds without cyclodextrin cannot penetrate into the epidermis. This approach can be expanded for investigation of anti-inflammatory action and relief of muscle pain.
Introduction
Zingiber cassumunar Roxb. (Plai) is a species of plant in the ginger family. It is widely distributed throughout Southeast Asia, and contains essential oils within the oil glands that are commonly found in most plant parts, especially the rhizome.1 The active components in essential oil from Zingiber cassumunar Roxb. (Plai oil; PO), sabinene, terpinen-4-ol (TP4ol) and (E)-1-(3,4-dimethoxyphenyl)butadiene (DMPBD) have been reported for several biological activities, such as anti-microbials, anti-inflammatory agents, analgesics, smooth muscle relaxants, anti-tyrosinase, mosquito repellents, carminatives, mild laxatives, and anti-dysentery and anti-oxidant agents (Fig. 1).2 Moreover, DMPBD is more potent than other standard inflammatory drugs being used such as diclofenac, oxyphenbutazone, phenidone and aspirin.3 Nevertheless, the poor solubility and low stability, evidenced by a rancid smell and color change due to oxidation when exposed to light and air, are drawbacks for using DMPBD as an anti-inflammatory drug. In order to overcome these limitations, encapsulation technology is utilized.4–8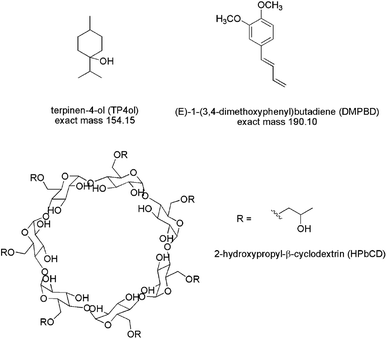 | ||
| Fig. 1 Chemical structures and molecular weights of terpinen-4-ol (TP4ol), DMPBD and 2-hydroxypropyl-β-cyclodextrin (HPbCD). | ||
Encapsulation technology has been applied to improve the stability of entrapped ingredients from environmental damage and for easy handling through solidification. The encapsulation agent provides overall protection to the agent from harsh environments, improves its stability, activity, targeted delivery and sustained release. These properties offer significant advantages in the area of pharmaceutical applications. Pharmaceutical applications constantly explore new approaches to improve drug delivery efficiency, targeted delivery, sustained activity, extended release and to immobilize poorly soluble drugs.9,10
Cyclodextrins (CDs) are the cyclic α-1,4-linked oligosaccharides of α-D-glucopyranose. The structure of cyclodextrins consists of outer hydrophilic surfaces and inner lipophilic cavities (Fig. 1). Thus, the hydrophobic drug can be encapsulated inside the cavity of cyclodextrin to form a noncovalent inclusion complex, which can improve the solubility of the encapsulated drug.11,12 β-Cyclodextrin (bCD) has been widely used in the early stages of pharmaceutical applications because of its ready availability and cavity size suitable for the widest range of drugs. The 2-hydroxypropyl-β-cyclodextrin (HpbCD) was grafted with polyethyleneimine, as a penetration enhancer, and its viability was evaluated on improving transdermal delivery of diclofenac sodium.13 In order to study targeted delivery of the encapsulation in this research, we focused on skin distribution and permeation. TOF-SIMS is a mass spectrometry technique that combines a time-of-flight analyzer with the secondary mass spectrometry ionization method. It is a surface sensitive technique that analyzes the outermost layer of a sample.
The TOF-SIMS technique combines the chemical specificity of mass spectrometry with the ability to image at high spatial resolution using a micro-focused energetic ion beam to ablate and ionize molecules from the sample surface.14 TOF-SIMS has been shown to be a good method for lipid analysis in many studies, which is a large group of compounds found in all living organisms, such as brain tissue15 and heart tissue.16 Moreover, TOF-SIMS has been used to study penetration in human skin which consists of three layers, epidermis, dermis and subcutaneous tissue (hypodermis). It allows the collection of information from elements, such as nickel, copper and aluminum, simultaneously collecting molecular information from lipids, such as cholesterol and vitamin D.17 In this work, the skin permeation efficiency and the selectivity of DMPBD and terpinen-4-ol inclusion complexes with 2-hydroxy-β-cyclodextrin using TOF-SIMS has been investigated.
Experimental
Materials and methods
The fresh rhizomes of Zingiber cassumunar Roxb. (Plai) were harvested from Surat Thani, Thailand (October, 2017). 2-Hydroxypropyl-beta-cyclodextrin average Mw = 1460 (0.8 molar substitution) was purchased from Sigma-Aldrich (MO, USA). Ethanol was purchased from Labscan Co., Ltd. (Bangkok, Thailand).Instruments
Gas chromatography mass spectrometry (GC-MS) analysis was performed by using a gas chromatography mass spectrometer QP2020 (Shimadzu, Japan). Time of flight secondary ion mass spectrometry experiments were performed by TOF-SIMS V (ION-TOF, Munster, Germany) and the skin tissue samples were sliced to be 10 μm by using a cryostat microtome (Leica CM1520, Germany) at the Gothenburg Imaging Mass Spectrometry (Go:IMS) platform at University of Gothenburg and Chalmers University of Technology, Sweden.Preparation of PO–beta-cyclodextrin inclusion complexes
The PO–HpbCD inclusion complex was prepared by dissolving 50 mg of 2-hydroxyl-β-cyclodextrin (HpbCD) in 30 mL of distilled water. 50 mg Plai oil (PO) was dissolved in 6 mL of ethanol, then the ethanol solution was slowly added to the HpbCD solution. The mixture was stirred at room temperature for 24 h. Then it was centrifuged to separate the excess PO and the clear solution was dried using a lyophilization technique. The loading efficiency of PO in the inclusion complex was calculated by GC-MS to be 12%.Analysis of inclusion complexes
The PO–HPbCD inclusion complexes were analyzed using imaging mass spectrometry and time-of-flight secondary ion mass spectrometry (TOF-SIMS). 5 μL of inclusion complex solutions (1 mg mL−1) were dropped on a small piece of steel covered with aluminum foil and then the dried droplets were mounted on a sample holder for TOF-SIMS analysis.Skin exposure
The human skin, considered a by-product, was obtained after abdominal surgery at Department of Plastic Surgery, Sahlgrenska University Hospital, Sweden. The excess tissue was made anonymous upon collection in agreement with the routine approved by the local ethics committee. The skin tissue was trimmed from subcutaneous fat and mounted on a cork sheet. It was cut into 2 × 2 cm for each piece mounted on the cork sheet and wrapped in aluminum foil, kept at −20 °C until further use. The skin tissue was thawed at room temperature for 30 minutes prior to experiments. The Franz diffusion cell was prepared according to the Organization of Economic Co-operation and Development guidelines.18 The receptor compartment was filled with 15 mM of ammonium formate. After the 2 × 2 cm2 skin tissue was mounted on a Franz diffusion cell, 1 mL of inclusion complex solution (50 mg mL−1 equivalent to 6 mg of PO) was added as the donor fluid and the diffusion cell was wrapped by using parafilm. The diffusion was performed at 32 °C for 24 hours. After 24 hours, the skin tissue was removed and rinsed with distilled water. The center of the exposure area was cut using an 8 mm disposable biopsy punch and frozen in liquid nitrogen. The frozen skin was wrapped with aluminum foil and kept at −20 °C until further use.Sample preparation for TOF-SIMS
The frozen skin was vertically sliced using a cryostat microtome (Leica CM1520, Germany) at −20 °C to obtain thin sections with 10 μm thickness. To avoid contamination, no fixation was used. The vertical skin sections were thaw-mounted on an indium tin oxide (ITO)-coated glass slide. The slides were stored at −20 °C. Prior to TOF-SIMS analysis, they were rapidly transferred to vacuum desiccators to thaw for 30 minutes at room temperature.TOF-SIMS analysis
TOF-SIMS imaging was carried out using TOF-SIMS V (ION-TOF, Munster, Germany), equipped with a bismuth liquid metal ion gun as a primary ion source and a C60 ion source as a sputter source. The TOF-SIMS spectra were recorded in positive and negative ion modes, using Bi3+ as the primary ion source at 25 keV in the high current bunched mode with a pulsed primary ion current of 0.34 pA. The maximum ion dose density was around 1.5 × 10¹¹ ions per cm2 during all experiments, below the static limit (1× 10¹³ ions per cm2) to minimize surface damage. All TOF-SIMS data analyses were performed with the Surface Lab software (version 6.7; ION-TOF).The mass spectra were internally calibrated to signals of [C]+, [CH]+, [CH2+] and [CH3+] that are commonly used for calibration in the positive ion mode and [C]−, [CH]−, [C2]− and [C3]− in the negative ion mode. The depth profile was performed in the non-interlaced mode with C60++ ions at a current of 0.18 nA, sputtering a crater of 500 × 500 μm2, and analyzing area of 300 × 300 μm2 with Bi3+. The total C60 dose in the experiment was 2 × 10¹⁴ ions per cm2 which corresponds to an approximate depth of 400 nm in the graft, if compared with a depth profile of a standard organic material with the same ion dose.19 The red/green/blue (RGB) color overlays are represented in a linear relationship ranging from signal intensity of zero as black to 100% color for the maximum ion count for that respective ion. TOF-SIMS analysis was repeated in triplicate for each sample exposed tissue to confirm analytical repeatability.
Results and discussion
The investigation of DMPBD and terpen-4-ol inclusion complexes with bCD and HPbCD by TOF-SIMS
PO inclusion complexes with beta-cyclodextrin (bCD) and HPbCD were first confirmed by GC-MS showing a loading efficiency of 29% and 12%, respectively, indicating that only DMPBD and terpinen-4-ol (TP4ol) were detected from both bCD and HPbCD inclusion complexes (data showed in the ESI†). The HPbCD complex was chosen for the delivery of DMPBD and TP4ol to the skin tissue because it was more water soluble than the bCD complex at high concentrations. The TOF-SIMS technique has been used in this research for investigation of the distribution of PO in skin tissue; therefore, the PO–HPbCD inclusion complex was re-confirmed by the TOF-SIMS technique. The results shown in Fig. 2 are obvious signals at m/z 153–155 and 189–191, which corresponded to the molecular weight of TP4ol (154 g mol−1) and DMPBD (190 g mol−1) (full spectra have been shown in the ESI†). The signals between m/z 20–60 probably occurred from the fragmentation of TP4ol and DMPBD. Moreover, the spectrum of the HPbCD complex (Fig. 2) showed the signal of bCD at m/z 1157 [bCD + Na]. | ||
| Fig. 2 The TOF-SIMS spectra in the 150–270 mass range of the bCD complex (a) and the HPbCD complex (b) (mass range 0–800 is shown in the ESI†). | ||
The TOF-SIMS spectra of HPbCD complexes are shown in Fig. 3.
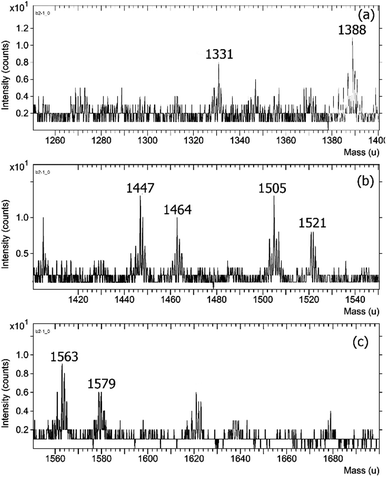 | ||
| Fig. 3 The TOF-SIMS spectra of the HPbCD complexes in the range of 1250–1400 (a), 1400–1560 (b) and 1560–1700 (c). | ||
HPbCD was substituted by 2-hydroxy propyl producing a mixture of a number of 2-hydroxypropyl groups. The TOF-SIMS spectra showed the m/z signals of the mixture of many 2-hydroxypropyl groups substituted on beta-cyclodextrin.
The three to seven 2-hydroxypropyl groups substituted were found and showed m/z 1332 [bCD3HP + Na]+, 1389 [bCD4HP + Na]+, 1447 [bCD5HP + Na]+, 1505 [bCD6HP + Na]+ and 1564 [bCD7HP + Na]+. The inclusion complexes of TP4ol and DMPBD with HPbCD were found by TOF-SIMS analysis. The signal at m/z 1464 corresponded to TP4ol:bCD3HP as a major adduct whereas the signals at m/z 1522 were possible for both [DMPBD:bCD3HP + Na]+ and [TP4ol:bCD4HP]+.
The signal at m/z 1580 corresponded to [DMPBD:bCD4HP + Na]+. Therefore the results clearly show that TOF-SIMS analysis is the appropriate technique for this study. The intensity of each species detected by TOF-SIMS reported in Table 1 indicated that the inclusion complexes of TP4ol:bCD3HP, TP4ol:bCD4HP and DMPBD:bCD3HP were the most abundant. These results suggested that the steric effect of 2-hydroxypropyl moiety substituted bCD might affect the inclusion complex formation with TP4ol and DMPBD. Therefore, the inclusion complexes of TP4ol and DMPBCD with bCD with higher 2-hydroxypropyl substitution were not found.
| Found (m/z) | Calculated exact mass | Possible ion formula | Intensity (counts) |
|---|---|---|---|
| a Mean ± SD (n = 3; P values were determined by using the student T-test, P < 0.05). | |||
| 1331 | 1330.48 | [bCD3HP + Na]+ | 8.30 ± 0.56a |
| 1388 | 1388.52 | [bCD4HP + Na]+ | 16.07 ± 2.00 |
| 1447 | 1446.56 | [bCD5HP + Na]+ | 13.60 ± 1.15 |
| 1464 | 1464.65 | [TP4ol:bCD3HP]+ | 10.53 ± 1.19a |
| 1505 | 1504.60 | [bCD6HP + Na]+ | 13.47 ± 1.75 |
| 1521 | 1520.58 | [DMPBD:bCD3HP + Na]+ | 8.47 ± 0.45a |
| 1522.69 | [TP4ol:bCD4HP]+ | 8.53 ± 0.75a | |
| 1563 | 1562.64 | [bCD7HP + Na]+ | 8.87 ± 1.50a |
| 1579 | 1578.62 | [DMPBD:bCD4HP + Na]+ | 6.07 ± 1.10a |
Distribution of DMPBD and terpinen-4-ol inclusion complexes with bCD and HPbCD in skin tissue
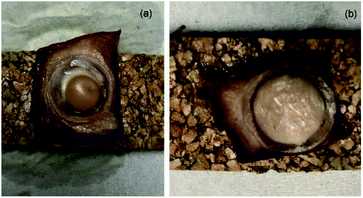
The HPbCD complex was tested for the delivery of DMPBD and TP4ol to the skin tissue because it was more water soluble than the bCD complex at high concentrations. Fig. 4 shows the comparison of PO (a) and the PO–HPbCD inclusion complex (b) applied on skin tissue. It was clearly shown that if PO without HPbCD (Fig. 4a) accumulated on the skin surface then the tissue could not be cut to be analysed by TOF-SIMS. Fig. 4b shows PO–HPbCD applied on the skin tissue and no skin blister was detected, indicating that the PO–HPbCD inclusion complex could penetrate into the lower skin tissue. The distribution of PO components, TP4ol and DMPBD, in the skin tissue was studied by the TOF-SIMS technique. The overlay spectra of the HPbCD inclusion complex exposed in skin tissue and control skin (Fig. 5) showed obviously different intensities from the spectrum of control skin at m/z 153–155 and 189–191 which correspond to TP4ol and DMPBD, respectively. | ||
| Fig. 5 TOF-SIMS spectra of TP4ol (a) and DMPBD (b) in the selected area from the control skin (blue) and the HPbCD inclusion complex exposed skin (red). | ||
Moreover, stratum corneum (SC) is a skin layer composed of corneocytes and extracellular lipid matrix. The SC lipid matrix is mainly composed of neutral lipids: ceramides, cholesterol and free fatty acids. Oleic and linoleic acids are the only unsaturated fatty acids detected in SC studied by the TOF-SIMS technique. The phosphatidylcholine (PC) headgroup, a fragment of all major PCs in cell membranes [C5H15PNO4]+ was found at m/z 184 and the cholesterol major cholesterol fragment [C27H45]+ was found at m/z 369. The fragmentation of phosphatidylinositol (PI) was detected at m/z 221 (ref. 20 and 21) and m/z 281 was reported as a signal of oleic acid (data shown in the ESI†).22,23 To identify the distinction between the viable epidermis and the stratum corneum in Fig. 6, phospholipids are not present in the stratum corneum due to the cornification process as free esterified sterols accumulate.24
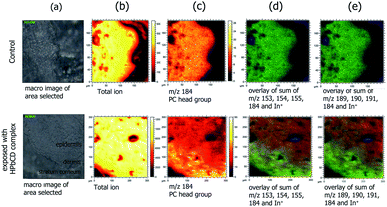
The three-dimensional (3D) TOF-SIMS imaging analysis of the skin tissue sections was also performed by TOF-SIMS V (ION-TOF, Münster, Germany). The 3D imaging data from the HPbCD inclusion complex exposed to skin tissue were based on 50 layers of imaging data (2 scans/1 layer), where layers of the cross-section skin tissue were sequentially removed by C60++ sputtering, creating a 3D volume of ion images. This depth profile analysis generates a visualization of the distribution of detected ions as a function of depth into the sample. Fig. 6 shows the accumulated 3D ion data from the HPbCD inclusion complex treated skin tissue sample as RGB overlay images. The TP4ol signal at m/z 153–155 (Fig. 6b) and the DMPBD signal at m/z 189–191 (Fig. 6c) can be seen in red, with the signal of the phosphatidylcholine (PC) headgroup [C5H15PNO4]+ at m/z 184 in green and the signal of the indium ion from the indium tin oxide (ITO) glass slide in blue. The results clearly show the abundant distribution of TP4ol and DMPBD in the epidermis and also dermis, which is the deepest layer of skin tissue. It could be concluded that TP4ol and DMPBD might also penetrate into the muscle, which is a target for anti-inflammatory activity, and be released from cyclodextrin's cavity.
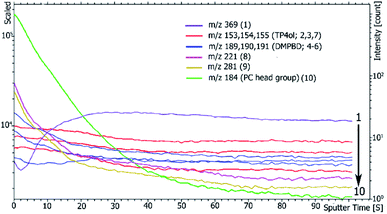
In addition, the depth profiles of the HPbCD inclusion complex exposed to skin tissue is exhibited in Fig. 7 at m/z 153–155 (TP4ol), 184 (PC headgroup), 189–191 (DMPBD), 221 (PI), 281 (oleic acid) and 369 (cholesterol). At m/z 153–155 and 189–191 were steady intensity peaks, which showed a relatively even distribution through the sample, while the trend of the PC headgroup (m/z 184) and cholesterol (m/z 369) were clearly changed. The PC headgroup intensity dramatically decreased, by which it can be concluded that the PC headgroup appeared to be localized to the sample surface due to the vacuum during sample preparation. In contrast, the cholesterol fragment (m/z 369) showed lower intensity at the surface of the skin sample. However, the depth profile of m/z 221 and 281 was similar to that of the PC headgroup; they could be the lipid fragment. Unfortunately, TOF-SIMS is not high-resolution mass spectrometry, which does not allow determination of exact mass to 4 decimal places so we could not confirm each fragment of the compound.
Conclusions
The skin permeation of the inclusion complex was performed by TOF-SIMS imaging and the results showed that TP4ol and DMPBD show distribution in epidermis and dermis layers. These results indicate that these two active components could possibly penetrate closer to the target for the treatment of inflammatory soft tissue injury.Conflicts of interest
There are no conflicts to declare.Acknowledgements
The authors would like to thank the Development and Promotion of Science and Technology Talented Project (DPST), the Institute for Promotion of Teaching Science and Technology (IPST), and the Department of Chemistry, Faculty of Science, Kasetsart University for financial support.Notes and references
- M. Habsah, M. Amran, M. M. Mackeen, N. H. Lajis and H. Kikuzaki, J. Ethnopharmacol., 2000, 72, 403 CrossRef CAS.
- P. Tonglairoum, T. Chuchote, T. Ngawhirunpat, T. Rojanarata and P. Opanasopit, Pharm. Dev. Technol., 2014, 19, 430 CrossRef CAS.
- R. Jeenapongsa, K. Yoovathaworn, K. M. Sriwatanakul and U. Pongprayoon, J. Ethnopharmacol., 2003, 87, 143–148 CrossRef CAS.
- X. Ren, S. Yue, H. Xiang and M. Xie, J. Porous Mater., 2018, 25, 1577 CrossRef CAS.
- J. Suksaeree, C. Monton, F. Madaka, T. Chusut, W. Saingam, W. Pichayakorn and P. Boonme, AAPS PharmSciTech, 2015, 16, 171 CrossRef CAS.
- J. Suksaeree, L. Charoenchai, F. Madaka, C. Monton, A. Sakunpak, T. Charoonratana and W. Pichayakorn, Asian J. Pharm. Sci., 2015, 10, 341–349 CrossRef.
- P. Sunintaboon, K. Pumduang, T. Vongsetskul, P. Pittayanurak, N. Anantachoke, P. Tuchinda and A. Durand, Colloids Surf., A, 2012, 414, 151 CrossRef CAS.
- J. Leelarungrayub, J. Manorsoi and A. Manorsoi, Int. J. Nanomed., 2017, 12, 2469 CrossRef CAS.
- S. H. Pun, N. C. Bellocq, A. Liu, G. Jensen, T. Machemer, E. Quijano, T. Schluep, S. Wen, H. Engler, J. Heidel and M. E. Davis, Bioconjugate Chem., 2004, 15, 831 CrossRef CAS.
- B. Iqbal, J. Ali and S. Baboota, Int. J. Dermatol., 2018, 57, 646 CrossRef.
- N. Zafar, H. Fessi and A. Elaissari, Int. J. Pharm., 2014, 461, 351 CrossRef CAS.
- E. M. M. Del Valle, Cyclodextrins and their uses: a review, Process Biochem., 2004, 39, 1033 CrossRef CAS.
- Y. Yan, J. Xing, W. Xu, G. Zhao, K. Dong, L. Zhang and K. Wang, Int. J. Pharm., 2014, 474, 182 CrossRef CAS.
- V. Thiel and P. Sjovall, Annu. Rev. Earth Planet. Sci., 2011, 39, 125 CrossRef CAS.
- M. D. Pour, E. Jennische, S. Lange and A. G. Ewing, Sci. Rep., 2016, 6, 32797 CrossRef.
- J. Bor and J. S. Fletcher, Int. J. Mass Spectrom., 2019, 437, 77 CrossRef.
- P. Malmberg, T. Karlsson, H. Svensson, M. Lönn, N. Carlsson, A. Sandberg, E. Jennische, A. Osmancevic and A. Holmäng, J. Photochem. Photobiol., B, 2014, 138, 295 CrossRef CAS.
- OECD Test No. 428, Skin Absorption: In Vitro Method, OECD Publishing, Paris, 2004 Search PubMed.
- A. G. Shard, F. M. Green, P. J. Brewer, M. P. Seah and I. S. Gilmore, J. Phys. Chem. B, 2008, 112, 2596 CrossRef CAS.
- R. C. Murphy and P. H. Axelsen, Mass Spectrom. Rev., 2011, 30, 579 CrossRef CAS.
- K. A. Z. Berry, J. A. Hankin, R. M. Barkley, M. Spraggins, R. M. Caprioli and R. C. Murphy, Chem. Rev., 2011, 111, 6491 CrossRef.
- T. Kezutyte, N. Desbenoit, A. Brunelle and V. Briedis, Biointerphases, 2013, 8, 1 CrossRef.
- L. Zheng, C. M. Mcquaw, A. G. Ewing, N. Winograd, T. Pennsyl, V. State, V. Uni, U. V Park and V. Pennsyl, J. Am. Chem. Soc., 2007, 129, 15730 CrossRef CAS.
- M. A. Lampe, A. L. Burlingame, J. Whitney, M. L. Williams, B. E. Brown, E. Roitman and P. M. Elias, J. Lipid Res., 1983, 24, 120 CAS.
Footnote |
| † Electronic supplementary information (ESI) available. See DOI: 10.1039/d0ay02018d |
| This journal is © The Royal Society of Chemistry 2021 |

