Total phosphorus determination in eutrophic tropical river sediments by laser-induced breakdown spectroscopy techniques†
Carla
Pereira de Morais
 ace,
Gustavo
Nicolodelli
 b,
Milene
Corso Mitsuyuki
c,
Kleydson Stênio
Gaioso da Silva
c,
Frederico Fábio
Mauad
d,
Stéphane
Mounier
 e and
Débora
Marcondes Bastos Pereira Milori
*c
aSão Carlos Institute of Chemistry, University of São Paulo, São Carlos, SP, Brazil
bDepartment of Physics, Federal University of Santa Catarina, Florianópolis, SC, Brazil
cEmbrapa Instrumentation, São Carlos, SP, Brazil. E-mail: debora.milori@embrapa.br
dSão Carlos School of Engineering, University of São Paulo, São Carlos, SP, Brazil
eUniversity of Toulon, Aix Marseille University, CNRS/INSU, IRD, MIO Mediterranean Institute of Oceanography, UM 110, CS 60584, Toulon, 83041 Cedex 9, France
First published on 10th December 2020
Abstract
Total phosphorus (TP) in sediments is an important chemical variable in the study of the extent of eutrophication in water bodies. Two methods, based on single pulse (SP) and double pulse (DP) laser-induced breakdown spectroscopy (LIBS), were developed for determining TP in the sediment cores of Brazilian rivers upstream from the Barra Bonita reservoir. TP concentration in the sediments was determined by inductively coupled plasma optical emission spectrometry (ICP OES) on digested samples. Besides, a LIBS system operating in SP and DP modes was used to develop methods for TP quantification in sediment pellets. In LIBS, the most appropriate wavelength to measure P was 214.91 nm. The calibration curves showed correlation coefficients of 0.93 and 0.92 and limits of detection of 709 mg kg−1 and 349 mg kg−1 for SP and DP LIBS, respectively. The two proposed methods were validated and the average percentage errors were 14% and 10% for SP and DP LIBS, respectively. The ICP OES and SP and DP LIBS data showed that the most superficial layers of the Piracicaba River, all the sedimentary layers of the Tietê River, and the confluence region present a high concentration of TP, according to the Brazilian sediment quality criterion. In conclusion, SP and DP LIBS were confirmed as promising alternative tools to traditional analytical methods for monitoring the TP content in the sediments that come from different hydrographic units. The proposed method using DP LIBS proved more sensitive than SP LIBS, but the SP LIBS method demonstrated enough precision for determining TP in eutrophic river sediments.
1. Introduction
The origin of P in sediments can be natural, coming from outside the aquatic system (allochthonous) or from within the system (autochthonous), and anthropogenic.1 Depending on the concentration, P can be harmful to the aquatic system, accelerating the eutrophication process of rivers.2,3 The most severe environmental consequence is the decrease in dissolved oxygen in the water, causing the death of plant and animal species. Also, it changes the taste and smell of water.4Total phosphorus (TP) is an important chemical variable in the study of sediment quality, as it enables the assessment of the nutrient load and the extent of the degree of eutrophication of water bodies. Chemical analysis of sediment cores is used to evaluate the distribution of the elements in depth and correlate the profile obtained with the history of land use and occupation and, consequently, with potential anthropic contributions. These conditions are not always detectable using water variables. The official method for determining TP in sediments is the USEPA 6010C method.5 This method uses inductively coupled plasma optical emission spectrometry (ICP OES) for determination and requires treatment of samples, such as wet decomposition using high volumes of oxidizing mixtures.4,6,7 Thus, it generates considerable amounts of chemical residues, disagreeing with the principles of green chemistry.8
Laser-induced breakdown spectroscopy (LIBS) is an alternative method to overcome the disadvantages associated with sample preparation, as it provides direct analysis, thus eliminating or reducing the use of chemical reagents. Besides, the LIBS technique has other advantages, such as relatively low analysis cost when compared to conventional analytical methods and fast real-time analysis. LIBS is an optical emission spectroscopy technique that uses laser-generated plasma to vaporize, atomize and excite analytes. When the excited species return to a lower energy state, they emit discrete emission lines that are characteristic of each element.9 This emission spectrum contains qualitative and quantitative information on the sample composition.10 Due to the matrix effect, quantitative analysis and increased sensitivity are still analytical challenges to be overcome.11 The double pulse (DP) LIBS approach has demonstrated a significant increase in sensitivity when compared with the single pulse (SP) LIBS.12–14
Although the LIBS technique has shown potential for elementary analysis in marine15,16 and river sediments,17 there is no study on the application of SP and DP LIBS techniques combined with ICP OES to assess the quality of river sediments concerning the TP concentration. This lack of LIBS study in the literature is due to the challenge of constructing calibration models for samples with significant variation in their physical–chemical characteristics, as can be seen in sediments that receive sewage runoff and industrial activities.18 This work aims to develop methods using SP and DP LIBS techniques to assess the quality of river sediments from different hydrographic units, which receive different effluent loads, concerning the TP distribution in different sediment core depths.
2. Experimental
2.1 Collection and preparation of samples
Sediment samples were collected in the Tietê and Piracicaba rivers, from their input compartments in the Barra Bonita reservoir, São Paulo state, Brazil (Fig. 1),19 on the 25th of July of 2017, from three points on the Tietê River, three points on the Piracicaba River, and one point in the confluence region.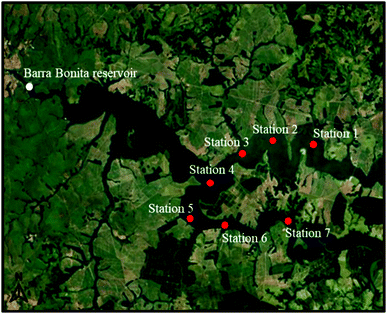 | ||
| Fig. 1 Map with the location of the collection stations of the sediment samples (red dots) and the Barra Bonita reservoir (white dot). | ||
The average water depth upstream of the reservoir is 10.2 m. The sediment cores were taken at different depths using core sampling. The collection points were georeferenced using the Trimble Navigator GPS (Table S1†). Each river belongs to a water resource management unit, with different types of land use and occupation. The Tietê River is the most polluted in Brazil and practically crosses the entire state of São Paulo passing through the metropolitan region of São Paulo City. The Piracicaba River is the largest tributary in terms of the water volume of the Tietê River.20
The transversal slicing was done in different sizes (Table S2†) along the seven cores without removing interstitial water-sediment, totaling 69 sample layers. All samples collected were placed in plastic containers and stored in a thermal box during transport to the laboratory. The samples were freeze-dried (L101, Liotop), ground using a mortar grinder (RM 200, Retsch), and sieved through a 100-mesh sieve. For SP and DP LIBS analyses, an aliquot of 500 mg of each sample was converted into pellets by applying 5 tons of pressure for 1 min in a hydraulic press.
2.2 Emission spectrometry analyses
ICP OES was the reference technique for determining the P concentration for all the samples. It used an iCAP 6000 ICP OES (Thermo Fisher Scientific) with an axial view, radio frequency (RF) generator of 1.55 kW, an echelle polychromator with continuous wavelength coverage in the range of 166.4 nm to 847.0 nm, and a high-performance solid-state detector with a CID86 chip. Argon gas (99.996%, White Martins–Praxair) was used in all the measurements. The P line at 178.2 nm was monitored under optimized plasma operating conditions (Table 1).| Instrument parameter | Operating condition |
|---|---|
| Integration time (s) | 15.0 |
| Sample introduction flow rate (mL min−1) | 1.00 |
| Pump stabilization time (s) | 5 |
| RF applied power (kW) | 1.25 |
| Auxiliary gas flow rate (L min−1) | 0.50 |
| Carrier gas flow rate (L min−1) | 0.50 |
| Plasma gas flow rate (L min−1) | 12 |
| Nebulizer | V-Goove |
| Spray chamber | Cyclonic |
The ICP OES analyses were conducted on digested samples. The decomposition procedure is described below: 200 mg of each homogenized sample was accurately weighed and transferred to perfluoro alkoxy (PFA) decomposition flasks with 10.0 mL of HNO3 (Synth) purified in a sub-boiling distillation system Distillacid™ BSB-939-IR (Berghof, Eningen). Then, this solution was digested using a microwave oven (Speedwave four, Berghof, Eningen) in triplicate. The microwave oven heating program used consisted of (i) 5 min to reach 120 °C, (ii) remained at that temperature for 5 min, (iii) 5 min to reach 175 °C, and (iv) remained at that temperature for 10 min. The maximum temperature of the flasks was approximately 175 °C, and the time for complete digestion was 25 minutes. The tubes were cooled to room temperature in a fume hood. An analytical blank accompanied all procedures. After digesting and cooling, the samples and analytical blanks were transferred to 50.0 mL volumetric flasks, and the volume was completed with deionized water. Subsequently, the digests were diluted 2.5 times with deionized water so that the acid concentration would remain in the equipment's standards. The accuracy of the reference method was evaluated using certified reference materials (CRMs) Montana II Soil (SRM 2711a) and San Joaquin Soil (SRM 2709a).
2.3 LIBS setup
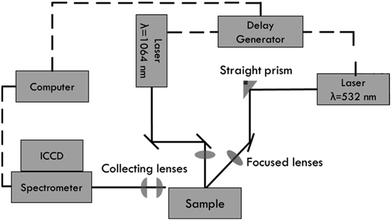
A cross beam double pulse LIBS system was developed to analyze sediments. It was composed of two Nd:YAG pulsed lasers operating at different wavelengths, 1064 nm and 532 nm (Fig. 2). A delay generator pulse was used for the temporal control between the two lasers and the data acquisition system. An echelle spectrometer equipped with an intensified coupled charge device (ICCD) with 1024 × 1024 pixels was used to obtain the spectra. The spectrometer operated in two spectral bands, 175–330 nm and 275–750 nm, with a resolution of 13–24 pm and 29–80 pm, respectively.The laser that emits in 1064 nm (Q-switched Ultra, Quantel) operates at a maximum pulse energy of 50 mJ, a pulse duration of 8 ns, and a repetition rate of 20 Hz. The other one (Brilliant, Quantel) operates at a maximum pulse energy of 180 mJ, a pulse duration of 4 ns, and a repetition rate of 10 Hz. The laser beams were directed to the sample surface using a minimum number of optical components to avoid the loss of power from the lasers. The plasma emission was collected using a telescope system composed of two Si plano-convex spherical lenses. An optical fiber was placed just before the focal point of the telescope to ensure the maximum efficiency of collected light. For optical alignment, the optical fiber was put in XYZ positioning stages, allowing adjustment with a precision of 1 μm.
Sediment samples were analyzed in triplicate using two different LIBS setups. The first setup was the SP LIBS system using the laser at 1064 nm. The laser energy was fixed as 34 mJ, the delay time was at 200 ns, and the acquisition gate width was 20 μs. The second setup was the DP LIBS with a crossed beam configuration. The first pulse was at 532 nm and the second was at 1064 nm. The energy of the infrared laser (1064 nm) was 34 mJ, and the other laser (532 nm) was 35 mJ. The delay time between pulses was 200 ns, the delay time between the last pulse and acquisition was 200 ns, and the acquisition gate width was 5 μs. In both setups, for each sample, 45 spectra were acquired from different regions of the pellet with the accumulation of 10 pulses.
2.4 Data analysis
A simple linear regression was performed between the TP concentration determined by ICP OES and the depth of the sediment core at each collection station to evaluate the P distribution along the sediment core. The spectra obtained with SP and DP LIBS were processed with software developed using the Python programming language. Outliers were excluded using a scalar product between the average and each measured spectrum. The correlation coefficient between the intensity at each wavelength of the spectra and the P concentration determined by ICP OES was calculated. This evaluation helps to identify the best lines for modeling. The analytical calibration was constructed with 70% of the samples and validation with the 30% remaining. The samples from the calibration and validation sets were chosen at random. For the chosen P lines, a baseline correction was done.21 The area under the best wavelength emission line, obtained using the correlation graph, was integrated using the Lorentz function. The average area was calculated for each sample (n = 3). The limit of detection (LOD) was calculated according to Currie.223. Results and discussion
3.1 LIBS
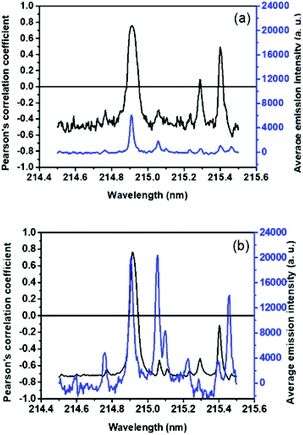
Fig. 3 shows two typical plasma emission spectra from 175 to 341 nm for a sediment sample obtained with the SP (Fig. 3a) and DP (Fig. 3b) LIBS systems.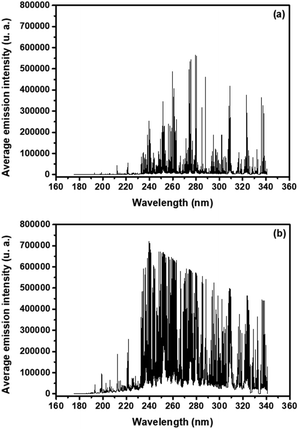 | ||
| Fig. 3 Emission spectrum of a sediment sample, from 175 to 341 nm, obtained with the SP (a) and DP (b) LIBS systems. | ||
The P atomic emission line at 214.91 nm presented the most significant correlation with the reference values for both configurations, 0.75 and 0.76, for non-treated data of SP and DP LIBS, respectively (Fig. 4). The average signal-to-noise (S/N) ratio for PI 214.91 nm was 15.1 and 27.9 for SP and DP LIBS, respectively, so DP LIBS increased the S/N ratio 1.8 times. Thus, the 214.91 nm line was chosen for the construction of the calibration models. Calibration models were constructed for the direct correlation between the peak area fitted by the Lorentz function and reference values obtained with ICP OES (Fig. 5a and b) for SP and DP LIBS. The P analytical calibration curves showed the existence of a strong linear correlation, in which Pearson's correlation coefficients of 0.93 and 0.92 were obtained for SP and DP LIBS, respectively, and a linear working range of 802–5770 mg kg−1 P for both curves. The LOD values of 709 mg kg−1 and 349 mg kg−1 for SP and DP LIBS, respectively, were calculated according to Currie.22 The two proposed methods were validated using the validation set (Fig. 5c and d). In this kind of validation, graphs were constructed using correlation of the P concentration predicted by the calibration models with the P concentration determined by ICP OES.
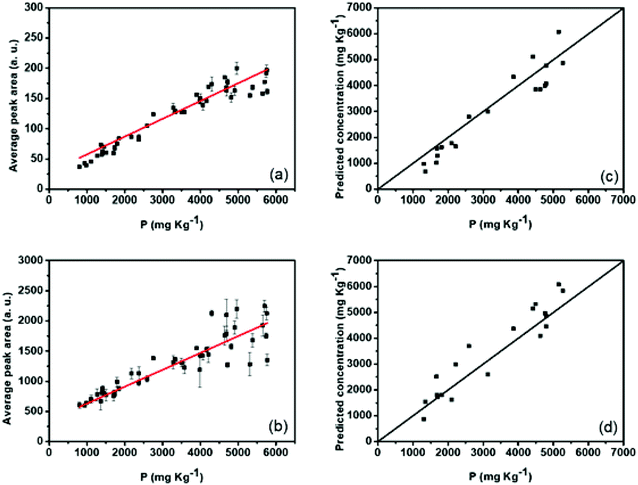 | ||
| Fig. 5 Analytical calibration curves for P determination in sediment samples by (a) SP and (b) DP LIBS and validation curves by (c) SP and (d) DP LIBS. | ||
To better interpret the RMSEC (root mean square error of calibration) and RMSEV (root mean square error of validation) values, the average percentage error was calculated for the calibration and validation sets in both methods. The percentage of average error for the calibration curves was 12% and 11% for SP and DP LIBS, respectively. For the validation curves, it was 14% and 10% for SP and DP LIBS, respectively. The mean errors in the quantification of TP by SP and DP LIBS are acceptable for measurements of samples without preparation,21 and although the matrix effect is common in the LIBS technique,23 the models developed using the PI 214.91 nm line proved to be independent of the matrix and did not present non-linear effects. Additionally, in the chosen emission line, there is no interference from other elements present in the matrix, thus allowing the construction of univariate calibration models for different types of samples.24 The two methods developed for P quantification in river sediments have LODs below the maximum natural level value (750 mg kg−1) defined by Brazilian laws25 and can be used to determine TP replacing ICP OES. The method developed using DP LIBS is more sensitive and present an LOD two times smaller than that of the method using SP LIBS. However, to analyze the trophic level of eutrophic rivers, SP LIBS is sufficient and preferable, because it uses only one laser, therefore, being a cheaper system.
3.2 Phosphorus distribution inside the sediment cores
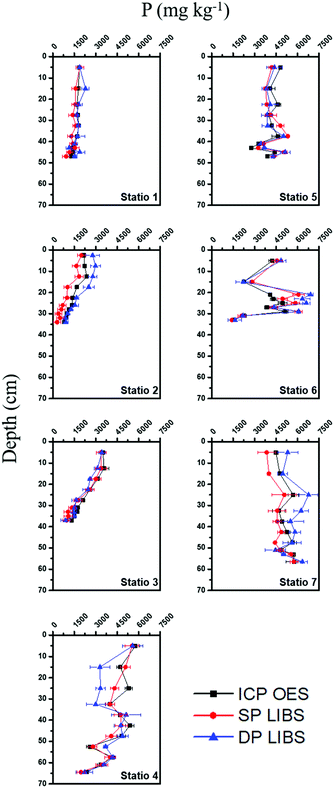
The P concentrations determined by ICP OES and SP and DP LIBS were correlated with the depth of the sediment cores (Fig. 6). The P distribution in the sediment cores according to the developed LIBS methods showed the same behavior in all stations when compared with that of ICP OES. Therefore, both methods are very efficient to assess the degree of eutrophication and to obtain information about the anthropic contributions with regard to the P content in sediment cores.The average concentrations of TP in the sediments of Tietê and Piracicaba rivers are high when compared with those reported in similar studies for eutrophic aquatic ecosystems.26–28 The highest P concentration is at the top of the sediment core of station 4 (5770 mg kg−1), and this result is because the region of confluence between the rivers causes the immobilization of P in the surface sediments.29 The collection points on the Piracicaba River (stations 1, 2, and 3) and the confluence region (station 4) showed a significant decreasing linear trend of P content with depth, with levels in the surface layers being 1846, 2174, 3506, and 5770 mg kg−1 P, respectively. The values for the decrease rates of the P content per centimeter were −14.9, −53.6, −66.4, and −66.7 mg kg−1 cm−1 with the r2 values being 0.87, 0.98, 0.99, and 0.91 for stations 1, 2, 3, and 4, respectively. The increase in the TP content from the bottom to the top of the sediment core indicates that the deposition of P is increasing, and this is due to the intensification of anthropogenic activities in the region.30 Stations 5, 6, and 7, in the Tietê River, do not show a significant linear trend, and their average levels and corresponding standard deviations of P content were 4072 ± 643, 3629 ± 1293, and 5178 ± 498 mg kg−1 P, respectively. The difference in the behavior of the TP distribution along the profile in the Tietê (stations 5, 6, and 7) and Piracicaba rivers (stations 1, 2, and 3) may be linked to the supply and resuspension of P in the sediments. The main sources of P at the sampled points are discharges from domestic sewage, with a large amount of fecal organic matter and detergents, water drained in agricultural areas, and some industrial effluents.31
According to the Brazilian sediment quality criterion concerning the TP content, the deepest sediment layers of the Piracicaba River (stations 1, 2, and 3) have TP levels that impact the water body (TP concentration between 750 and 1500 mg kg−1), and the most superficial layers of the Piracicaba, all the sedimentary layers of the Tietê River (stations 5, 6, and 7), and the confluence region have TP levels that cause a high impact on the water body (TP concentration above 1500 mg kg−1).25 These results indicate that the variability of TP in the vertical distribution is high for the Piracicaba River, while low in the Tietê River. The results presented for the Tietê River corroborate with those observed by Baran et al. in the Dunajec River, where there was no high P variability in the vertical distribution, and this means that the intensely suspended matter transported by these rivers is homogeneous.32
4. Conclusions
SP and DP LIBS techniques proved to be potential tools to determine TP in river sediments. The developed methods show a strong correlation (>0.91) with the reference values, using univariate linear calibration. The method developed using DP LIBS is more sensitive, but the method using SP LIBS also demonstrated enough sensitivity for TP determination in eutrophic river sediments. The methods developed have the potential to be used by agencies responsible for preserving and restoring the quality of aquatic ecosystems by monitoring the TP content in sediments in these environments. Considering a high number of sampled points, the LIBS technique can be implemented, because it eliminates the use of reagents for sample preparation, reduces the time and cost of the analysis, and there is no generation of chemical residues. Therefore, we propose the use of LIBS techniques for monitoring large areas of rivers, in order to help the development of technologies and to avoid the entrance of P in water bodies, for remediation of these ecosystems.In ICP OES and SP and DP LIBS analyses a significant difference can be observed in the TP content of the sediment cores of the Piracicaba and Tietê rivers. The variability of TP in vertical distribution is greater in the Piracicaba River. These results suggest that the intensely suspended matter transported by the Piracicaba River was heterogeneous, while for the Tietê River it was homogeneous.
Conflicts of interest
There are no conflicts to declare.Acknowledgements
This study was financed in part by the Coordenação de Aperfeiçoamento de Pessoal de Nível Superior - Brasil (CAPES) Finance Code 001 grant number (88882.331025/2019-01) for providing a fellowship to Carla Pereira de Morais, FAPESP grant number (2013/07276-1), and Embrapa grant number (21.17.02.001.05.02.003). The authors thank EMBRAPA Southeast Livestock and GAIA for the preparation and analysis of samples by ICP OES, and Bruno Ricardo Silva Costa for making the map with the geographical coordinates.References
- S. M. Thomaz, G. Pereira and T. A. Pagioro, Rev. Bras. Biol., 2001, 61, 277–286 CrossRef CAS.
- A. G. Ebadi and H. Hisoriev, Toxicol. Environ. Chem., 2018, 100, 540–549 CrossRef CAS.
- C. S. Reynolds and P. S. Davies, Biol. Rev., 2001, 76, 27–64 CrossRef CAS.
- N. Młynarczyk, M. Bartoszek, J. Polak and W. W. Sułkowski, Appl. Geochem., 2013, 37, 87–93 CrossRef.
- U. S. Environmental Protection Agency, Method 6010C (SW-846), Inductively Coupled Plasma – Atomic Emission Spectrometry, 2000 Search PubMed.
- T. de S. Pereira, Í. T. A. Moreira, O. M. C. de Oliveira, M. C. Rios, W. A. C. S. Filho, M. de Almeida and G. C. de Carvalho, Mar. Pollut. Bull., 2015, 99, 166–177 CrossRef CAS.
- V. Rosolen, A. B. De-Campos, J. S. Govone and C. Rocha, Catena, 2015, 128, 203–210 CrossRef CAS.
- P. Anastas and N. Eghbali, Chem. Soc. Rev., 2010, 39, 301–312 RSC.
- D. A. Cremers and L. J. Radziemski, Handbook of Laser-Induced Breakdown Spectroscopy, John Wiley & Sons, UK, 2013 Search PubMed.
- G. S. Senesi, L. Martin-Neto, P. R. Villas-Boas, G. Nicolodelli and D. M. B. P. Milori, J. Soils Sediments, 2018, 18, 1292–1302 CrossRef CAS.
- E. C. Ferreira, D. M. B. P. Milori, E. J. Ferreira, L. M. E. Dos Santos, L. Martin-Neto and A. R. D. A. Nogueira, Talanta, 2011, 85, 435–440 CrossRef CAS.
- G. Nicolodelli, G. S. Senesi, R. A. Romano, I. L. De Oliveira Perazzoli and D. M. B. P. Milori, Spectrochim. Acta, Part B, 2015, 111, 23–29 CrossRef CAS.
- C. R. Menegatti, G. Nicolodelli, G. S. Senesi, O. A. da Silva, H. J. I. Filho, P. R. Villas Boas, B. S. Marangoni and D. M. B. P. Milori, Appl. Opt., 2017, 56, 3730–3735 CrossRef CAS.
- G. Nicolodelli, G. S. Senesi, A. C. Ranulfi, B. S. Marangoni, A. Watanabe, V. de Melo Benites, P. P. A. de Oliveira, P. Villas-Boas and D. M. B. P. Milori, Microchem. J., 2017, 133, 272–278 CrossRef CAS.
- R. Barbini, F. Colao, V. Lazic, R. Fantoni, A. Palucci and M. Angelone, Spectrochim. Acta, Part B, 2002, 57, 1203–1218 CrossRef.
- V. Lazic, R. Barbini, F. Colao, R. Fantoni and A. Palucci, Spectrochim. Acta, Part B, 2001, 56, 807–820 CrossRef.
- E. S. Austria, E. M. Fuentes, G. M. Nuesca and R. B. Lamorena, Spectrochim. Acta, Part B, 2017, 136, 1–7 CrossRef CAS.
- F. M. Aprile and M. Bouvy, Braz. J. Aquat. Sci. Technol., 2008, 12, 1–8 CrossRef CAS.
- J. Bramorski and S. M. Villela, Rev. Ciências Ambient., 2014, 8, 61–70 Search PubMed.
- D. I. T. Favaro, F. R. Rocha, M. Angelini, H. R. A. Henriques, J. S. Soares, P. S. C. Silva and S. M. B. Oliveira, J. Radioanal. Nucl. Chem., 2018, 316, 805–818 CrossRef CAS.
- B. S. Marangoni, K. S. G. Silva, G. Nicolodelli, G. S. Senesi, J. S. Cabral, P. R. Villas-Boas, C. S. Silva, P. C. Teixeira, A. R. A. Nogueira, V. M. Benites and D. M. B. P. Milori, Anal. Methods, 2016, 8, 78–82 RSC.
- L. A. Currie, Anal. Chim. Acta, 1999, 391, 105–126 CrossRef CAS.
- J. Hou, L. Zhang, Y. Zhao, Z. Wang, Y. Zhang, W. Ma, L. Dong, W. Yin, L. Xiao and S. Jia, Plasma Sci. Technol., 2019, 21, 034016 CrossRef CAS.
- A. Lima, T. Varão, F. Schiavon, I. De Sousa, G. Saverio, D. Santos, E. Cristina, J. Anchieta and G. Neto, Microchem. J., 2018, 139, 322–326 CrossRef.
- CETESB, https://cetesb.sp.gov.br/aguas-interiores/wp-content/uploads/sites/12/2018/06/Relat%C3%B3rio-de-Qualidade-das-%C3%81guas-Interiores-no-Estado-de-S%C3%A3o-Paulo-2017.pdf, accessed September 2018.
- S. K. Barik, S. Bramha, T. K. Bastia, D. Behera, P. K. Mohanty and P. Rath, Int. J. Sediment Res., 2019, 34, 251–261 CrossRef.
- S. Wen, H. Wang, T. Wu, J. Yang, X. Jiang and J. Zhong, Sci. Total Environ., 2020, 704, 1–10 CrossRef.
- S. Chen, Y. Chen, J. Liu, J. Zhang and A. Wu, Procedia Environ. Sci., 2011, 10, 1797–1801 CrossRef CAS.
- S. Yuan, H. Tang, Y. Xiao, Y. Xia, C. Melching and Z. Li, J. Hydrol., 2019, 573, 568–580 CrossRef CAS.
- C. M. Lupinacci, F. T. da Conceição, A. L. Heck Simon and A. Perez Filho, Earth Surf. Processes Landforms, 2017, 42, 2402–2413 CrossRef.
- W. S. Smith, E. L. G. Espíndola and O. Rocha, Acta Limnol. Bras., 2014, 26, 73–88 CrossRef.
- A. Baran, M. Tarnawski, T. Koniarz and M. Szara, Environ. Geochem. Health, 2019, 41, 2929–2948 CrossRef CAS.
Footnote |
| † Electronic supplementary information (ESI) available. See DOI: 10.1039/d0ay02008g |
| This journal is © The Royal Society of Chemistry 2021 |

