
Colorimetric detection of ciprofloxacin in aqueous solution based on an unmodified aptamer and the aggregation of gold nanoparticles
Weiwen
Huang
 ,
Yichen
Wang
,
Lumei
Wang
*,
Chaoqiang
Pan
and
Guoqing
Shen
,
Yichen
Wang
,
Lumei
Wang
*,
Chaoqiang
Pan
and
Guoqing
Shen
School of Agriculture and Biology, Shanghai Jiao Tong University, Shanghai, 200240, China. E-mail: zjuwlm@163.com; Fax: +86-21-34206922; Tel: +86-21-34206924
First published on 27th November 2020
Abstract
A colorimetric method is described for detection of the antibiotic ciprofloxacin (CIP) in aqueous solutions based on an unmodified CIP-aptamer and gold nanoparticles (AuNPs), which are regarded as a probe and an indicator, respectively. In the absence of CIP, aptamers can hybridize with poly dimethyl diallyl ammonium chloride (PDDA) to form a ‘duplex’ structure through electrostatic interactions, and AuNPs remain dispersed in solution, leading to a red solution and an obvious absorption peak at 520 nm. Contrarily, the CIP-aptamer can specifically bind to CIP after the introduction of CIP into the solution. Then PDDA is thus free to aggregate AuNPs. The solution turns blue from red accordingly, presenting a strong absorption at 650 nm. Hence, the concentration of CIP can be quantified through the changes of the absorption. This sensitive and selective colorimetric method for CIP detection has a good linear response (R = 0.9935) in the 20 to 300 nM CIP concentration range, with a limit of detection (LOD) of 0.215 nM. Importantly, the proposed aptasensor demonstrates great application potential in CIP determination in aqueous samples.
Introduction
Ciprofloxacin (CIP), one of the most typical fluoroquinolone antibiotics (FQs), is produced and consumed in both human and veterinary medicine.1 As a common synthetic antibiotic, CIP is active against a broad spectrum of Gram-negative and Gram-positive bacteria.2 With the abuse of antibiotics, CIP especially is heavily used in Europe.3 For example, Germany's annual consumption of CIP was 33 tonnes4 in 2009. Because most of the CIP in humans is excreted via urine, CIP enters the environment by sewage released from sewage treatment plants, pharmaceutical industries, livestock activities and agricultural wastewater.5 Meanwhile, the biodegradation and transformation of CIP in the aqueous system are difficult,6 causing the residue of CIP in the environment to be at a high level.7 Research shows that the concentration of CIP detected in U.S. surface waters is up to 0.36 μg L−1,8 while that in hospital emergency unit effluents varies from 32 to 99 μg L−1.9 Zhao10 found that the average concentrations of CIP were 86.8 μg L−1 in the surface water around the farms selected randomly from Chongming Island in Shanghai, China. Due to high residues of CIP in the environment and toxic effects11 on human beings, animals, plants and bacteria,12 the European Union and many countries have already established relative standards for the maximum residue limits (MRLs) of CIP in environmental water.13 Hence, considering CIP's potential risk to the environment and humans, it is essential to determine and analyze CIP in the environment.Developed methods are applied to detect and qualify the concentrations of CIP, such as high performance liquid chromatography (HPLC)14 or HPLC combined with other instruments,15,16 electrochemical methods,17,18 nanocomposite optosensors,19 fluorimetry methods,20,21 and enzyme-linked immunosorbent assay (ELISA),22 as shown in Table 1. It is undeniable that these analytical methods for CIP have high sensitivity and a low limit of detection (LOD). However, these methods have inherent limitations23 that cannot be ignored, such as high cost, expensive instrumentation, complicated pretreatment, and cross reactivity with analogues.24 Therefore, to overcome the above weak points, inexpensive, easy, valid, point of use detection methods for CIP in the environment are highly required.
| Method | LOD (nM) | Linear range (nM) | Sample | Reference |
|---|---|---|---|---|
| a HPLC: high performance liquid chromatography; COOH@MWCNT-MIP-QD optosensor: nanocomposite optosensor consisting of carboxylic acid functionalized multiwall carbon nanotubes and CdTe quantum dots embedded inside a molecularly imprinted polymer. ELISA: enzyme-linked immunosorbent assay. | ||||
| HPLC | 30.180 | 30.180–24![[thin space (1/6-em)]](https://www.rsc.org/images/entities/char_2009.gif) 144 144 |
Serum | 14 |
| HPLC with fluorescence detection | 6.036 | 6.036–300 | Bovine milk | 15 |
| HPLC with ultraviolet detection | 45.269 | 45.269–5432 | Human plasma | 16 |
| Electrochemical detection with a porous nafion/multiwalled carbon nanotube composite film electrode | 5.000 | 5–50 | Water | 17 |
| Electrochemical detection at screen printed diamond electrodes | 58.800 | 1.0 × 10³–3.0 × 10⁶ | Human plasma | 18 |
| COOH@MWCNT-MIP-QDs optosensor | 0.199 | 0.302–3.02 | Milk | 19 |
| 3.02–3020 | ||||
| Terbium sensitized fluorescence | 1.200 | 50–10000 |
Serum | 20 |
| Fluorimetry based on functionalized CdS | 23.100 | 377–2640 | Water | 21 |
| 2640–362500 | ||||
| ELISA | 0.604 | 1–446 | Beef | 22 |
| Colorimetric aptasensor based on AuNPs | 0.215 | 20–300 | Water | This assay |
First reported in 1990,25 aptamers are short, single-stranded oligonucleotides (DNA or RNA) that can be selected by a vitro process called systematic evolution of ligands by exponential enrichment (SELEX).26 They can bind to target molecules with high affinity and specificity. By folding into tertiary structures,27 aptamers can form a binding pocket, and then can strongly bind to targets including small organic molecules, proteins, pathogens, metal ions, through hydrogen bonds, electrostatic and hydrophobic interactions.28 In addition to binding to targets of interest similar to antibodies, aptamers also present many advantages, such as short detection time, low generation cost, high modifiability, good thermal stability, long-term storage and a wide range of targets.29 Hence, aptamers show great promising potential in monitoring environment pollutants such as CIP and other antibiotics to ensure environment equality and human health.
With the high affinity CIP-aptamer selected in 2016,30 electrochemical31,32 detection methods based on it for CIP have been developed with a detection limit of 1.2 nM and 0.263 nM, respectively. These electrochemical methods are highly selective and sensitive. However, the progress of modification of aptamers and immobilization of electrodes increases the cost and steps of the detection procedure, which cannot realize low-cost and time-saving determination. Colorimetry methods are most commonly applied in detection due to their convenience. As basic building blocks and signaling elements,33 gold nanoparticles (AuNPs) are significant materials in colorimetric aptasensors,34,35 with their controlled geometrical, optical, and surface chemical properties.36 The principle of colorimetry is based on the aggregation behaviors of AuNPs. Generally, low-diameter AuNPs are dispersed homogeneously in solution presenting a red color with a strong absorption at 520 nm. After the addition of cationic polymers, AuNPs tend to aggregate and become larger in size, and the solution will change from red to blue gradually, leading to a significant shift of the absorption peak to a long wavelength (650 nm).37 The aggregation degree of AuNPs can be obtained by measuring the changes of absorption at 520 nm (dispersed state) and 650 nm (aggregated state) for qualitative and quantitative analysis. On the basis of this mechanism, Zhan38 developed a colorimetric detection for arsenic(III) using unmodified aptamers and the aggregation of AuNPs induced by NaCl, and Zhang35 reported a PDDA-induced aggregation of the AuNP method based on aptamers to detect 17β-estradiol. Meanwhile, detection methods for FQs based on the mechanism have been built.39–41 Zhou41 developed a colorimetric method for ofloxacin (OFL) using unmodified aptamers and the aggregation of AuNPs with a LOD of 3.4 nM and a linear response in the 20 to 400 nM range. These studies make it possible for colorimetric methods to detect CIP by using aptamers, AuNPs and PDDA.
In this research, a simple, rapid and valid PDDA–induced colorimetric detection method for CIP was established on the basis of an unmodified CIP-aptamer, AuNPs, and PDDA. In this detection system, AuNPs were employed as a signal indicator. Under a certain condition, the degree of its aggregation was proportional to the CIP concentration, enabling qualitative and quantitative analysis of CIP via visual observation or measurement by using an instrument, respectively. Finally, the sensitivity, selectivity and practicality of this method were also investigated.
Materials and methods
Reagents and chemicals
The sequence of CIP–aptamer30 is 5′-ATACCAGCTTATTCAATT-GCAGGGTATCTGAGGCTTGATCTACTAAATGTCGTGGGGCATTGCTATTGGCGTTGATACGTACAATCGTAATCAGTTAG-3′ synthesized by Sangon Biotechnology Inc. (Shanghai, China). Ciprofloxacin (CIP), kanamycin (KAN), levofloxacin tablets (LVX), tetracycline hydrochloride (TET), enrofloxacin (ENR), penicillin (PCN), progesterone prog (P4), glycine (Gly), arginine (Arg), phenylalanine (Phe), and 7-aminocephalosporanic acid (7-ACA) were bought from Aladdin Biotechnology Inc. (Shanghai, China). Cadmium chloride (CdCl2), lead(II) nitrate (PbNO3), mercury(II) sulfate (HgSO4), glacial acetic acid (CH3COOH), trisodium citrate dihydrate (Na3C6H5O7·2H2O), chloroauric acid (HAuCl4·4H2O), and 3-(N-morpholino) propanesulfonic acid (MOPS 10 mM, pH 7.0) were purchased from Sinopharm Chemical Reagent Co., Ltd. (Shanghai, China.) Poly dimethyl diallyl ammonium chloride (PDDA) was obtained from Sigma-Aldrich (St. Louis, MO, USA). Artificial urine was purchased from the website (www.biomart.cn). The centrifuge tubes were purchased from Thermo Fisher Scientific Inc. (Nunclon, Denmark). Unless otherwise mentioned, all reagents were of analytical grade and were used without further purification or treatment. Deionized water used in this experiment was prepared by using a Milli-Q Advantage A10 System (Millipore, Bedford, MA, USA).Apparatus
An Infinite M200 Pro microplate spectrophotometer (Tecan Austria GmbH, Salzburg, Austria) was employed to measure the absorbance values from 400 to 800 nm, and the absorbance values at 520 nm (A520) and 650 nm (A650) were recorded. Circular dichroism spectroscopy (CD; J-815, Jasco, Japan) was used to characterize the structural changes of the CIP–aptamer. Transmission electron microscopy (TEM) (JEM2010HT, Hitachi, Japan) was applied to observe the morphological changes of AuNPs. A Zetasizer Nano S (Malvern, England) was used to measure the average diameter of AuNPs. The incubation temperature was maintained at 25 °C by using a thermostatic incubating device (Eppendorf, China).Preparation and characterization of AuNPs
According to previous studies,42 AuNPs were synthesized by sodium citrate reduction of HAuCl4·4H2O. First, all the glassware used in the experiment was cleaned using freshly prepared 1:3 (v/v) HNO3/HCl solution, then was washed with ultrapure water completely and dried in air. Then, AuNPs were synthesized by adding rapidly 10.5 mL of 1% (w/v) trisodium citrate to the boiling solution of HAuCl4 (100 mL, 0.03%, w/w), followed by stirring for 30 min. Subsequently, the heater of the device was turned off, while the solution was kept stirring until the color turned wine-red steadily. Finally, the wine-red solution was cooled down to room temperature and filtered with a 0.22 μm ultrafiltration membrane, then stored in a dark glass bottle at 4 °C for further use.
Interactions among AuNPs, CIP, aptamers, and PDDA
The circular dichroism (CD) spectra of three samples were measured to characterize the conformational changes of the aptamer interacting with CIP: (a) 200 nM aptamer; (b) 200 nM aptamer +10 μM CIP; (c) 200 nM aptamer +100 μM CIP. Sample (a) was directly measured, while sample(b) and sample(c) were measured after a 20 min incubation. The volume of each sample was 500 μL. Analytical transmission electron microscopy (TEM) and a Zetasizer Nano S were employed to investigate the aggregation degree and average diameter of AuNPs in samples: (a) AuNPs + 6 nM aptamer + 20 nM PDDA; (b) AuNPs+ 6 nM aptamer +20 nM PDDA + 200 nM CIP; (c) AuNPs+ 6 nM aptamer + 20 nM PDDA + 2000 nM CIP.Measurement of the absorbance
An Infinite M200 Pro microplate spectrophotometer was applied to measure the absorbance values with a volume of 200 μL on the microplate. The absorbances at 520 nm (A520) and 650 nm (A650) indicating the relative content of dispersed and aggregated AuNPs were recorded. A is used for representing the aggregation degree of AuNPs in samples, which can be estimated using A650/A520. A was the absorbance of samples containing CIP, while A0 was assigned to that of the blank (samples without CIP). Thus, ΔA was obtained by ΔA = A − A0.Optimization of experimental conditions
To improve performance in sensitivity and selectivity of the detection system, the experimental conditions including concentration of PDDA, concentration of the aptamer, temperature of incubation, and pH of MOPS buffer were optimized. Each set of experiments consisted of three parallel experiments and was repeated at least three times.For optimization of the concentration of PDDA, a certain volume of MOPS buffer was added to a 1.5 mL centrifuge tube at 25 °C, followed by introduction of 500 nM PDDA with different volumes (0, 5, 10, 15, 18, 20, 22, 25, and 30 μL). Finally, 100 μL AuNPs were added to the tubes, and the total volume was set as 500 μL. After a 20 min incubation, the values A650 and A520 were recorded and the value A = A650/A520 was calculated subsequently, when A reached the maximum, the corresponding concentration of PDDA was adopted as the optimal.
The concentration of the aptamer is critical to the whole progress of the experiment. To obtain the optimized concentration, increasing volumes of the aptamer were added to the centrifuge tubes containing certain volume of MOPS as well as a suitable CIP solution (the blank without CIP). After 20 min incubation at 25 °C, optimized concentration of PDDA was added and continued to be incubated for 20 min, followed by 100 μL of AuNPs. The concentration was chosen which induced the maximum value of ΔA.
The same as the above, the temperature of incubation and the pH of MOPS buffer were also optimized, under the optimal conditions acquired. A, A0 and ΔA were obtained respectively, and then appropriate factors that led to the maximum ΔA value were selected.
Sensitivity and selectivity
Sensitivity is a considerable parameter for evaluation of the detection platform. The CIP-aptamer with optimal concentration and MOPS were first added into 1.5 mL centrifugation tubes, then increasing concentrations (0.1, 0.2, 0.3, 0.4, 1, 2, 5, 8, 10, 15, 20, 25, 30, 40, and 50 μM) of 10 μL CIP solutions were introduced into the system before an incubation of 20 min at 25 °C. Secondly, an optimal concentration of PDDA was added into the tubes, thoroughly mixed, and incubated for 20 min. Thirdly, 100 μL AuNPs were added in the system for 20 min incubation after mixing completely. Finally, A and A0 were obtained and ΔA was calculated to draw the sensitive curve.Selectivity is another vital index to the detection platform. To study the selectivity of the detection system, several kinds of interferents, including kanamycin (KAN), levofloxacin tablets (LVX), tetracycline hydrochloride (TET), enrofloxacin (ENR), penicillin (PCN), progesterone prog (P4), glycine (Gly), arginine (Arg), phenylalanine (Phe), Cd2+, Pb2+, Hg2+, and 7-aminocephalosporanic acid (7-ACA), were added to the system instead of CIP used as targets to evaluate the selectivity of the analytical method.
Application in water samples
Two types of aqueous samples including tap water and river water, were used in this experiment to investigate the practical performance of the detection method. To explore whether the method can be adapted to more complex matrices, a spiked recovery experiment in artificial urine was also carried out. Tap water and river water were acquired from Shanghai Jiao Tong University (Shanghai, China). The tap water was used without any pretreatment, while river water and artificial urine were first centrifuged at 12000 rpm for 5 min and then filtered with a 0.45 μm filter membrane, and the supernatant was collected for the test finally. The testing data of these water samples were obtained via the proposed method. At least three replicates were performed for each sample.
Results and discussion
Principle of the assay
Absorption spectra of AuNPs under different conditions are depicted in Fig. 1A. In the spectrum of CIP, the system has a strong absorption at 520 nm. After the introduction of CIP, the absorption peak of the system shifts towards longer wavelengths significantly (650 nm). The principle of the colorimetric detection of CIP based on the aptamer, AuNPs, and PDDA is shown in Scheme 1. Generally, AuNPs are aggregated by the interaction between the negative charge of AuNPs and the positive charge of PDDA. If aptamers exist, however, they can hybridize with PDDA to form a ‘duplex’ structure through electrostatic interactions.43 Thus, AuNPs can stay homogeneous instead of aggregating. The solution presents a red color with a strong absorption at 520 nm [Fig. 1A (a)], which generates a low A650/A520 ratio. In the presence of CIP, aptamers can specifically recognize the signal of CIP and strongly bind to it by forming complexes.44 With the consumption of aptamers, AuNPs start to aggregate induced by PDDA. The color of solution turns blue accordingly and the absorption peak shifts to 650 nm [Fig. 1A (c)], resulting in a high A650/A520 ratio. Hence, the value of A650/A520 can be utilized for quantitative analysis of CIP based on the aggregation status of AuNPs. And rapid determination of CIP can be achieved by the color change of solution.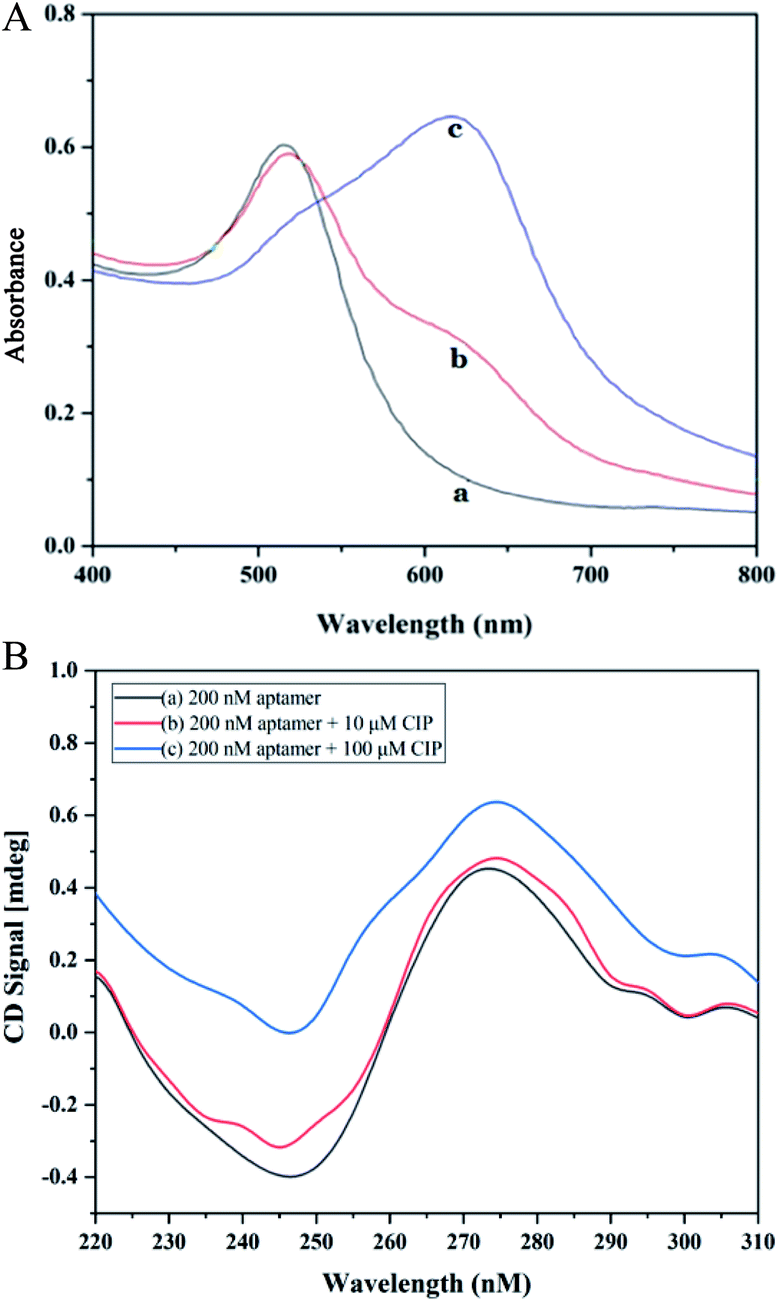 | ||
| Fig. 1 (A) Absorption spectra of AuNPs under different conditions: (a) AuNPs + 6 nM aptamer + 20 nM PDDA; (b) AuNPs + 6 nM aptamer + 20 nM PDDA + 20 nM CIP; (c) AuNPs+ 6 nM aptamer + 20 nM PDDA + 2000 nM CIP. (B) Circular dichrosim (CD) spectra of aptamer treated with CIP under different conditions: (a) 200 nM aptamer; (b) 200 nM aptamer + 10 μM CIP; (c) 200 nM aptamer + 100 μM CIP. | ||
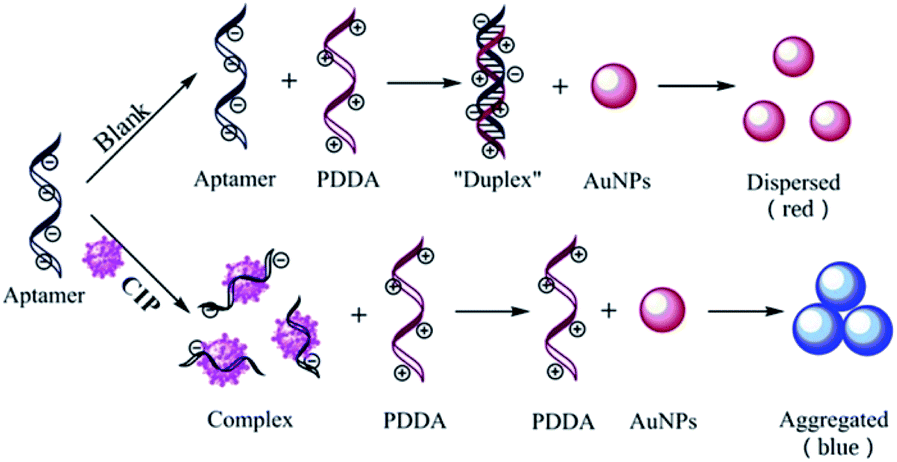 | ||
| Scheme 1 Schematic representation of the colorimetric detection of ciprofloxacin based on the CIP-aptamer, cationic polymer PDDA and AuNPs. | ||
Characterization of the interactions among aptamers, CIP and AuNPs
The CD spectrum was employed as an effective tool to characterize conformation changes of DNA as a result of interaction between aptamers and CIP. As revealed in Fig. 1B, in the absence of CIP, aptamers have a negative peak at 240–260 nm and a positive peak at 270–290 nm, which is consistent with the B-DNA structure.45 With the addition of CIP, the CD signal curve changes accordingly. In the presence of low CIP concentration, the negative peak decreases mildly and the positive peak remains almost the same. When aptamers are exposed to a high concentration of CIP, both negative and positive peaks vary significantly due to base stacking of DNA. This signifies the integration of the CIP-aptamer on the basis of the π–π* and the n/π* transitions, indicating the conformation switch of aptamers. Herein, it can be summarized that the aptamer-CIP complex is formed, confirming the feasibility of this method.The principle was further verified by TEM and DLS to evaluate the aggregation degree and average diameter of AuNPs under different experimental conditions. In Fig. 2, DLS images and TEM images of three aggregation degrees of AuNPs under different experimental conditions are presented. (a) In the absence of CIP, PDDA is consumed because of hybridization with aptamers, so AuNPs have a spherical shape and clear dispersion. The average diameter of AuNPs is 22 nm. (b) With a low concentration of CIP, aptamers can specifically recognize CIP and strongly bind to it. Because PDDA cannot fully hybridize with aptamers, AuNPs are induced to partially aggregate by the excess PDDA and become larger in size (Fig. 2A (b), the average diameter of AuNPs is 88 nm). (c) Along with the introduction of a high concentration of CIP, all the aptamers are exhausted for sufficient interaction with CIP. At the same time, AuNPs gather into a larger cluster as more PDDA is free in the system. The average diameter of AuNPs increases to 1600 nm as depicted in Fig. 2A (c). This phenomenon is consistent with the above bathochromic shift of the absorption spectrum. The optical properties of the sensing system are diametrically determined by the concentration of PDDA, which is affected by the amount of CIP added into the system. Therefore, this colorimetric detection method for CIP based on the aptamer, AuNPs and PDDA is proved to be feasible. According to Lambert–Beer's Law, the concentration of AuNPs can be calculated.46 The formula c = A450/ε450 can be employed to calculate the particle concentration c in mol per liter from the absorption A at 450 nm (A450) for a standard path length l of 1 cm, where ε450 is molar decadic extinction coefficient (ε) at λ = 450 nm. In this case, ε450 of 22 nm AuNPs is 7.31 × 10⁸ L moL−1 cm−1 and A450 is 0.4485. Hence, the concentration of AuNPs is calculated to be 2.79 × 10⁻⁴ M.
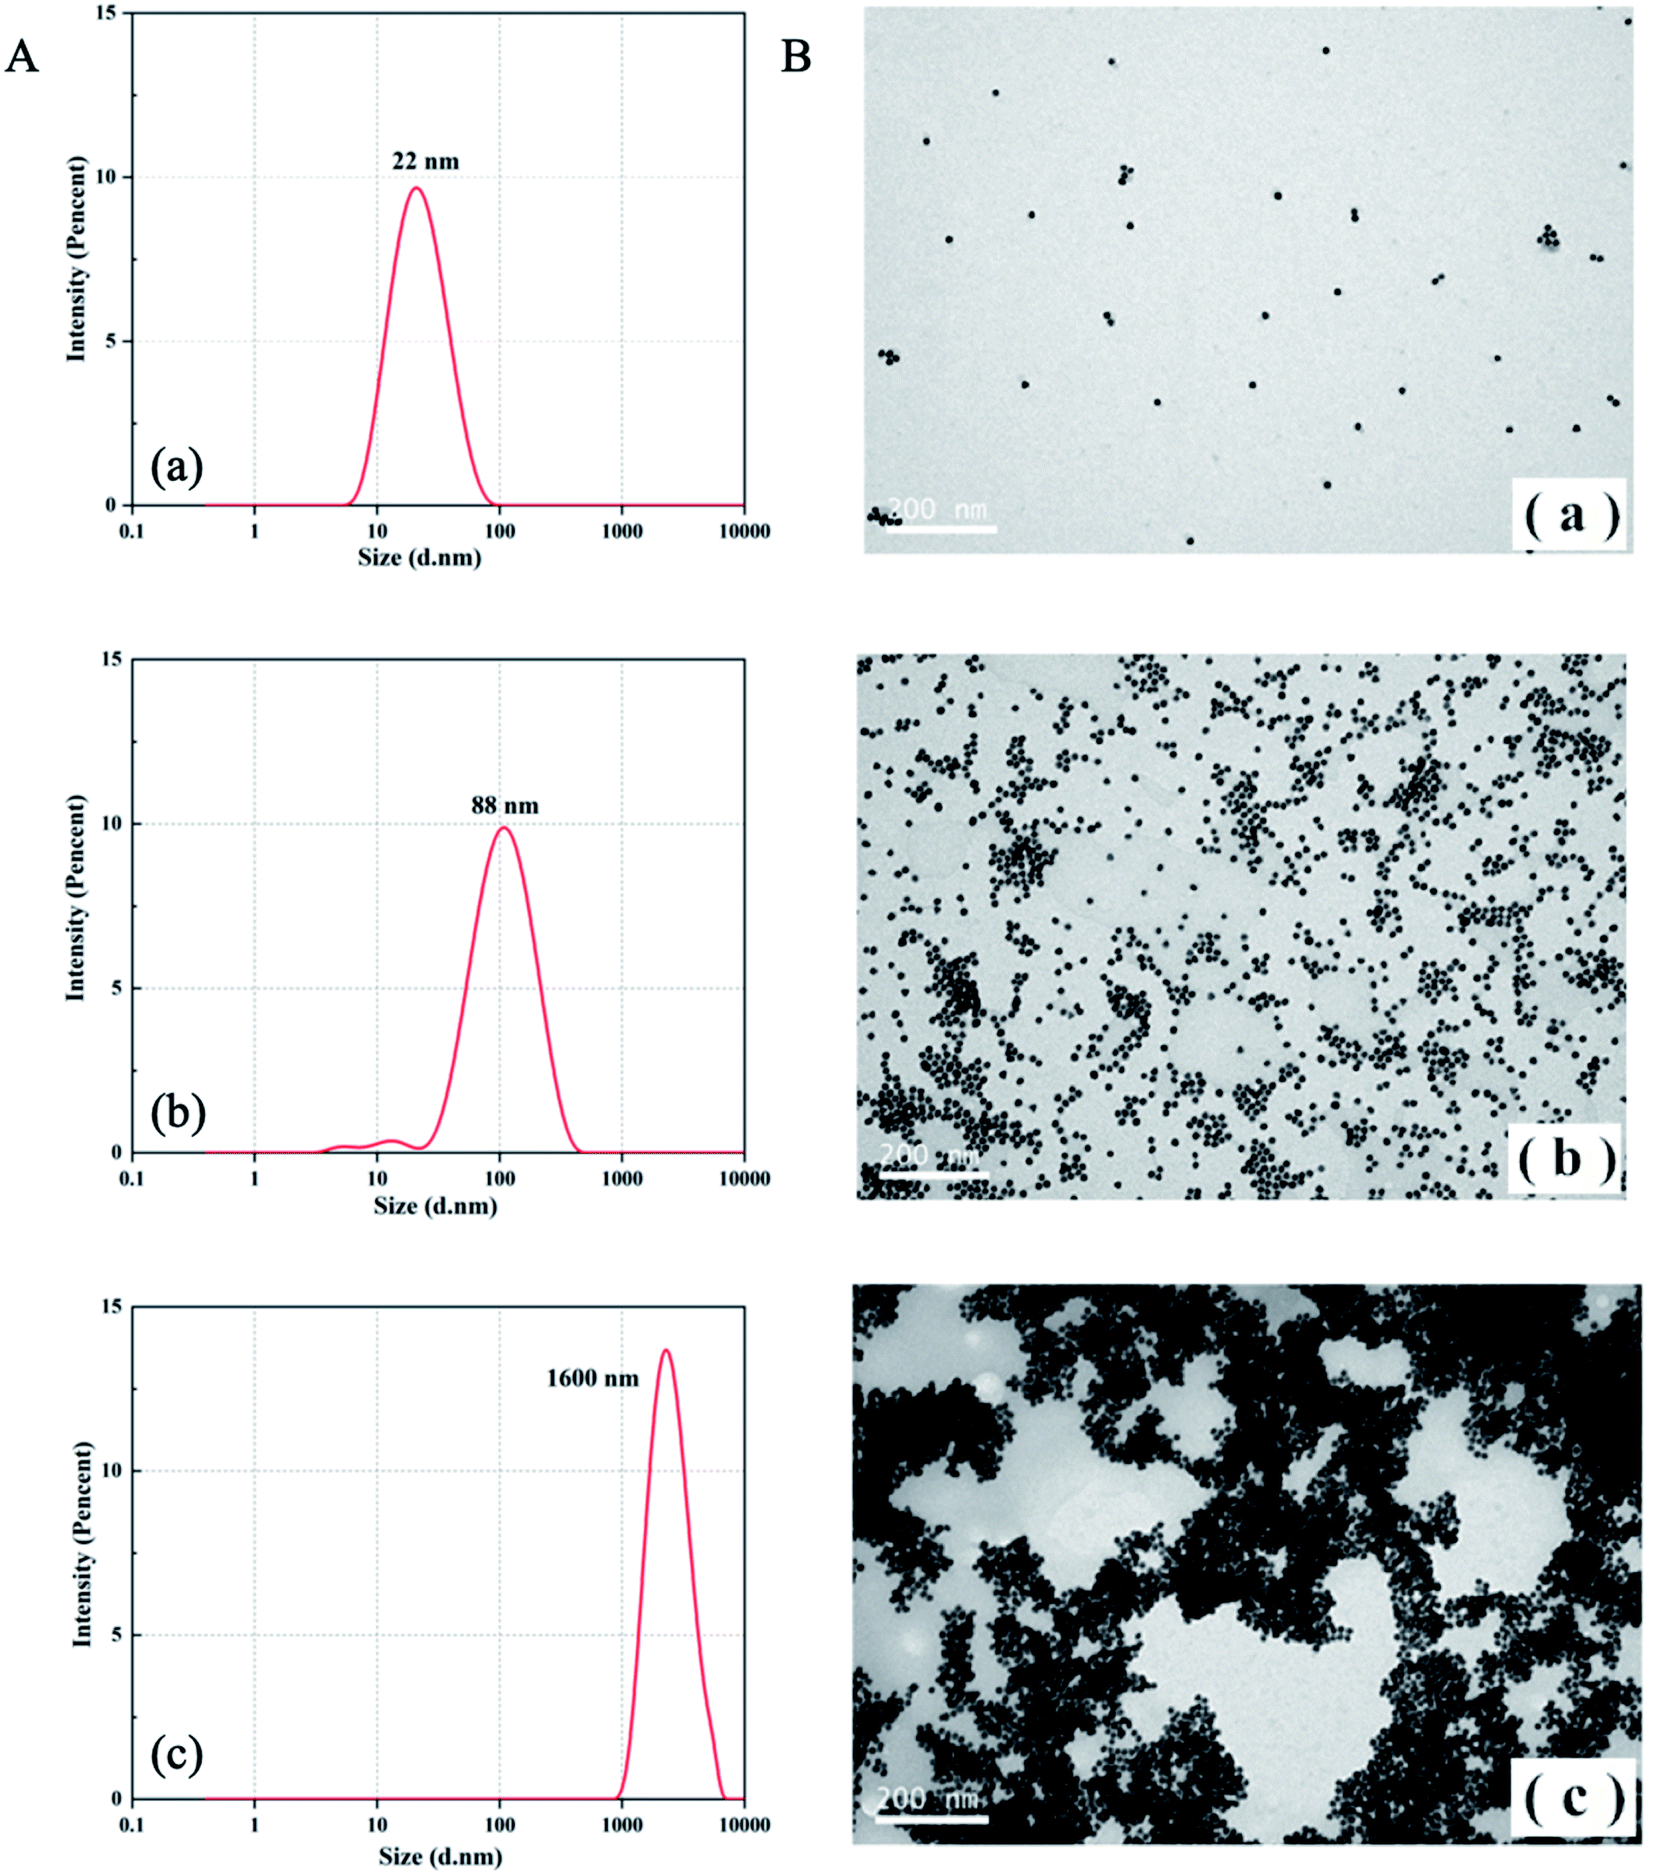 | ||
| Fig. 2 Dynamic light scattering (DLS) images (A) and transmission electron microscope (TEM) images (B) of the AuNP solutions under different conditions: (a) AuNPs + 6 nM aptamer + 20 nM PDDA; (b) AuNPs + 6 nM aptamer + 20 nM PDDA + 200 nM CIP; (c) AuNPs+ 6 nM aptamer + 20 nM PDDA + 2000 nM CIP. | ||
Optimization of experimental conditions
Optimization of experiment factors including concentration of PDDA, concentration of the aptamer, temperature of incubation, and pH of MOPS buffer, are crucial for the detection of CIP. Thus, the following optimizations of these factors were performed respectively: (i) concentration of PDDA, (ii) concentration of the CIP-aptamer, (iii) temperature of incubation, and (iv) pH of MOPS buffer. As shown in Fig. 3, conclusions of optimization are below: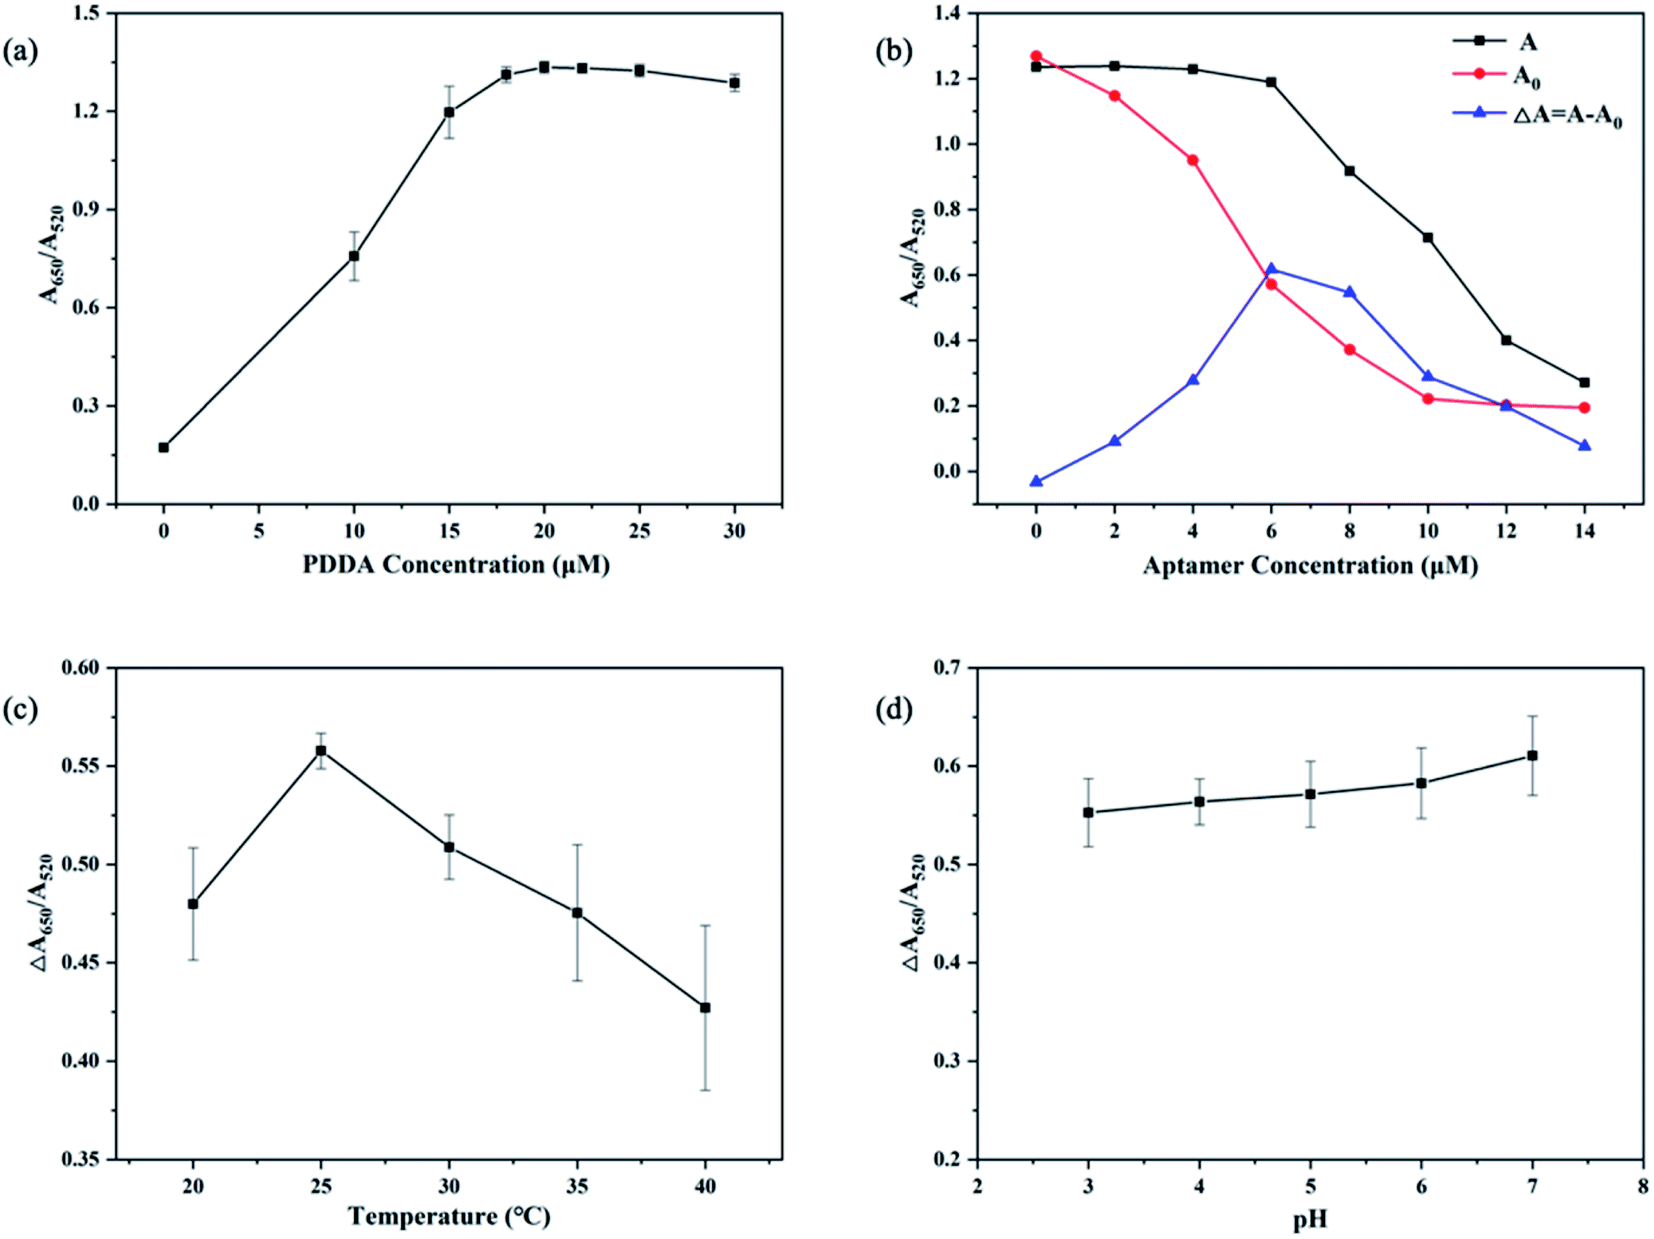 | ||
| Fig. 3 Optimization of experimental conditions. (a) Optimization of PDDA concentration; (b) optimization of aptamer concentration. (c) Optimization of temperature; (d) optimization of pH. | ||
(i) Optimized concentration of PDDA. Fig. 3a indicates that the trend of ΔA650/A520 is influenced by the concentration of PDDA. When the concentration of PDDA is 20 nM, the value of A650/A520 reaches the maximum, and after that the value does not increase obviously with the increasing amount of PDDA for the reason that aggregation of AuNPs is saturated. And this phenomenon is consistent with changes of color in solution. Herein, the optimal concentration of PDDA is 20 nM.
(ii) Optimized concentration of the aptamer. As shown in Fig. 3b, ΔA650/A520 reaches the maximum value with the aptamer concentration of 6 nM, and the value is no longer increasing but decreasing with more of the aptamer added. Hence, 6 nM is chosen as the optimal aptamer concentration.
(iii) Optimized temperature. The temperature of the reaction affects the activity of the aptamer and its ability to specifically bind to a target. As revealed in Fig. 3c, the value of ΔA650/A520 reaches the maximum at the temperature of 25 °C, and gradually decreases with higher temperatures for the reason that ascending temperatures may damage the properties of elements in the system. Therefore, 25 °C is the optimized temperature.
(iv) Optimized pH. As demonstrated in Fig. 3d, pH has no particular effect on the value of ΔA650/A520. In consideration of the variability of pH in environmental water samples and the activity of aptamers, pH of 7 is selected as the optimal pH.
Sensitivity of the aptasensor for CIP detection
To investigate the sensitivity of the detection system, values of ΔA650/A520 were measured and recorded varying from 0.1–1200 nM concentration of CIP, under optimal experimental conditions. As revealed in Fig. 4, the value of ΔA650/A520 increases gradually with increasing concentration of CIP for the reason that more and more aptamers combine with CIP and excess PDDA induces AuNPs to aggregate. This phenomenon can be observed directly by the color change of solution from red to blue. When the concentration of CIP exceeds 300 nm, the value of ΔA650/A520 no longer increases because aptamers completely interact with CIP. The curve demonstrates the linear responses at low CIP concentrations of 5 repetitions, and the ΔA values at low CIP concentrations (20–300 nM) were fitted to a linear plot with a regression equation of ΔA = 0.00283CCIP + 0.00721 (the linear correlation coefficient R = 0.9935). On the basis of previous research,47 3σ/s is applied to calculate the limit of detection (LOD). σ is the instrument standard deviation obtained by measuring the blank sample containing 400 μL MOPS buffer and 100 μL AuNPs for an eight-time repetition, and s is the slope of the linear equation. Therefore, the LOD of this detection system is calculated to be 0.215 nM (=71.165 ng L−1).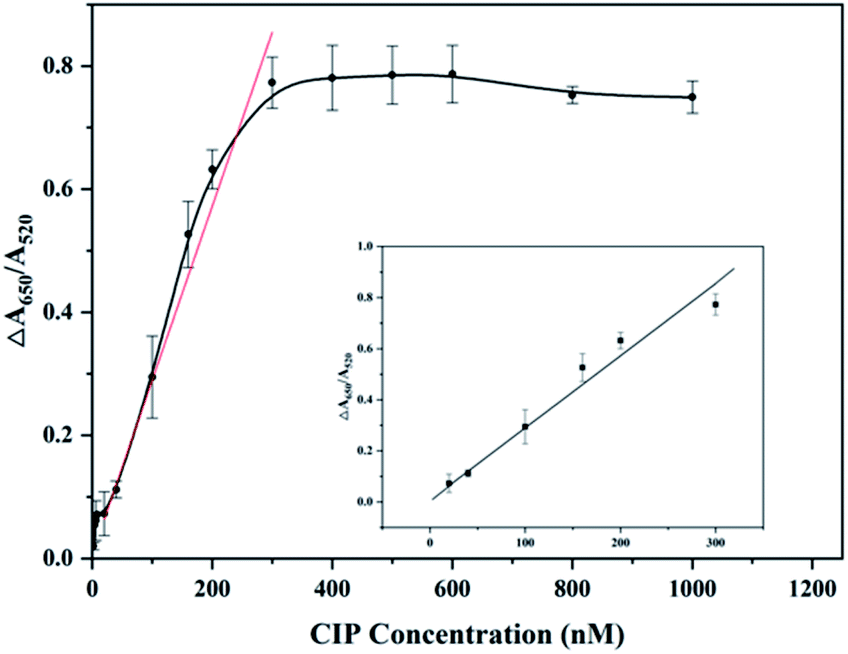 | ||
| Fig. 4 Sensitivity of the detection system. Experimental conditions: MOPS (10 nM, pH 7.0) + different final concentrations of CIP (2 nM, 4 nM, 6 nM, 8 nM, 20 nM, 40 nM, 100 nM, 160 nM, 200 nM, 300 nM, 400 nM, 500 nM, 600 nM, 800 nM, and 1000 nM) + 6 nM aptamer + 20 nM PDDA + 100 μL AuNPs. Inset: linear response in the range of 20–300 nM. | ||
As mentioned above, CIP residue is at a high level and many countries set the MRL of CIP. The LOD 0.215 nM (=71.165 ng L−1) of this detection method meets the requirements of routine detection (μg L−1) for CIP, which implies that this method has the potential to become a normal method to detect CIP in the environment. Compared with developed detection methods of CIP reported mentioned in Table 1, the colorimetric aptasensor shows advantages in both qualitative and quantitative aspects. This aptasensor has a lower LOD than traditional analysis methods such as HPLC, due to its high affinity to CIP. What is more, compared with HPLC and HPLC combined with other instruments used for detection of CIP, this method exhibits advantages of convenience and inexpensive detection, where expensive equipment and complicated procedures are not needed. In addition, electrochemical and fluorescence analytical methods have good detection limits, but both of them have shortcomings such as complex metal modifications, fluorescence labelling, and complicated pretreatments before detection. On the other hand, compared with developed colorimetric detection methods for FQs based on aptamers and AuNPs, this method also shows merits. The LOD (0.215 nM) of this method is lower than that for the detection of OFL41 (3.4 nM). Moreover, the aptamer and AuNPs used in this system do not need to be modified or combined with other materials, compared to the detection for enrofloxacin (ENR)39 where aptamers are first assembled on the surface of magnetic beads (MBs) and AuNPs. Apart from this, rapid determination of CIP can be realized through visually observable color change of solution, indicating the prospect of the colorimetric aptasensor in short-time detection of CIP. Herein, this colorimetric aptasensor can be regarded as a suitable detection method for CIP, due to advantages of low detection limit, visual rapid determination, good sensitivity, uncomplicated precision, low instrument requirement and cost effectiveness.
Selectivity of the aptasensor for CIP detection
Selectivity is another essential factor to assess the anti-interference ability of the detection method, which reflects whether it can be applied to the environment sample. To investigate the selectivity, different kinds of interferents (structural analogues, other antibiotics, amino acids, metal ions) including KAN, LVX, TET, ENR, PCN, P4, Gly, Arg, Phe, Cd2+, Pb2+, Hg2+, and 7-ACA, were added to the solution under the optimal experimental conditions, and the values of ΔA were recorded and calculated. As depicted in Fig. 5, the ΔA of CIP presents the most obvious signal, which is much higher than those of other interferents, indicating the good selectivity of the detection method. Additionally, rapid determination of CIP can be performed based on the color of the solution: only the CIP-added sample turns clearly blue while the remaining samples remain red. The LVX sample exhibits a certain signal for the reason that LVX belongs to the same category of antibiotics (fluoroquinolones) and is similar to CIP in chemical structure. However, its signal is much lower than that of CIP. The obtained results verify the high selectivity of this colorimetric detection method for CIP.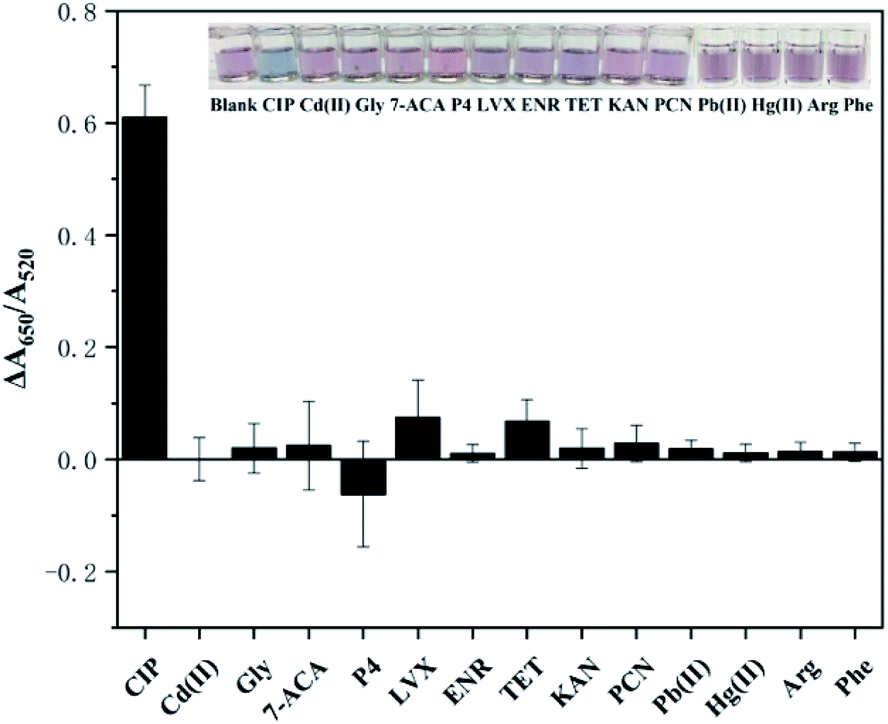 | ||
| Fig. 5 Selectivity of the detection for CIP. Interferents: Cd2+, 7-aminocephalosporanic acid (7-ACA), glycine (Gly), progesterone prog (P4), levofloxacin tablets (LVX), enrofloxacin (ENR), tetracycline hydrochloride (TET), kanamycin(KAN), penicillin(PCN), Pb2+, Hg2+, arginine (Arg), and phenylalanine (Phe). Experimental conditions: MOPS (10 nM, pH 7.0) + 500 nM interference + 6 nM aptamer + 20 nM PDDA + 100 μL AuNPs. | ||
Application in aqueous samples
Spiked recovery experiments in aqueous samples including tap water, river water and artificial urine were employed to test the practical performance of the detection method. A series of known concentrations of CIP were added to the aqueous samples under the optimal experimental conditions, and the values of ΔA were measured and calculated. As shown in Table 2, the average recovery rates of CIP in the spiked water and urine samples range from 84.87 to 118.83% with a relative standard deviation (RSD) from 1.25 to 5.71%. We notice that the recovery rates in tap water and river water are over 100%, and this may result from false positives produced by interferents in the water environment that can interact with aptamers. As a complex matrix, artificial urine contains protein and many impurities, and it is a viscous liquid. These factors may affect the process of the detection system such as the aggregation of the AuNPs and activity of aptamers, causing false negatives in the spike experiment. In general, the recovery rates in the spike experiment are within the standard range of 80–120% residual spiked detection, indicating that the colorimetric detection method established in this study has certain application prospects to detect CIP in environmental aqueous samples.| Sample | Spiked concentration (nM) | Mean found concentration (nM) | Recovery (%) | RSD (%) |
|---|---|---|---|---|
| a RSD: relative standard deviation. | ||||
| Tap water | 40 | 45.65 | 114.13 | 1.25 |
| 200 | 222.48 | 111.24 | 2.84 | |
| River water | 40 | 47.53 | 118.83 | 1.76 |
| 200 | 231.33 | 115.67 | 2.45 | |
| Urine | 40 | 36.05 | 90.12 | 5.71 |
| 200 | 169.74 | 84.87 | 1.64 | |
Conclusions
In this study, a colorimetric detection method on the basis of an unmodified CIP-aptamer, AuNPs, and PDDA is successfully established to determine CIP in aqueous solution. The mechanism of the method is based on high affinity between CIP and the CIP-aptamer and AuNP aggregation induced by PDDA. Color changes and the value of ΔA650/A520 in the solution are applied for rapid determination and quantification of CIP. The LOD of this method is 0.215 nM with the linear response (R = 0.9935) range from 20 to 300 nM. What is more, good detection limits, high-specificity, easy progress, short time, low cost, valid detection are the merits of the method. Consequently, it is expected that such a method will be useful for the development of detection and analysis for CIP in actual aqueous samples, and it provides a potentially alternative approach for the detection of other antibiotics.Conflicts of interest
The authors declare no conflict of interest.Acknowledgements
This work was sponsored by the National Key Research and Development Program (2017YFD0800704).Notes and references
- K. Kümmerer, Antibiotics in the Aquatic Environment, John Wiley & Sons, Ltd, 2011 Search PubMed.
- E. Turiel, G. Bordin and A. R. Rodríguez, J. Chromatogr. A, 2003, 1008, 145–155 CrossRef CAS PubMed.
- M. Ferech and, J. Antimicrob. Chemother., 2006, 58, 401–407 CrossRef PubMed.
- I. Ebert, J. Bachmann, U. Kuehnen, A. Kuester, C. Kussatz, D. Maletzki and C. Schlueter, Environ. Toxicol. Chem., 2011, 30, 2786–2792 CrossRef CAS PubMed.
- C. Girardi, J. Greve, M. Lamshoeft, I. Fetzer, A. Miltner, A. Schaeffer and M. Kaestner, J. Hazard. Mater., 2011, 198, 22–30 CrossRef CAS PubMed.
- A. Al-Ahmad, F. D. Daschner and K. Kümmerer, Arch. Environ. Contam. Toxicol., 1999, 37, 158–163 CrossRef CAS PubMed.
- J. Davies and D. Davies, Microbiol. Mol. Biol. Rev., 2010, 74, 417–433 CrossRef CAS PubMed.
- A. Sadezki, D. Löffler, M. Schlüsener, B. Roig and T. Ternes, Real situation: occurrence of the main investigated PPs in water bodies, ch 4, 2010 Search PubMed.
- A. F. Martins, T. G. Vasconcelos, D. M. Henriques, C. D. S. Frank, A. KÖnig and K. KÜmmerer, Clean, 2008, 36, 264–269 CAS.
- J. Zhao, B. I. Chun-Juan, Z. L. Chen, Q. Shi, L. I. Lin-Ru and C. X. Yao, J. Ecol. Rural Environ., 2017, 33, 120–126 Search PubMed.
- R. Stahlmann and H. Lode, Drugs, 1999, 58(Suppl 2), 37–42 CrossRef CAS PubMed.
- B. Halling-Sørensen, L. H.-C. Holten, H. R. Andersen and F. Ingerslev, J. Antimicrob. Chemother., 2000, 46, 53 CrossRef.
- X. Liu, J. C. Steele and X. Z. Meng, Environ. Pollut., 2017, 223, 161–169 CrossRef CAS PubMed.
- V. F. Samanidou, C. E. Demetriou and I. N. Papadoyannis, Anal. Bioanal. Electrochem., 2003, 375, 623–629 CrossRef CAS PubMed.
- O. R. Idowu and J. O. Peggins, J. Pharm. Biomed. Anal., 2004, 35, 143–153 CrossRef CAS PubMed.
- M. T. Maya, N. J. Goncalves, N. B. Silva and J. A. Morais, J. Chromatogr. B: Biomed. Sci. Appl., 2001, 755, 305–309 CrossRef CAS.
- P. Gayen and B. P. Chaplin, ACS Appl. Mater. Interfaces, 2016, 8, 1615–1626 CrossRef CAS PubMed.
- T. Matsunaga, T. Kondo, T. Osasa, A. Kotsugai, I. Shitanda, Y. Hoshi, M. Itagaki, T. Aikawa, T. Tojo and M. Yuasa, Carbon, 2020, 159, 247–254 CrossRef CAS.
- N. Yuphintharakun, P. Nurerk, K. Chullasat, P. Kanatharana, F. Davis, D. Sooksawat and O. Bunkoed, Spectrochim. Acta, Part A, 2018, 201, 382–391 CrossRef CAS PubMed.
- D. Li, Z. Y. Yan and W. Q. Cheng, Spectrochim. Acta, Part A, 2009, 71, 1204–1211 CrossRef PubMed.
- C. J. Veiopoulou, P. C. Ioannou and E. S. Lianidou, J. Pharm. Biomed. Anal., 1997, 15, 1839–1844 CrossRef CAS PubMed.
- H. T. Zhang, J. Q. Jiang, Z. L. Wang, X. Y. Chang, X. Y. Liu, S. H. Wang, K. Zhao and J. S. Chen, J. Zhejiang Univ., Sci., B, 2011, 12, 884–891 CrossRef CAS PubMed.
- S. U. Akki and C. J. Werth, Environ. Sci. Technol., 2018, 52, 8989–9007 CrossRef CAS PubMed.
- H. U. Dingfei, B. Fulton, K. Hendersons and J. Coats, Environ. Sci. Technol., 2008, 42, 2982 CrossRef PubMed.
- A. D. Ellington and J. W. Szostak, Nature, 1990, 346, 818–822 CrossRef CAS PubMed.
- C. Tuerk and L. Gold, Science, 1990, 249, 505–510 CrossRef CAS PubMed.
- P. Fan, A. K. Suri, R. Fiala, D. Live and D. J. Patel, J. Mol. Biol., 1996, 258, 480–500 CrossRef CAS PubMed.
- J. Feigon, T. Dieckmann and F. W. Smith, Cell Chem. Biol., 1996, 3, 611–617 CAS.
- M. Famulok, J. r. S. Hartig and G. Mayer, Chem. Rev., 2007, 107, 3715–3743 CrossRef CAS PubMed.
- C. Reinemann, U. F. V. Fritsch, S. Rudolph and B. Strehlitz, Biosens. Bioelectron., 2015, 77, 1039–1047 CrossRef PubMed.
- X. Hu, K. Y. Goud, V. S. Kumar, G. Catanante, Z. Li, Z. Zhu and J. L. Marty, Sens. Actuators, B, 2018, 268, 278–286 CrossRef CAS.
- K. Abnous, N. Danesh, M. Alibolandi, M. Ramezani, S. T. Dr and A. S. Dr, Sens. Actuators, B, 2017, 240, 100–106 CrossRef CAS.
- F. Charbgoo, F. Soltani, S. M. Taghdisi, K. Abnous and M. Ramezani, TrAC, Trends Anal. Chem., 2016, 85, 85–87 CrossRef CAS.
- G. Du, L. Wang, D. Zhang, X. Ni, X. Zhou, H. Xu, L. Xu, S. Wu, T. Zhang and W. Wang, Anal. Biochem., 2016, 514, 2–7 CrossRef CAS PubMed.
- D. Zhang, W. Zhang, J. Ye, S. Zhan, B. Xia, J. Lv, H. Xu, G. Du and L. Wang, Aust. J. Chem., 2015, 69, 12–19 CrossRef.
- Y. Qi and P. B. Li, Chem.–Eur. J., 2011, 17, 1642–1648 CrossRef CAS PubMed.
- U. Kreibig and L. Genzel, Surf. Sci. Lett, 1985, 156, 678–700 CrossRef CAS.
- S. Zhan, M. Yu, J. Lv, L. Wang and P. Zhou, Aust. J. Chem., 2014, 67, 813–818 CrossRef CAS.
- Y. Du, Y. Zhou, Y. Wen, X. Bian, Y. Xie, W. Zhang, G. Liu and J. Yan, Microchim. Acta, 2019, 186 Search PubMed.
- P. Lavaee, N. M. Danesh, M. Ramezani, K. Abnous and S. M. Taghdisi, Microchim. Acta, 2017, 184, 2039–2045 CrossRef CAS.
- X. Zhou, L. Wang, G. Shen, D. Zhang, J. Xie, A. Mamut, W. Huang and S. Zhou, Microchim. Acta, 2018, 185, 335 CrossRef PubMed.
- K. C. Grabar, R. G. Freeman, M. B. Hommer and M. J. Natan, Anal. Chem., 1995, 67, 735–743 CrossRef CAS.
- H. Peng, C. Soeller and J. Travas-Sejdic, Chem. Commun., 2006, 35, 3735 RSC.
- N. Nikolaus and B. Strehlitz, Sensors, 2014, 14, 3737–3755 CrossRef CAS PubMed.
- Y. Wu, S. Zhan, H. Xing, L. He, L. Xu and P. Zhou, Nanoscale, 2012, 4, 6841–6849 RSC.
- W. Haiss, N. T. K. Thanh, J. Aveyard and D. G. Fernig, Anal. Chem., 2007, 79, 4215–4221 CrossRef CAS PubMed.
- W. Jeon, S. Lee, D. H. Manjunatha and C. Ban, Anal. Biochem., 2013, 439, 11–16 CrossRef CAS PubMed.
| This journal is © The Royal Society of Chemistry 2021 |