An impedimetric approach for COVID-19 detection
Yudum
Tepeli Büyüksünetçi
a,
Burak Ekrem
Çitil
b and
Ülkü
Anık
 *ac
*ac
aMugla Sitki Kocman University, Faculty of Science, Chemistry Department, Kotekli-Mugla, Turkey. E-mail: ulkuanik@mu.edu.tr; Tel: +90 252 211 1503
bMugla Sitki Kocman University, Faculty of Medicine, Department of Medical Microbiology, Kotekli-Mugla, Turkey
cSensors, Biosensors and Nano-Diagnostic Systems Laboratory, Research Laboratory Center, Mugla Sitki Kocman University, Kotekli-Mugla, Turkey
First published on 8th November 2021
Abstract
In this study, an electrochemical approach for the determination of coronavirus disease (COVID-19) was developed. The biosensor system relied on the spike protein (S-protein) based infection mechanism of the virus and included separate interactions of receptors like angiotensin-converting enzyme 2 (ACE2) and CD147. After the optimization of experimental parameters, the analytical characteristics of both receptors ACE2 and CD147 were investigated. For ACE2 receptor, the linear detection ranges of the S-protein were found in the range of 700 ng mL−1 to 1500 ng mL−1 and from 1500 ng mL−1 to 7000 ng mL−1 with a limit of detection (LOD) value of 299.30 ng mL−1. Meanwhile, for CD147 receptor the linear range was in the range of 500 ng mL−1 to 5000 ng mL−1 with a LOD value of 38.99 ng mL−1. After the examination of analytical characteristics, the developed electrochemical approach was applied for severe acute respiratory syndrome coronavirus 2 samples and the obtained results were validated with real time polymerase chain reaction method.
1. Introduction
The massive effect of the coronavirus disease (COVID-19) continues now more than ever, considering the new mutants. As it is well known, severe acute respiratory syndrome coronavirus 2 (SARS-CoV-2) creates COVID-19. Briefly, the spike protein (S-protein) of the virus provides cellular entry through the host via suitable receptors and proteases. Though the binding of S-protein to angiotensin-converting enzyme 2 (ACE2) receptor, that usually creates the pulmonary effects, has had the most focus, SARS-CoV-2 affects almost the whole body.1 For example, it is known that among COVID-19 patients, more than 10% have neurological symptoms.1 While the exact reason for this is unknown, there is a study that demonstrates highly expressed CD147 receptors in brain cell lines.1For ACE2 case, ACE2 is widely distributed mainly in bronchial, alveolar and intestinal epithelial cells, together with vascular endothelial cells. It is also present in heart, kidneys, spleen, thymus, lymph nodes and bone marrow at a lower level.2 Because of this distribution, the most effected organs become lungs and intestines in terms of COVID-19 infection. Besides ACE2, CD147 has recently become another host specific receptor for binding of S-protein for COVID-19 infections.1 CD147, also known as Basigin or EMMPRIN, is a type II trans-membrane glycoprotein that belongs to the immunoglobulin superfamily.3 It is associated in the invasion of plasmodium, tumor formation and virus communicability.4–6 Also, the wide expression of this receptor has been reported for cell types like hematopoietic, epithelial, and endothelial.1,7
As it is well known, SARS-CoV-2 infection starts with the interaction of the receptor binding site of the SARS-CoV-2 virus with an appropriate receptor of the host cell like ACE2. On the other hand, while receptors like ACE2 are responsible for the virus’ attachment onto the cells, activation of S-protein that includes multiple cleavages at appropriate sites, is achieved by host proteases such as transmembrane protease serine 2 (TMPRSS2).8–10 Following the incorporation of the receptor binding domain (RBD) of the virus with suitable host receptors, the activation of S protein occurs via proteolytic cleavage that is provided by appropriate host proteases including TMPRSS2, cathepsin B/L and furin. The activation procedure of S protein provides a viral-host membrane fusion and then the release of viral RNA into the host cytoplasm consecutively.11
In order to decrease death and infection rates, rapid and effective detection of this virus is mandatory. Since existing polymerase chain reaction (PCR) methods are not practical and precise enough, more effective diagnostic tools are needed. There are various rapid tests and electrochemical biosensors that have been developed for the detection of COVID-19.12–16 The nature of these rapid tests and biosensors usually relies on antigen–antibody interactions.15,16 However most of these tests lack high accuracy and effectiveness towards the COVID-19 variations.17 Also in many cases, pretreatment procedures have to be performed to collect real samples prior to the application of the developed biosensors.18,19 For this reason, more accurate and effective interaction mechanisms (rather than the antigen–antibody interaction based assays) are needed. In this work, for the first time, we manage to observe the change in electrochemical signals following the infection mechanism of SARS-CoV-2. Previously, by using a similar path, we managed to develop a diagnostic approach for the influenza A virus.20–22 In a similar manner here, we immobilize ACE2 and CD147 at different electrodes and monitored their electrochemical interactions with S-protein and finally at some part of the study, TMPRSS2 was also added onto the electrode surface to check the binding of S-protein to ACE2 or CD147 receptor. After the optimization of the experimental parameters and the examination of analytical characteristics, the developed electrochemical approach was validated by applying it to the analysis of real SARS-CoV-2 samples.
2. Experimental section
2.1. Reagents and apparatus
Sodium hydroxide (NaOH), hydrochloric acid (HCl), nitric acid (HNO3), and potassium dihydrogen phosphate (KH2PO4) were purchased from Merck. N-(3-Dimethylaminopropyl)-N-ethylcarbodiimide hydrochloride (EDC) and N-hydroxysuccinimide (NHS) cross-linking pairs were obtained from Sigma-Aldrich. Recombinant human angiotensin-converting enzyme 2 (ACE2) was obtained from RayBiotech while CD147 recombinant human protein receptors and the SARS-CoV-2 S-protein were purchased from Biovision. Recombinant human transmembrane protease serine 2 (TMPRSS2) was purchased from Cusabio. For the selectivity studies, H3N2 Brisbane virus and H1N1 New Caledonia viruses were obtained from Hytest. All solutions were prepared with double distilled ultrapure water.A “Bio-Speedy® SARS-CoV-2 + VOC202012/01 RT-qPCR” kit from Bioeksen R&D Technologies Istanbul-Turkey was utilized to conduct the RT-PCR procedure. The amplification was performed with a CFX96 Touch Real-Time PCR Detection System Instrument (Bio-Rad Laboratories, Inc, USA). vNAT® tubes were also obtained from Bioeksen R&D Technologies Istanbul-Turkey. (Extraction Consumables of vNAT® Viral Nucleic Acid Buffer Cat No BS-NA-510; vNAT® Transfer Tube Cat No BS-NA-513-100-Bioeksen R&D Technologies Istanbul-Turkey.)
All the electrochemical measurements were performed via a μ-AUTOLAB Type III electrochemical measurement system from Metrohm. This instrument was directed by NOVA 1.10 software. The electrochemical impedance spectroscopy (EIS) measurements were conducted with a 70 μL working medium solution, containing 0.1 M, pH 7.4 phosphate buffer and 5 mM K3[Fe(CN)6]/K4[Fe(CN)6] redox couple, in the frequency range of 0.1 Hz–10 kHz at a potential of 0.1 V using a commercially obtained gold screen-printed electrode (AuSPE).
2.2. Fabrication of the SARS-CoV-2 impedimetric biosensor
The SARS-CoV-2 impedimetric biosensor was constructed on a commercially available AuSPE. For this purpose, the working electrode zone of AuSPE was modified in order to be specific to SARS-CoV-2. After treating it with 10 μL of 100 mM EDC/150 mM NHS linker mixture for 30 min, 10 μL of 10 ng mL−1 ACE2 or 3 μg mL−1 CD147 receptor protein was immobilized onto the working electrode and left for 30 min. A washing step with 0.1 M PBS (pH 7.4) was applied before the addition of 10 μL of a certain amount of the SARS-CoV-2 S-protein onto the modified working electrode zone. This process's incubation lasted for 45 min at 20 °C. After the binding reaction between the S1 subunit and ACE2 or CD147 was completed, the test zone was washed with 0.1 M PBS (pH 7.4) to remove the unbound SARS-CoV-2 S-protein. For the last step, to control the binding of the S-protein-receptor, 10 μL of 30 μg mL−1 TMPRSS2 enzyme was put onto the SARS-CoV-2 S-protein immobilized surface (for 30 min) to cleave the S2 subunit of the SARS-CoV-2 S-protein (Scheme 1).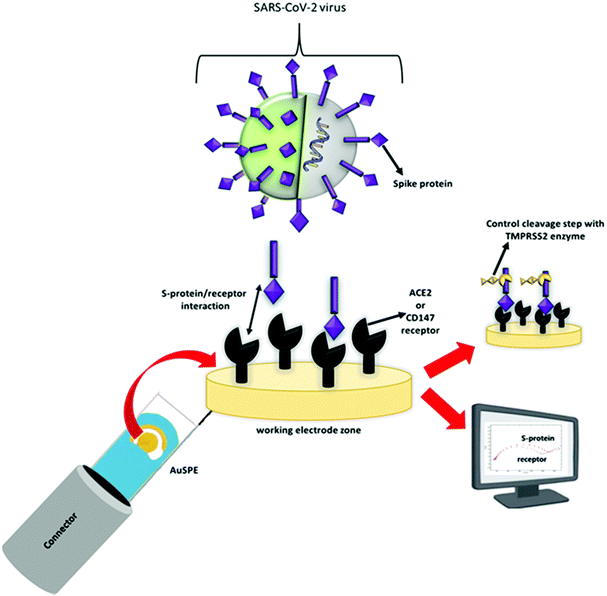 | ||
| Scheme 1 Schematic presentation of SARS-CoV-2 and the working principle of developed electrochemical COVID-19 biosensor. | ||
2.3. Electrochemical detection procedure of SARS-CoV-2
Essentially, the developed impedimetric biosensor system's working principle relies on the transmission mechanism of SARS-CoV-2 virus. First, SARS-CoV-2 S-protein binds to human ACE2 or CD147 receptors to enter human cells. Then, TMPRSS2 protease enzyme that is widely expressed in epithelial cells of the respiratory, gastrointestinal, and urogenital tract, cleaves the S-protein from the S2′ site.23 Herein we observed the last step only to control the binding of the S-protein to ACE2 or CD147 receptor. All of the other experiments were conducted without the addition of TMPRSS2 in the medium. All steps in this reaction sequence were monitored with EIS. The working conditions of EIS procedure were as follows: the frequency range was 0.1 Hz–10 kHz at a potential of 0.1 V and with 5 mM K3[Fe(CN)6]/K4[Fe(CN)6] (in pH: 7.4, 0.1 M phosphate buffer medium).2.4. Selectivity studies
Selectivity studies of the developed ACE2 receptor based impedimetric model COVID-19 biosensor were performed with two different types of Influenza A viruses namely H3N2 Brisbane virus and H1N1 New Caledonia virus. For this purpose, 10 μL (5 μg mL−1) from each of the H1N1, H3N2 Influenza A viruses and the S-protein were incubated with the developed impedimetric biosensor at 20 °C for 45 min. In order to determine the selectivity effect of Influenza A viruses on the developed system, EIS measurements were conducted in triplicate.2.5. Real sample application
Routine COVID-19 laboratory diagnosis relies on the Bio-Speedy® SARS-CoV-2 real time PCR assay in our laboratory. The “Bio-Speedy® SARS-CoV-2 + VOC202012/01 RT-qPCR” kit targets the Orf1ab, and N gene regions present in all SARS-CoV-2 for the routine screening as well as an N gene region only found in VOC-202012/01 in a single multiplex reaction. The amplification was performed on a CFX96 Touch Real-Time PCR Detection System Instrument (Bio-Rad Laboratories, Inc, USA). 200 RFU (relative fluorescence units) was selected as the threshold level and used to estimate the number of threshold cycles (Cq), which was in correlation with the manufacturer's recommendations. Samples with the SARS-CoV-2 RT-PCR cycle threshold cycle value less than or equal to 33 (Cq ≤ 33) were considered as positive.
41 positive samples used in the study were alpha variants of SARS-CoV-2 (also known as the British variant and was first identified in the United Kingdom and was the dominant variant in Turkey during the months of the study.) We tested all of the samples that were selected for use in the study with our own ACE2 receptor based electrochemical method within 24 hours from admission to the laboratory. Samples were stored at 2–8 °C for approximately 24 hours until they were tested. Real sample applications were performed by using a 10 μL volume of the real sample. Each real sample was analyzed for one time. The data were analyzed using SPSS Version 23.0 software. Measures of central tendency (mean, median values) and measures of dispersion (standard deviation (SD), variance, interquartile range (Iq) values) were calculated in the study groups. Kolmogorov–Smirnov, Shapiro-Wilks, and Liliefors tests were used for determining the distribution characteristics of the impedance data measured in both groups. P-Value <0.01 was considered to be significant. Study groups were compared based on the Mann–Whitney U test.
The Pearson correlation coefficient was also computed to investigate the relationship between impedance measurements and Cq values for the PCR positive group. The present study was approved by the clinical research ethics committee of Muğla Sıtkı Koçman University.
3. Results and discussion
3.1. Electrochemical characterization of impedimetric SARS-CoV-2 biosensor
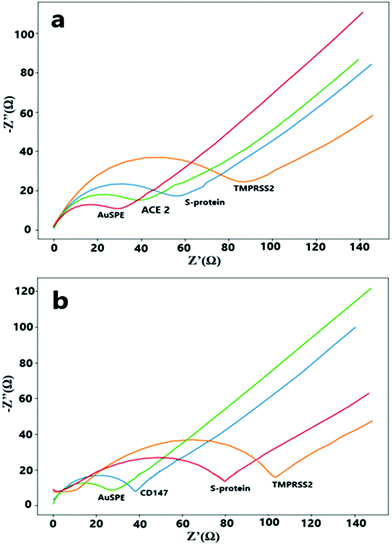
EIS was conducted to find out about the electrochemical behavior of developed biosensor after each surface modification step. Nyquist plots at Fig. 1, clearly show the differences in the electron transfer resistance related to various modification steps. For the first step, the smallest electron-transfer resistance was obtained for the plain AuSPE because of the gold's conductive structure. Following the ACE2 or CD147 protein (receptors) immobilization steps, the resistance value slightly increases because of the blocking of the electron transfer sites on the electrode surface. Upon immobilization of S-protein onto the appropriate receptor protein, electron transfer ability decreases because of a blockage of electron transfer via formation of a new layer. On the last control step with the TMPRSS2 enzyme, the TMPRSS2 enzyme attacks S-protein to cleave it from the S2 subunit that has been positioned on the electrode surface. Since the TMPRSS2 enzyme covers the active electrode surface more, it prevents electron transport more and as a result, an increase in the electron-transfer resistance has been observed (Fig. 1).The working conditions such as receptor immobilization time, ACE2 receptor–S-protein incubation time and the working temperature were optimized. All of the optimization experiments were conducted with EIS in 0.1 M phosphate buffer that contained 5 mM K3[Fe(CN)6]/K4[Fe(CN)6].
3.2. Investigation of receptor immobilization time effect on the developed electrochemical COVID-19 biosensor
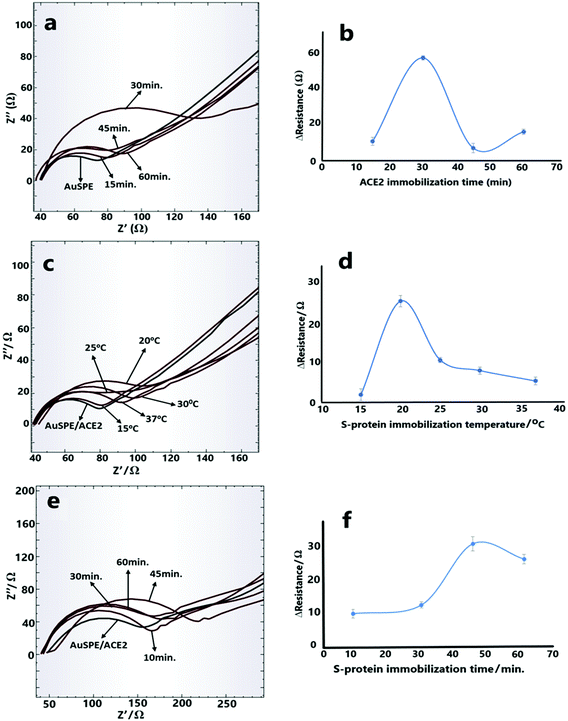
The optimum ACE2 and CD147 amounts were determined as 10 ng mL−1 and 10 μg mL−1, respectively, based on the values of activity experiments that were present on their datasheets. Next, the immobilization time optimization experiments of ACE2 receptor on the electrode surface were performed for 15 min, 30 min, 45 min, and 60 min (Fig. 2a and b). The best difference in EIS diagrams was obtained with 30 min immobilization time and this value was also applied for CD147 protein immobilization procedure as the optimized immobilization time.3.3. Investigation of working temperature and incubation time effect
The temperature and the incubation time are the next parameters that were optimized for the developed electrochemical COVID-19 biosensor. As it is well known, temperature is a very important factor for the functioning of proteins considering their different behaviors under high and low-temperature conditions.25,26 Therefore first, S-protein was incubated with ACE2 receptor, with temperatures ranging from 15 °C to 37 °C. The best results were obtained with 20 °C incubation temperature (Fig. 2c and d). As the incubation temperature increases, the interaction between ACE2 and the S-protein decreases which is directly reflected in the obtained resistance values. This situation can be explained by the conformational change in RBD of S-protein (on the S1 subunit). While RBD is in an open conformation at low temperatures (around 20 °C), it begins to close at higher temperatures (around 30–40 °C) and forms a completely closed conformation at 50 °C.27On the other hand, since the developed impedimetric COVID-19 biosensor is entirely based on the interactions between S-protein and the receptors, the incubation time optimization must be performed. For this purpose, impedimetric measurements were carried out after the incubation of S-protein-receptor at 20 °C for 10 min, 30 min, 45 min and 60 min. As can be seen from Fig. 2e and f, the optimum incubation time was determined as 45 min.
3.4. Analytical characteristics
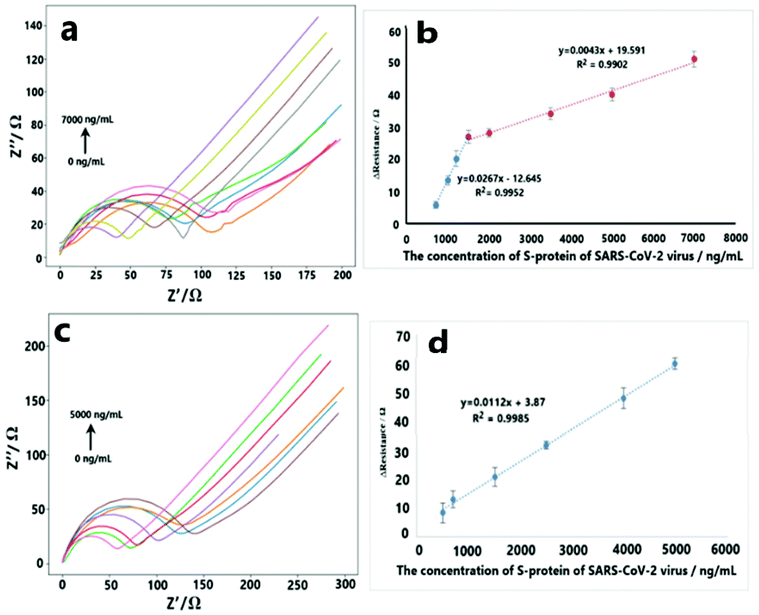
According to the electron transfer ability changes of the electrode surface during the interactions between S-protein and receptor molecules (ACE2 or CD147) under optimum conditions, analytical characteristics were examined. During analytical characteristic studies, EIS measurements of three replicates were performed for each concentration. For SARS-CoV-2 S-protein–ACE2 interaction, the response of S-protein was found to be linear in the ranges of 700 ng mL−1 to 1500 ng mL−1 with the equation of y = 0.0267x − 12.645 (R2 = 0.9952), and 1500 ng mL−1 to 7000 ng mL−1 concentration range with the equation of y = 0.0043x + 19.591 (R2 = 0.9902) (Fig. 3a and b). Limit of detection (LOD = 3 s m−1), limit of quantification (LOQ = 10 s m−1) and relative standard deviation (RSD) values were determined as 299.30 ng mL−1, 893.75 ng mL−1 S-protein, and 4.5% (n:3, for 2000 ng mL−1 S-protein concentration) respectively. Additionally, for S-protein–CD147 interaction, the linear detection range was determined from 500 ng mL−1 to 5000 ng mL−1 S-protein concentration with the equation of y = 0.0112x + 3.87 (R2 = 0.9985) (Fig. 3c and d). LOD, LOQ and RSD values were calculated as 38.99 ng mL−1, 129.97 ng mL−1 and 4.03% (n:3, for 2500 ng mL−1 S-protein concentration), respectively.3.5. Selectivity studies
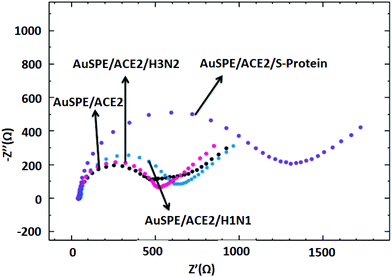
As shown in Fig. 4, the selectivity study was carried out by using 10 μL of H1N1, H3N2 influenza A viruses and S-protein at the same concentrations (5 μg mL−1). When the developed ACE2 receptor based model electrochemical approach for COVID-19 was incubated with H1N1 and H3N2 Influenza A viruses, very small increases were observed in the resistance values (43.19 Ω and 151.43 Ω), while a significant increase in resistance was determined after interaction with S-protein (811.28 Ω). As Influenza A virus does not react with the ACE2 receptor, the obtained results are in line with the expectations.3.6. Real sample application
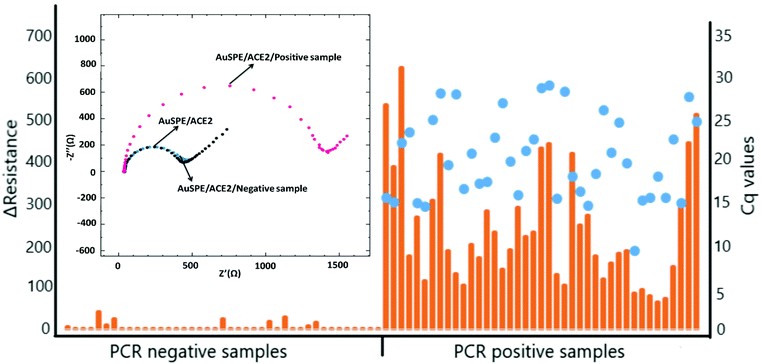
For the real sample analysis, EIS measurements were conducted for 41 positive samples in the resistance range of 65.00 Ω to 621.61 Ω and for 41 negative samples in the resistance range of 1.00 Ω and 41.00 Ω.In our experimental approach, as a result of the union of S-protein with ACE-2 receptor, large coverage of electrode surface was expected. Therefore, high impedance values were expected to be measured for samples that contained SARS-CoV-2 virus.
In our study PCR negative (median = 1.00, IQR = 0.00) and PCR positive (median = 188.00, IQR = 171.91) groups were compared based on the Mann–Whitney U test, given that the groups were not normally distributed. Mean ranks were 21 and 62 respectively and Z = −8.04 (p-value = 0.00). Thus, the difference between the two groups’ mean ranks were statistically significant. The impedance values of some negative samples were measured different from 1. This event may have resulted from the dense structure of the samples. These specimens might have had a viscous structure by virtue of the mucoid post nasal discharge, and/or bleeding during sample collection in patients with fragile mucosa. This dense content in the sample tube may have caused the impedance values differ from 1 for these PCR negative samples (Fig. 5).
Fig. 5 shows the impedance values measured in the positive and negative PCR samples included in the study, and the Cq values detected in the PCR test of the positive samples.
We also evaluated the relationship between the impedance in PCR positive group and relevant Cq values. Correlation between impedance and Cq values was 0.26 and it was not statistically significant (p-value = 0.09).
When the resistance differences obtained by EIS were examined, it was observed that better responses were generally obtained in the samples with a high Cq ≥ 15 value while a decrease in the resistance difference value was obtained for Cq ≤ 15 value. A low Cq value means high viral load, while a high Cq value means low viral load. Therefore, this situation can be explained as the saturation of the electrode bioactive layer which was caused by increased virus amounts.
Finally, we compared our electrochemical COVID-19 biosensor with similar electrochemical studies reported for COVID-19 diagnosis (Table 1). According to Table 1, considering all the experimental findings, it is clear that the system we developed is within the acceptable limits.
| Technique | Analyte | Bioactive surface | Time (min) | Number of clinical samples | Linear range | LOD | Ref. |
|---|---|---|---|---|---|---|---|
| DPV: differential pulse voltammetry; OCP-EIS, open-circuit potential-electrochemical impedance spectroscopy; DPV, differential pulse voltammetry, SWV, square-wave voltammetry. | |||||||
| SWV | SARS-CoV-2 IgM and SARS-CoV-2 IgG | IgM and IgG antibodies | 45 | 17 | 1 to 1000 ng mL−1 | 1 μg mL−1 | 15 |
| EIS | S-protein | ACE2 receptor | 21 | — | 1–100![[thin space (1/6-em)]](https://www.rsc.org/images/entities/char_2009.gif) 000 nM (analytical range) 000 nM (analytical range) |
0.1 μg mL−1 | 18 |
| DPV | S and N gene target | S and N gene probe | 30 | 106 | 1 to 1 × 10⁹ copies per μL | 1 copy per μL | 19 |
| DPV and OCP-EIS | Selected protein | Viral antigen nucleocapsid protein probe | 10 | 16 | 0–5000 pg mL−1 | 500 pg mL−1 | 28 |
| DPV and OCP-EIS | S1-IgG and S1-IgM | IgM and IgG antibodies | 10 | 16 | 0–500 ng mL−1 | 250 pg mL−1 | 28 |
| EIS | SARS-CoV-2 spike protein antigen | SARS-CoV-2 spike protein antibody | — | — | 0.16 to 1.25 μg mL−1 and 2.5 to 40 μg mL−1 | 150 ng mL−1 | 29 |
| DPV | SARS-CoV-2 RNA probe target | SARS-CoV-2 RNA probe | 5 | 33 | 10−17 to 10−12 M | 200 RNA copies per mL | 30 |
| EIS | S-protein | ACE2 and CD147 receptor | 5 | 82 | 700 ng mL−1 to 7000 ng mL−1 (for ACE2) | 299.30 ng mL−1 (for ACE2) | This study |
| 500 ng mL−1 to 5000 ng mL−1 (for CD147) | 38.99 ng mL−1 (for CD147) | ||||||
4. Conclusion
In conclusion, an electrochemical approach that was based on SARS CoV-2 infection mechanism has been developed. Here it has been demonstrated that this system could work for both ACE2 and CD147 receptors. Also very accurate and effective results were obtained for real sample analysis that were validated with RT-PCR. Since it has been based on SARS-CoV-2 infection mechanism, we believe that this system could also be beneficial for mutation detections. As it is well known, RNA viruses are types of viruses that mutate continuously and very quickly. As the antigenic structure changes after each mutation, the antigen–antibody interaction will also change. For this reason, the interaction with the antibody corresponding to the new type of antigen as a result of each mutation should be considered. On the other hand, our developed system is completely based on the virus's mechanism of infecting healthy cells. Since the virus does not change the infecting mechanism based on any mutation, the mutated virus will again bind to the appropriate receptor using the S-proteins. Therefore, we believe that our system would be effective in detecting existing and new mutations.On the other hand, with the usage of a portable potentiostat, the developed biosensor can easily be converted for point of care systems. For this reason we believe that the developed electrochemical method would be suitable for usage as a fundamental COVID-19 diagnostic test in the future.
Author contributions
Yudum Tepeli Büyüksünetçi: Development and optimization of electrochemical biosensors and real sample applications. Burak Ekrem Çitil: Real sample collections and analysis both with the newly developed biosensor and RT-PCR. Ülkü Anık: Development and optimization of electrochemical biosensors, real sample applications, supervision, writing and editing.Conflicts of interest
The authors declare no competing financial interest.Acknowledgements
This work was supported by the BAP Project department of Mugla Sıtkı Kocman University (the project number: 20/108/02/1/4). Also for this study, a patent application has been made with the application number of 21/00352.References
- J. Qiao, W. Li, J. Bao, Q. Peng, D. Wen, J. Wang and B. Sun, Biochem. Biophys. Res. Commun., 2020, 533, 867–871 CrossRef CAS PubMed.
- F. Jiang, J. Yang, Y. Zhang, M. Dong, S. Wang, Q. Zhang, F. F. Liu, K. Zhang and C. Zhang, Nat. Rev. Cardiol., 2014, 11, 413–426 CrossRef CAS PubMed.
- J. Cui, W. Huang, B. Wu, J. Jin, L. Jing, W.-P. Shi, Z.-Y. Liu, L. Yuan, D. Luo, L. Li, Z.-N. Chen and J.-L. Jiang, J. Pathol., 2018, 245, 41–52 CrossRef CAS PubMed.
- Q. Huang, J. Li, J. Xing, W. Li, H. Li, X. Ke, J. Zhang, T. Ren, Y. Shang, H. Yang, J. Jiang and Z. Chen, J. Hepatol., 2014, 61, 859–866 CrossRef CAS PubMed.
- Z. Chen, L. Mi, J. Xu, J. Yu, X. Wang, J. Jiang, J. Xing, P. Shang, A. Qian, Y. Li, P. X. Shaw, J. Wang, S. Duan, J. Ding, C. Fan, Y. Zhang, Y. Yang, X. Yu, Q. Feng, B. Li, X. Yao, Z. Zhang, L. Li, X. Xue and P. Zhu, J. Infect. Dis., 2005, 191, 755–760 CrossRef CAS PubMed.
- K. Wang, W. Chen, Y. Sen Zhou, J. Q. Lian, Z. Zhang, P. Du, L. Gong, Y. Zhang, H. Y. Cui, J. J. Geng, B. Wang, X. X. Sun, C. F. Wang, X. Yang, P. Lin, Y. Q. Deng, D. Wei, X. M. Yang, Y. M. Zhu, K. Zhang, Z. H. Zheng, J. L. Miao, T. Guo, Y. Shi, J. Zhang, L. Fu, Q. Y. Wang, H. Bian, P. Zhu and Z. N. Chen, bioRxiv, 2020 DOI:10.1101/2020.03.14.988345.
- K. Nabeshima, H. Iwasaki, K. Koga, H. Hojo, J. Suzumiya and M. Kikuchi, Pathol. Int., 2006, 56, 359–367 CrossRef CAS PubMed.
- J. A. Jaimes, J. K. Millet and G. R. Whittaker, iScience, 2020, 23, 101212 CrossRef CAS PubMed.
- D. Bestle, M. R. Heindl, H. Limburg, T. V. L. van, O. Pilgram, H. Moulton, D. A. Stein, K. Hardes, M. Eickmann, O. Dolnik, C. Rohde, H.-D. Klenk, W. Garten, T. Steinmetzer and E. Böttcher-Friebertshäuser, Life Sci. Alliance, 2020, 3, e202000786 CrossRef PubMed.
- Y. Hou, J. Zhao, W. Martin, A. Kallianpur, M. K. Chung, L. Jehi, N. Sharifi, S. Erzurum, C. Eng and F. Cheng, BMC Med., 2020, 18, 1–8 CrossRef PubMed.
- Q. Zhang, R. Xiang, S. Huo, Y. Zhou, S. Jiang, Q. Wang and F. Yu, Signal Transduction Targeted Ther., 2021, 6, 1–19 CrossRef PubMed.
- S. D. Bukkitgar, N. P. Shetti and T. M. Aminabhavi, Chem. Eng. J., 2021, 420, 127575 CrossRef CAS PubMed.
- A. K. Kaushik, J. S. Dhau, H. Gohel, Y. K. Mishra, B. Kateb, N. Y. Kim and D. Y. Goswami, ACS Appl. Bio Mater., 2020, 3, 7306–7325 CrossRef CAS.
- W. A. El-Said, A. S. Al-Bogami, W. Alshitari, D. A. El-Hady, T. S. Saleh, M. A. El-Mokhtar and J.-W. Choi, BioChip J., 2021, 15, 287–295 CrossRef CAS PubMed.
- A. Yakoh, U. Pimpitak, S. Rengpipat, N. Hirankarn, O. Chailapakul and S. Chaiyo, Biosens. Bioelectron., 2021, 176, 112912 CrossRef CAS PubMed.
- H. Liu, A. Yang, J. Song, N. Wang, P. Lam, Y. Li, H. K. Law and F. Yan, Sci. Adv., 2021, 7, 8387–8402 CrossRef PubMed.
- M. Lisboa Bastos, G. Tavaziva, S. K. Abidi, J. R. Campbell, L.-P. Haraoui, J. C. Johnston, Z. Lan, S. Law, E. Maclean, A. Trajman, D. Menzies, A. Benedetti and F. A. Khan, Br. Med. J., 2020, 370, 2516 CrossRef PubMed.
- L. V. Kiew, C. Y. Chang, S. Y. Huang, P. W. Wang, C. H. Heh, C. Te Liu, C. H. Cheng, Y. X. Lu, Y. C. Chen, Y. X. Huang, S. Y. Chang, H. Y. Tsai, Y. A. Kung, P. N. Huang, M. H. Hsu, B. F. Leo, Y. Y. Foo, C. H. Su, K. C. Hsu, P. H. Huang, C. J. Ng, A. Kamarulzaman, C. J. Yuan, D. Bin Shieh, S. R. Shih, L. Y. Chung and C. C. Chang, Biosens. Bioelectron., 2021, 183, 113213 CrossRef CAS PubMed.
- T. Chaibun, J. Puenpa, T. Ngamdee, N. Boonapatcharoen, P. Athamanolap, A. P. O'Mullane, S. Vongpunsawad, Y. Poovorawan, S. Y. Lee and B. Lertanantawong, Nat. Commun., 2021, 12, 1–10 CrossRef PubMed.
- Ü. Anik, Y. Tepeli and M. F. Diouani, Anal. Chem., 2016, 88, 6151–6153 CrossRef PubMed.
- Ü. Anik, Y. Tepeli, M. Sayhi, J. Nsiri and M. Fethi Diouani, Analyst, 2017, 143, 150–156 RSC.
- M. Sayhi, O. Ouerghi, K. Belgacem, M. Arbi, Y. Tepeli, A. Ghram, Ü. Anik, L. Österlund, D. Laouini and M. F. Diouani, Biosens. Bioelectron., 2018, 107, 170–177 CrossRef CAS PubMed.
- J. A. Jaimes, J. K. Millet and G. R. Whittaker, iScience, 2020, 23, 101212 CrossRef CAS PubMed.
- B. Della Ventura, M. Cennamo, A. Minopoli, R. Campanile, S. B. Censi, D. Terracciano, G. Portella and R. Velotta, ACS Sens., 2020, 5, 3043–3048 CrossRef PubMed.
- Y. Dong, M. Liao, X. Meng and G. N. Somero, Proc. Natl. Acad. Sci. U. S. A., 2018, 115, 1274–1279 CrossRef CAS PubMed.
- L. J. Plana, A. D. Nadra, D. A. Estrin, F. J. Luque and L. Capece, J. Chem. Inf. Model., 2018, 59, 441–452 CrossRef PubMed.
- S. L. Rath and K. Kumar, Front. Mol. Biosci., 2020, 7, 583523 CrossRef CAS PubMed.
- R. M. Torrente-Rodríguez, H. Lukas, J. Tu, J. Min, Y. Yang, C. Xu, H. B. Rossiter and W. Gao, Matter, 2020, 3, 1981–1998 CrossRef PubMed.
- G. C. Zaccariotto, M. K. L. Silva, G. S. Rocha and I. Cesarino, Materials, 2021, 14, 4230 CrossRef CAS PubMed.
- H. Zhao, F. Liu, W. Xie, T. C. Zhou, J. OuYang, L. Jin, H. Li, C. Y. Zhao, L. Zhang, J. Wei, Y. P. Zhang and C. P. Li, Sens. Actuators, B, 2021, 327, 128899 CrossRef CAS PubMed.
| This journal is © The Royal Society of Chemistry 2022 |

