 Open Access Article
Precursor accumulation on nanocarbons for the synthesis of LaCoO3 nanoparticles as electrocatalysts for oxygen evolution reaction†
Aoi Sakamaki,
Hitoshi Ogihara *,
Miru Yoshida-Hirahara
 and
Hideki Kurokawa
Graduate School of Science and Engineering, Saitama University, 255 Shimo-Okubo, Sakura-ku, Saitama, 338-8570, Japan. E-mail: ogihara@mail.saitama-u.ac.jp
First published on 7th June 2021
Abstract
Oxygen evolution reaction (OER) is a key step in energy storage devices. Lanthanum cobaltite (LaCoO3) perovskite is an active catalyst for OER in alkaline solutions, and it is expected to be a low-cost alternative to the state-of-the-art catalysts (IrO2 and RuO2) because transition metals are abundant and inexpensive. For efficient catalysis with LaCoO3, nanosized LaCoO3 with a high surface area is desirable for increasing the number of catalytically active sites. In this study, we developed a novel synthetic route for LaCoO3 nanoparticles by accumulating the precursor molecules over nanocarbons. This precursor accumulation (PA) method for LaCoO3 nanoparticle synthesis is simple and involves the following steps: (1) a commercially available carbon powder is soaked in a solution of the nitrate salts of lanthanum and cobalt and (2) the sample is dried and calcined in air. The LaCoO3 nanoparticles prepared by the PA method have a high specific surface area (12 m2 g−1), comparable to that of conventional LaCoO3 nanoparticles. The morphology of the LaCoO3 nanoparticles is affected by the nanocarbon type, and LaCoO3 nanoparticles with diameters of less than 100 nm were obtained when carbon black (Ketjen black) was used as the support. Further, the sulfur impurities in nanocarbons significantly influence the formation of the perovskite structure. The prepared LaCoO3 nanoparticles show excellent OER activity owing to their high surface area and perovskite structure. The Tafel slope of these LaCoO3 nanoparticles is as low as that of the previously reported active LaCoO3 catalyst. The results strongly suggest that the PA method provides nanosized LaCoO3 without requiring the precise control of chemical reactions, harsh conditions, and/or special apparatus, indicating that it is promising for producing active OER catalysts at a large scale.
1. Introduction
Oxygen evolution reaction (OER) is a key step in energy storage devices such as those based on water electrolysis and photo-induced water splitting.1–4 OER is known to be a sluggish four-electron oxidation reaction that leads to a large overpotential. IrO2 and RuO2 are the most effective catalysts for OER in alkaline media;5,6 however, the high cost of such noble metals restricts their large-scale commercial applications.In this regard, perovskite-type oxides (ABO3 structure) have attracted attention as alternative OER catalysts. For example, LaCoO3 is known to promote OER in alkaline media.7–13 Furthermore, Ba0.5Sr0.5Co0.8Fe0.2O3–δ and La0.8Sr0.2Co0.5Fe0.5O3–δ have been reported as active OER catalysts with activities comparable to those of the state-of-the-art noble metal catalysts.14–21
Solid-state synthesis (i.e., heat treatment of solid reactants) is a conventional method for preparing perovskites. Although this method is simple and enables the synthesis of a variety of perovskites, the surface area of the products is low because the harsh sintering condition induces inter-diffusion of ions between the solids. In order to apply perovskites as catalysts, their active sites should be increased considerably; that is, perovskite nanoparticles with a high surface area, which favors catalytic activity, should be developed. In this regard, low-temperature processes have been pursued to synthesize perovskite nanoparticles.
The sol–gel method is a well-known solution-based process for producing perovskite nanoparticles with a high surface area. In this method, different metal cations are homogeneously mixed in a gel by forming a chelate complex with organic molecules, typically citric acid and ethylene glycol (this process is also known as the citrate or Pechini method).22–25 The homogeneous mixing of metal cations allows the fabrication of perovskite nanoparticles by low-temperature calcination. In addition, other solution-based methods such as co-precipitation,26–28 flame-spray pyrolysis,29–31 templated synthesis,32–34 and hydrothermal synthesis35–39 have also been reported for the synthesis of perovskite nanoparticles.
Our research group has previously reported a liquid-phase process referred to as the precursor accumulation (PA) method to synthesize oxide nanomaterials.40–44 As shown in Scheme 1, in the PA method, the metal precursors are loaded on the surface of carbon, and nanostructured oxides are formed by the removal of carbon as well as the decomposition of the precursors via a calcination process. Here, we first demonstrate that LaCoO3 nanoparticles can be synthesized by the PA method in the simple steps (see Scheme 1). In the first step, commercially available carbon powder is soaked in a solution of lanthanum and cobalt nitrates and then the precursor-loaded carbon sample is dried and calcined in air. LaCoO3 nanoparticles were formed without the need for precisely controlling the chemical reactions, harsh processing conditions, and/or special apparatus. Based on the physicochemical properties of the prepared LaCoO3 nanoparticles, we discuss the effect of nanocarbon type on the formation of LaCoO3. Finally, the OER activity of the LaCoO3 nanoparticles is compared with that of the LaCoO3 nanoparticles prepared by a conventional sol–gel method.
2. Experimental section
2.1. Materials
La(NO3)3·6H2O, Co(NO3)2·6H2O, La(CH3COO)3·nH2O, Co(CH3COO)2·4H2O, citric acid, 0.1 M KOH aqueous solution (Wako Pure Chemical Industries, Ltd.), ethanol (Kanto Chemical Co., Inc.), Ketjen black (C-ECP; Lion Specialty Chemicals Co., Ltd.), carbon nanofibers (graphitized, iron-free; Sigma-Aldrich), Vulcan XC-72 (Cabot Co.), activated carbon (Strem Chemicals Inc.), and 5 wt% Nafion perfluorinated resin solution (Sigma-Aldrich) were used as received.2.2. Synthesis of LaCoO3 by the PA method
A schematic of the PA method is shown in Scheme 1. A solution of La(NO3)3·6H2O (0.1 M) and Co(NO3)2·6H2O (0.1 M) in ethanol was used as the precursor solution. Carbon (200 mg) was placed on a membrane filter (polytetrafluoroethylene, pore size 0.5 μm) over a glass funnel (Kiriyama Glass Works Co., 21 mm in diameter). In this study, Ketjen Black, carbon nanofibers, Vulcan XC-72, and activated carbon were used as carbon materials (these are hereafter referred to as KB, CNF, XC-72, and AC, respectively). Then, ∼4 mL of the precursor solution was dropped onto the carbon powder (Scheme 1a), and then the excess solution that was not absorbed by the carbon powder was removed by suction filtration using a diaphragm vacuum pump (DTC-22; ULBAC Inc.) for 1 h (Scheme 1b). During the filtration process, ethanol absorbed by the carbon powder evaporated, and the precursors accumulated as precipitates on the surface of the nanocarbon. Subsequently, the sample was dried completely in a convection oven at 403 K and ground in a mortar. The obtained powder was then calcined in air for 4 h using an electric furnace at 923 K (ramping rate: 5 K min−1; Scheme 1c), during which carbon was completely removed (C + O2 → CO2) and a perovskite structure was formed. The samples obtained using KB, CNF, XC-72, and AC as carbon sources are denoted as LCOKB, LCOCNF, LCOXC-72, and LCOAC, respectively.2.3. Synthesis of LaCoO3 by the sol–gel method
La(CH3COO)3·nH2O (2 mmol) and Co(CH3COO)2·4H2O (2 mmol) were dissolved in water. Then, citric acid (12 mmol) was added, and the mixture was stirred magnetically on a hot plate at 403 K for 2 h. The solution turned into a red-purple sol and then a gel. Subsequently, the gel was calcined at 623 K for 4 h and then at 923 K for 4 h (ramping rate: 5 K min−1). The so-obtained sample is denoted as LCOCitrate.2.4. Characterization
X-ray diffraction (XRD) patterns of the LCO samples were recorded on a D2 Phaser X-ray diffractometer (Bruker) using Cu Kα radiation. For recording the XRD patterns of the carbons, liquid paraffin was used to fix the carbon on the sample holder. X-ray photoelectron spectroscopy (XPS) was performed on an AXIS-NOVA (Shimadzu) with a monochromatic Al Kα source at 15 kV and 20 mA. C 1s binding energy (284.8 eV) was used as the reference for charge correction. Field-emission scanning electron microscopy (FE-SEM) was conducted on an S-4800 microscope (Hitachi High-Technologies) at 15 kV. Transmission electron microscopy (TEM), scanning transmission electron microscopy (STEM), and energy-dispersive X-ray (EDX) spectroscopy were performed on a JEM-ARM200F-B equipment (JEOL Ltd., Japan) operated at 200 kV. Nitrogen adsorption/desorption measurements were performed on a Belsorp II (MicrotracBEL) sorption analyzer at 77 K. Before the measurements, carbon and LCO samples were degassed under vacuum at 403 K. The specific surface area of the samples was calculated using the Brunauer–Emmett–Teller equation. Thermogravimetry/differential thermal analysis (TG/DTA) was performed on a TA-60 (Shimadzu) under flowing air (100 mL min−1) using a ramp rate of 10 K min−1.2.5. Electrochemical measurements
The OER activity of the LCO samples was evaluated using a three-electrode cell. A glassy carbon disk electrode (0.196 cm2), a Hg/HgO electrode (internal solution: 1 M NaOH; +0.118 V vs. reversible hydrogen electrode (RHE)), and a Pt wire were used as the working, reference, and counter electrodes, respectively. A catalyst ink was prepared by sonicating a mixture of the catalyst (5 mg), ethanol (1 mL), deionized water (30 μL), and 5 wt% Nafion perfluorinated resin solution (20 μL). Then, 4 μL of the catalyst ink (concentration, 97 μg cm−2) was dropped on the glassy carbon disk electrode and dried at room temperature. An O2-saturated KOH aqueous solution (0.1 M; pH = 13) was used as the electrolyte. Linear sweep voltammetry (LSV) was performed at 10 mV s−1 scan rate using a potentiostat/galvanostat (HAB-151A, Hokuto Denko). The measured potentials were calibrated with respect to RHE using the following equation:| E(vs. RHE) = E(vs. Hg/HgO) + 0.118 + 0.059 pH |
The pH of the 0.1 M aqueous KOH solution was taken as 13.
3. Results and discussion
3.1. Physicochemical properties of nanocarbons
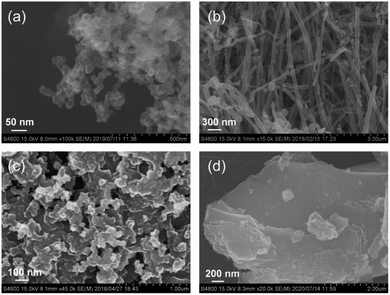
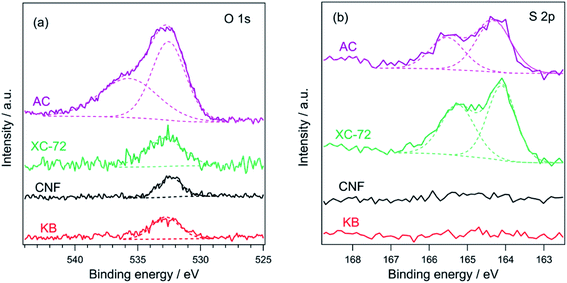
As shown in Scheme 1, carbon plays an important role in the PA method; therefore, the physicochemical properties of the used carbon materials were analyzed first. Fig. 1 shows the FE-SEM images of KB, XC-72, CNF, and AC. KB, a typical carbon black sample, is composed of nanoparticles ranging from 30 to 50 nm. CNF has a fibrous structure with fiber diameters of 100–200 nm. XC-72 is also a carbon black candidate; however, unlike in the case of KB, its nanoparticles appear to be adhered to one another. AC consists of large blocks of carbon particles. The specific surface areas estimated by the nitrogen adsorption method for KB, CNF, XC-72, and AC are 835, 17, 218, and 1334 m2 g−1, respectively. Fig. S1† shows the XRD patterns of the carbon sources. Whereas CNF clearly shows diffraction peaks that can be assigned to graphite, the other carbon samples do not show distinct peaks of graphite, indicating that they have an amorphous structure.Fig. 2 shows the O 1s and S 2p XPS profiles of the carbons. All the carbon samples show O 1s peaks (see Fig. 2a), indicating the presence of oxygenated functional groups on their surfaces. The peak at 532 eV is associated with hydroxyl or ether groups.45–47 Among the samples, only AC shows a peak at 536 eV, which is attributed to adsorbed water.45,47 In the S 2p XPS profiles, no peak was detected for KB and CNF, whereas two distinct peaks appeared at 164.0 (S 2p2/3) and 165.1 eV (S 2p1/2) for XC-72 and AC. Thus, the S 2p XPS profiles suggest that XC-72 and AC contain sulfur on their surfaces. It has been previously reported that XC-72 contains sulfur;48,49 for example, Swider and Rolison analyzed the S 2p XPS data of XC-72 and found an S 2p3/2 peak at 163.9 eV, which was assigned to S0 species.48 As discussed in the following section, sulfur present on the carbon surface significantly affects the formation of the LaCoO3 perovskite structure.
3.2. Combustion of nanocarbons in the presence of precursors
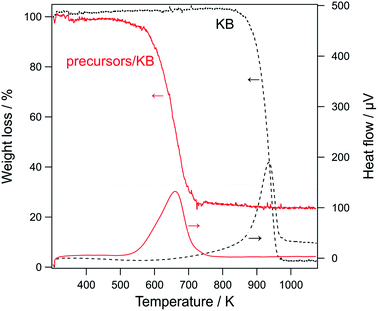
Before the characterization of the formed LCO samples, the combustion of carbons during their calcination was analyzed. Fig. 3 shows the TG/DTA curve of KB and precursor/carbon composites (i.e., lanthanum nitrate and cobalt nitrate accumulated on KB). The TG/DTA curves for other carbons are shown in Fig. S2.† An exothermic peak as well as a large weight loss was observed for all the samples, indicating the combustion of carbon (C + O2 → CO2). For each precursor/carbon composite, the exothermic peak shifted to a much lower temperature than that of the corresponding carbon. These TG/DTA results provide some insights on the combustion process. First, the decrease in the combustion temperature suggests that the metal precursors promoted the combustion of carbons; that is, the precursors acted as catalysts for the oxidation of carbons. Further, it also suggests that the precursors and carbon were in good contact. Second, the TG/DTA data indicate that the carbons were completely combusted at temperatures lower than 850 K in the presence of the precursors. In the PA method, the materials were calcined at 923 K, and the TG/DTA data indicates that this calcination temperature is sufficient for completely removing carbon from the composite.3.3. Characterization of LaCoO3 nanoparticles prepared by the PA method
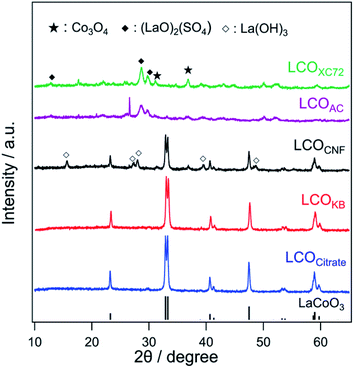
Fig. 4 shows the XRD patterns of LCOKB, LCOCNF, LCOAC, LCOXC-72, and LCOCitrate. For LCOKB and LCOCitrate, only the diffraction peaks of LaCoO3 are observed. This result strongly suggests that the PA method enables the synthesis of LaCoO3 perovskite when KB is used as the support. Further, although the XRD pattern of LCOCNF indicates that LaCoO3 was formed predominantly, it also indicates the formation of small amounts of by-products such as La(OH)3 and Co3O4. In the cases of LCOXC-72 and LCOAC, no diffraction peaks of LaCoO3 are observed; instead, the peaks of (LaO)2(SO4) and Co3O4 are observed. As noted earlier, the S 2p XPS profiles of XC-72 and AC revealed the presence of sulfur species on their surfaces (Fig. 2b). In the PA method, precursors accumulated on the surface of carbon are thermally decomposed; therefore, it is likely that the precursors reacted with the sulfur species on the carbon surface. According to a previous report,50 (LaO)2(SO4) is formed when a mixture of lanthanum nitrate and sodium dodecyl sulfate is calcined in air at 873 K. Hence, it can be deduced that the calcination of the precursor/carbon composites of XC-72 and AC at 923 K in the PA method results in the formation of (LaO)2(SO4).Fig. 5a shows the O 1s XPS profiles of the LCO samples. For LCOKB, LCOCitrate, and LCOCNF, two peaks are observed at 528.8 and 531.5 eV, which can be assigned to the surface lattice oxygen and adsorbed oxygen species, respectively.51–53 In contrast, LCOXC-72 and LCOAC show a peak at ∼532 eV, which is assigned to the oxygen species in sulfate.54 Moreover, in the S 2p XPS profiles (Fig. 5b), a strong peak appeared in the range of 169.0–169.2 eV for LCOXC-72 and LCOAC, which are also assigned to sulfate.54,55 In the Co 2p XPS profiles (Fig. 5c), all the LCO samples show peaks at 780 and 795 eV, corresponding to the Co 2p3/2 and Co 2p1/2 levels of the trivalent cobalt species, respectively.34
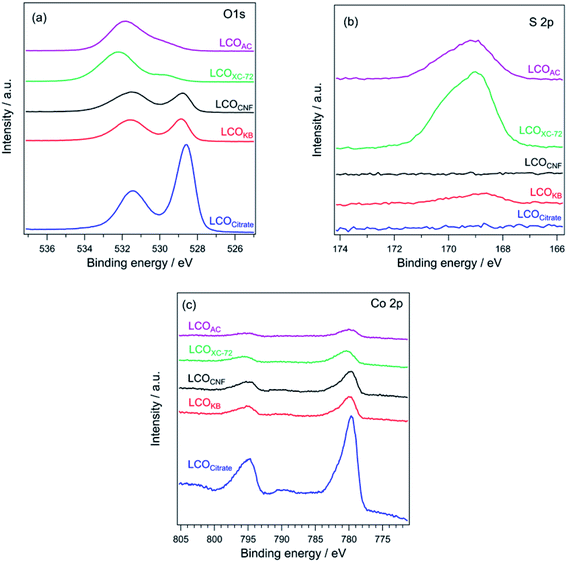 | ||
| Fig. 5 (a) O 1s, (b) S 2p, and (c) Co 2p XPS profiles of LCOCitrate, LCOKB, LCOCNF, LCOXC-72, and LCOAC. | ||
The surface composition and oxidation state determined by XPS are in good agreement with the bulk structure deduced from the XRD patterns (Fig. 4). The diffraction peaks of LaCoO3 were detected in the XRD patterns of LCOKB, LCOCitrate, and LCOCNF, and peaks of surface lattice oxygen and adsorbed oxygen species, which are typical signals for LaCoO3, were observed in the O 1s XPS profiles.51–53 For LCOXC-72 and LCOAC, the XRD patterns revealed the formation of (LaO)2(SO4), and their O 1s and S 2p XPS data indicated the presence of sulfate. Furthermore, the Co 2p XPS profiles of all the LCO samples were similar, despite the different crystalline compounds formed (LaCoO3 for LCOKB, LCOCitrate, and LCOCNF; Co3O4 for LCOXC-72 and LCOAC), because the signals of the trivalent cobalt species in LaCoO3 and Co3O4 are indistinguishable in the Co 2p XPS profiles.52
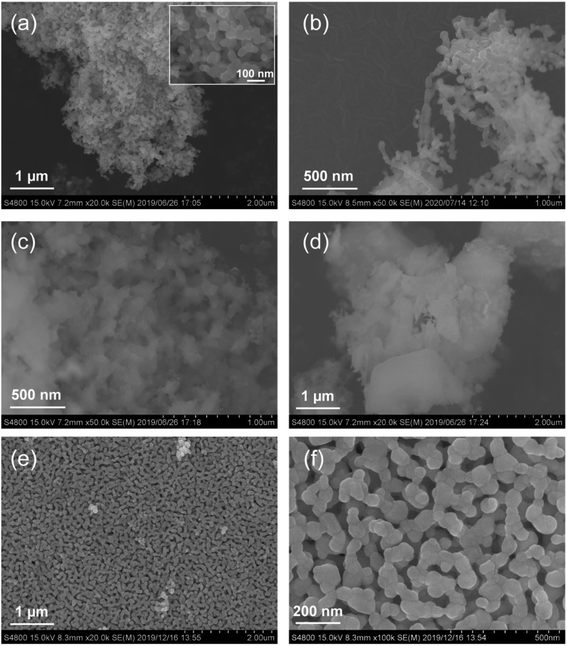
FE-SEM images of the different LCO samples are shown in Fig. 6. LCOKB consists of nanoparticles with a diameter of 10–80 nm. LCOCNF consists of aggregated nanoparticles. In our previous study,40–42,44 the PA method provided nanotubes of oxides such as SiO2 and Al2O3 when CNF was used as the template; however, in the current case, LaCoO3 nanotubes were not formed. It is likely that LaCoO3 sinters more easily than SiO2 and Al2O3, and hence, a aggregated nanoparticle structure was obtained instead of nanotubes. Furthermore, the SEM image of LCOXC-72 shows nanoparticles with morphological features similar to those of the carbon precursor used as the support, XC-72 (Fig. 1c). In the SEM image of LCOAC, large block-like particles are observed, similar to those of the original AC (Fig. 1d). Comparison of the SEM images of the LCO samples and carbons used as supports indicate that the morphology of LCO was influenced by the morphology of the original carbon. The similarity in the morphologies of LCO and carbon support indicates that LCO was formed on the carbon surface. The FE-SEM image of LCOCitrate in Fig. 6e and f reveals that nanoparticles with diameters of less than 100 nm formed a network-like structure, similar to that previously reported for LaCoO3 nanoparticles synthesized by the sol–gel method.56,57 Fig. 7a shows the TEM and electron diffraction pattern of LCOKB. The TEM image clearly shows that LCOKB consists of nanoparticles that are less than 100 nm in size, and the electron diffraction pattern indicates that the nanoparticles are single-crystalline. Further, the STEM and EDX mapping images in Fig. 7b–d reveal that La and Co are homogeneously distributed in the nanoparticles. Thus, the TEM and EDX results suggest that the PA method provides single-crystalline LaCoO3 nanoparticles.
 | ||
| Fig. 7 (a) TEM image and electron diffraction pattern. (b) STEM image and EDX mapping images for (c) La and (d) Co in LCOKB. | ||
The synthesis route of the PA method is fundamentally different from those of other previously reported methods. In the sol–gel method, a gel is formed by interconnecting different precursors with the aid of a complexing ligand (typically, citric acid). This is the key step in the synthesis of perovskite nanoparticles in the sol–gel method. The homogeneously mixed precursor gel allows calcination at a low temperature, facilitating the formation of nanosized complex oxides such as the perovskite. In contrast, the PA method uses nanocarbons instead of the complexing ligands; therefore, no gel was formed. Instead, the precursors intermix at the atomic level during their accumulation on the surface of the nanocarbon supports. Thus, the precursor/nanocarbon composite could be calcined at a low temperature to obtain perovskite nanoparticles.
Furthermore, carbonaceous materials have previously been used to synthesize perovskites. For example, the pores of AC or mesoporous carbon were used to confine precursors and form nanosized oxide (nano-casting method).33,34 In contrast, the PA method does not require the pore structure of carbon; indeed, CNFs that have no pores provided LaCoO3 nanoparticles. Moreover, in our previous work, nanotubes of various oxides were formed via the PA method using CNFs without pores.41,42,44
Fig. S3† shows the nitrogen adsorption/desorption isotherms of the LCO samples. All the samples show a Type II adsorption/desorption isotherm, indicating that the formed LCO has no micro- or mesopores. The specific surface areas of LCOKB, LCOCNF, LCOXC-72, and LCOAC were calculated to be 12, 13, 29, and 9 m2 g−1, respectively, which are comparable to that of LCOCitrate (8 m2 g−1). As shown in Fig. 3 and S2,† TG/DTA analyses indicated that the carbons were completely removed by the calcination process; therefore, it can be inferred that the specific surface areas of the LCO samples were not influenced by the type of carbon used.
Based on the results of various characterizations, the following conclusions can be drawn on the synthesis of LaCoO3 nanoparticles via the PA method:
(1) The surface chemical composition of carbon has a significant influence on the bulk structure of the formed oxides. KB containing no sulfur species provides a pure LaCoO3 phase.
(2) The formed oxide reflects the morphological features of the original carbon support, and LaCoO3 nanoparticles of less than 100 nm size can be synthesized using KB.
(3) From the viewpoint of the specific surface area, the PA method is comparable to conventional synthesis methods.
(4) Based on (1)–(3), the PA method using KB as the support is suitable for preparing LaCoO3 nanoparticles with a high surface area.
3.4. Catalytic activity of LCO in OER
Fig. 8a shows the LSV curve for OER on various LCO samples in 0.1 M KOH saturated with O2. The onset potentials of the LCO samples at the current density of 0.1 mA cm−2 are as follows: 1.51 V (LCOKB), 1.51 V (LCOCitrate), 1.54 V (LCOCNF), 1.59 V (LCOXC-72), and 1.72 V (LCOAC). LCOCitrate and LCOKB exhibited the same onset potentials, indicating that their catalytic activities in OER are similar. For LCOXC-72 and LCOAC, the onset potentials are more positive than those of the other samples. Moreover, the increase in the current density with positive polarization was modest. The LSV curves indicate the following trend of the OER activity of the LCO samples: LCOKB ≈ LCOCitrate ≈ LCOCNF > LCOAC > LCOXC-72. The Tafel plots of the LCO samples are shown in Fig. 8b. The Tafel slopes of LCOCitrate, LCOKB, LCOCNF, LCOAC, and LCOXC-72 are 81, 74, 71, 106, and 107 mV dec−1, respectively. The Tafel slopes of LCOCitrate, LCOKB, and LCOCNF prepared in this study are in the range of the Tafel slope of 70–75 mV dec−1 reported for LaCoO3 nanoparticles.9,58 The Tafel slopes show a similar trend as the LSV results; the high Tafel slopes of LCOAC and LCOXC-72 indicate their low OER activity. Furthermore, the trend of electrochemically active surface area (ECSA) of the LCO samples was similar to that of OER activity (Fig. S4, Table S1†). The chronoamperometry for LCOKB was shown in Fig. S5.† A stable current was observed, which indicates LCOKB has stability for OER.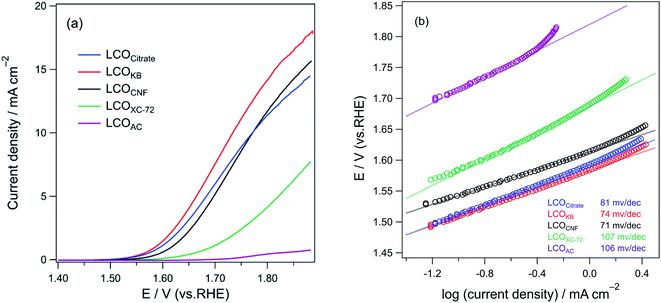 | ||
| Fig. 8 (a) LSV profiles and (b) Tafel plots of LCOCitrate, LCOKB, LCOCNF, LCOXC-72, and LCOAC for OER in an O2-saturated 0.1 M KOH solution. | ||
The OER test results are in good accordance with the results of characterization. LCOCitrate, LCOKB, and LCOCNF showed high activity in OER, because these samples consist of LaCoO3 perovskite nanoparticles. The low activities of LCOXC-72 and LCOAC are due to the formation of (LaO)2(SO4), which is intrinsically not an effective OER catalyst and is low electrical conductivity. The electrochemical analysis suggested that although the PA method is a simple process in which the precursor solution is simply dropped onto nanocarbons and the resulting sample is calcined in air, the formed LaCoO3 sample is comparable to that prepared by the conventional sol–gel method.
The synthesis of LaCoO3 nanoparticles by using only metal precursors and nanocarbon has not been reported. Many of solution-based methods utilized chemical reagents. For example, in the sol–gel method, the key chemical reaction is the formation of a gel with the help of chelating complexes and organic molecules (typically citric acid and ethylene glycol). The solution-based method enables the production of perovskite nanoparticles by low-temperature calcination because the metal cations are uniformly mixed by chemical reactions. In contrast, the PA method does not rely on chemical reactions. The accumulation of precursors on nanocarbon is a physical process; the metal cations are uniformly mixed on the nanocarbon. As a result, the PA method provides nanosized LaCoO3 without the requirements of the precise control of chemical reactions, harsh conditions, and/or special apparatus, indicating that it is a promising process for preparing active OER catalysts on a large scale.
4. Conclusions
We presented a simple synthetic process for LaCoO3 nanoparticles based on the accumulation of precursors on nanocarbon supports. The precursor solution was dropped onto the nanocarbon powder, and then the solvent was evaporated to accumulate the precursors (lanthanum nitrate and cobalt nitrate) on the surface of the nanocarbon. By removing the nanocarbon via the calcination process, single-crystalline LaCoO3 nanoparticles were formed. The type of nanocarbon strongly affected the morphology and structure of the formed oxide. A pure LaCoO3 phase was formed when KB was used as the support. In contrast, AC and XC-72 provided (LaO)2(SO4), because they contained sulfur on their surfaces. The morphology of the formed oxide was found to be similar to that of the carbon used as the support. Nanoparticles (diameter: <100 nm) were obtained upon using KB. The specific surface area of the formed LaCoO3 was found to be comparable to that of the LaCoO3 nanoparticles synthesized by the conventional sol–gel method. The OER activity of the catalysts indicated that LaCoO3 prepared using KB has the same activity as the LaCoO3 nanoparticles prepared by the conventional method. Based on these results, we conclude that the simple PA method would be an effective alternative process for preparing active OER catalysts.Conflicts of interest
There are no conflicts to declare.Acknowledgements
We acknowledge the Comprehensive Analysis Center for Science at the Saitama University for technical support with XRD, SEM, and XPS analyses. This work was supported by JSPS KAKENHI (Grant Number JP18K04832 and JP21H01710). A part of this work was supported by the NIMS microstructural characterization platform as a program of “Nanotechnology Platform” of the Ministry of Education, Culture, Sports, Science and Technology (MEXT), Japan. We thank Ms. Yaguchi for helping OER measurements of LCO samples.References
- Y. Gao, X. Ding, J. H. Liu, L. Wang, Z. K. Lu, L. Li and L. C. Sun, J. Am. Chem. Soc., 2013, 135, 4219–4222 CrossRef CAS PubMed.
- T. Hisatomi, J. Kubota and K. Domen, Chem. Soc. Rev., 2014, 43, 7520–7535 RSC.
- N. T. Suen, S. F. Hung, Q. Quan, N. Zhang, Y. J. Xu and H. M. Chen, Chem. Soc. Rev., 2017, 46, 337–365 RSC.
- S. Ghosh and R. N. Basu, Nanoscale, 2018, 10, 11241–11280 RSC.
- E. Fabbri, A. Habereder, K. Waltar, R. Kotz and T. J. Schmidt, Catal. Sci. Technol., 2014, 4, 3800–3821 RSC.
- Y. Lee, J. Suntivich, K. J. May, E. E. Perry and Y. Shao-Horn, J. Phys. Chem. Lett., 2012, 3, 399–404 CrossRef CAS PubMed.
- Y. Duan, S. N. Sun, S. B. Xi, X. Ren, Y. Zhou, G. L. Zhang, H. T. Yang, Y. H. Du and Z. C. J. Xu, Chem. Mater., 2017, 29, 10534–10541 CrossRef CAS.
- B. H. Han, M. Risch, Y. L. Lee, C. Ling, H. F. Jia and Y. Shao-Horn, Phys. Chem. Chem. Phys., 2015, 17, 22576–22580 RSC.
- J. Kim, X. X. Chen, P. C. Shih and H. Yang, ACS Sustainable Chem. Eng., 2017, 5, 10910–10917 CrossRef CAS.
- D. B. Meadowcroft, Nature, 1970, 226, 847–848 CrossRef CAS PubMed.
- K. A. Stoerzinger, W. S. Choi, H. Jeen, H. N. Lee and Y. Shao-Horn, J. Phys. Chem. Lett., 2015, 6, 487–492 CrossRef CAS PubMed.
- B. Xia, T. Wang, J. Ran, S. Jiang, X. Gao and D. Gao, ACS Appl. Mater. Interfaces, 2021, 13, 2447–2454 CrossRef CAS PubMed.
- Y. Q. Guo, F. C. Lei, J. D. Qi, S. S. Cao, Z. M. Wei, S. S. Lou, P. Hao, J. F. Xie and B. Tang, ACS Sustainable Chem. Eng., 2020, 8, 16711–16719 CrossRef CAS.
- E. Fabbri, M. Nachtegaal, T. Binninger, X. Cheng, B. J. Kim, J. Durst, F. Bozza, T. Graule, R. Schaublin, L. Wiles, M. Pertoso, N. Danilovic, K. E. Ayers and T. J. Schmidt, Nat. Mater., 2017, 16, 925–931 CrossRef CAS PubMed.
- K. J. May, C. E. Carlton, K. A. Stoerzinger, M. Risch, J. Suntivich, Y. L. Lee, A. Grimaud and Y. Shao-Horn, J. Phys. Chem. Lett., 2012, 3, 3264–3270 CrossRef CAS.
- J. Suntivich, K. J. May, H. A. Gasteiger, J. B. Goodenough and Y. Shao-Horn, Science, 2011, 334, 1383–1385 CrossRef CAS PubMed.
- C. H. Zhao, N. Li, R. Z. Zhang, Z. Q. Zhu, J. H. Lin, K. F. Zhang and C. J. Zhao, ACS Appl. Mater. Interfaces, 2019, 11, 47858–47867 CrossRef CAS PubMed.
- K. Rong, J. L. Wei, L. Huang, Y. X. Fang and S. J. Dong, Nanoscale, 2020, 12, 20719–20725 RSC.
- N. Li, J. J. Guo, Y. W. Ding, Y. Q. Hu, C. H. Zhao and C. J. Zhao, ACS Appl. Mater. Interfaces, 2021, 13, 332–340 CrossRef CAS PubMed.
- X. Cao, X. Yan, L. Ke, K. Zhao and N. Yan, ACS Appl. Mater. Interfaces, 2021, 13, 22009–22016 CrossRef CAS PubMed.
- F. F. Dong, L. Li, Z. Q. Kong, X. M. Xu, Y. P. Zhang, Z. H. Gao, B. K. Dongyang, M. Ni, Q. B. Liu and Z. Lin, Small, 2021, 17 Search PubMed.
- M. S. G. Baythoun and F. R. Sale, J. Mater. Sci., 1982, 17, 2757–2769 CrossRef CAS.
- A. E. Danks, S. R. Hall and Z. Schnepp, Mater. Horiz., 2016, 3, 91–112 RSC.
- M. P. Pechini, Method for preparing lead and alkaline earth titanates and niobates and coating method using the same to form a capacitor, US Pat. 3330697, 1967.
- Y. Teraoka, H. Kakebayashi, I. Moriguchi and S. Kagawa, J. Alloys Compd., 1993, 193, 70–72 CrossRef CAS.
- M. M. Natile, E. Ugel, C. Maccato and A. Glisenti, Appl. Catal., B, 2007, 72, 351–362 CrossRef CAS.
- G. Pecchi, P. Reyes, R. Zamora, C. Campos, L. E. Caduus and B. P. Barbero, Catal. Today, 2008, 133, 420–427 CrossRef.
- S. Royer, F. Berube and S. Kaliaguine, Appl. Catal., A, 2005, 282, 273–284 CrossRef CAS.
- G. L. Chiarello, I. Rossetti and L. Forni, J. Catal., 2005, 236, 251–261 CrossRef CAS.
- A. Heel, P. Holtappels, P. Hug and T. Graule, Fuel Cells, 2010, 10, 419–432 CrossRef CAS.
- B. J. Kim, E. Fabbri, D. F. Abbott, X. Cheng, A. H. Clark, M. Nachtegaal, M. Borlaf, I. E. Castelli, T. Graule and T. J. Schmidt, J. Am. Chem. Soc., 2019, 141, 5231–5240 CrossRef CAS PubMed.
- M. M. Nair, S. Kaliaguine and F. Kleitz, ACS Catal., 2014, 4, 3837–3846 CrossRef CAS.
- T. Valdes-Solis, G. Marban and A. B. Fuertes, Chem. Mater., 2005, 17, 1919–1922 CrossRef CAS.
- Y. G. Wang, J. W. Ren, Y. Q. Wang, F. Y. Zhang, X. H. Liu, Y. Guo and G. Z. Lu, J. Phys. Chem. C, 2008, 112, 15293–15298 CrossRef CAS.
- Y. B. Mao, S. Banerjee and S. S. Wong, Chem. Commun., 2003, 408–409 RSC.
- M. Niederberger, G. Garnweitner, N. Pinna and M. Antonietti, J. Am. Chem. Soc., 2004, 126, 9120–9126 CrossRef CAS PubMed.
- X. Wang, J. Zhuang, Q. Peng and Y. D. Li, Nature, 2005, 437, 121–124 CrossRef CAS PubMed.
- W. J. Zheng, R. H. Liu, D. K. Peng and G. Y. Meng, Mater. Lett., 2000, 43, 19–22 CrossRef CAS.
- Y. J. Han, Z. J. Zhu, L. Huang, Y. J. Guo, Y. L. Zhai and S. J. Dong, Nanoscale, 2019, 11, 19579–19585 RSC.
- H. Ogihara, S. Masahiro, Y. Nodasaka and W. Ueda, J. Solid State Chem., 2009, 182, 1587–1592 CrossRef CAS.
- H. Ogihara, M. Sadakane, Y. Nodasaka and W. Ueda, Chem. Mater., 2006, 18, 4981–4983 CrossRef CAS.
- H. Ogihara, M. Sadakane, Y. Nodasaka and W. Ueda, Chem. Lett., 2007, 36, 258–259 CrossRef CAS.
- H. Ogihara, M. Sadakane, Q. Wu, Y. Nodasaka and W. Ueda, Chem. Commun., 2007, 4047–4049, 10.1039/b708038g.
- H. Ogihara, N. Usui, M. Yoshida-Hirahara and H. Kurokawa, Langmuir, 2020, 36, 2829–2836 CrossRef CAS PubMed.
- S. Biniak, G. Szymanski, J. Siedlewski and A. Swiatkowski, Carbon, 1997, 35, 1799–1810 CrossRef CAS.
- G. X. Zhang, S. H. Sun, D. Q. Yang, J. P. Dodelet and E. Sacher, Carbon, 2008, 46, 196–205 CrossRef CAS.
- U. Zielke, K. J. Huttinger and W. P. Hoffman, Carbon, 1996, 34, 983–998 CrossRef CAS.
- K. E. Swider and D. R. Rolison, J. Electrochem. Soc., 1996, 143, 813–819 CrossRef CAS.
- G. Tamizhmani and G. A. Capuano, J. Electrochem. Soc., 1994, 141, L132–L134 CrossRef CAS.
- D. J. Zhang, T. Kawada, F. Yoshioka and M. Machida, ACS Omega, 2016, 1, 789–798 CrossRef CAS PubMed.
- M. Imamura, N. Matsubayashi and H. Shimada, J. Phys. Chem. B, 2000, 104, 7348–7353 CrossRef CAS.
- Y. X. Liu, H. X. Dai, J. G. Deng, L. Zhang, Z. X. Zhao, X. W. Li, Y. Wang, S. H. Xie, H. G. Yang and G. S. Guo, Inorg. Chem., 2013, 52, 8665–8676 CrossRef CAS PubMed.
- A. Machocki, T. Ioannides, B. Stasinska, W. Gac, G. Avgouropoulos, D. Delimaris, W. Grzegorczyk and S. Pasieczna, J. Catal., 2004, 227, 282–296 CrossRef CAS.
- H. Aono, M. Sakamoto and Y. Sadaoka, J. Ceram. Soc. Jpn., 2000, 108, 1052–1059 CrossRef CAS.
- Y. F. Zhu, R. Q. Tan, J. Feng, S. S. Ji and L. L. Cao, Appl. Catal., A, 2001, 209, 71–77 CrossRef CAS.
- M. Popa and M. Kakihana, Solid State Ionics, 2002, 151, 251–257 CrossRef CAS.
- K. T. C. Roseno, R. Brackmann, M. A. da Silva and M. Schmal, Int. J. Hydrogen Energy, 2016, 41, 18178–18192 CrossRef CAS.
- J. O. Bockris and T. Otagawa, J. Phys. Chem., 1983, 87, 2960–2971 CrossRef CAS.
Footnote |
| † Electronic supplementary information (ESI) available. See DOI: 10.1039/d1ra03762e |
| This journal is © The Royal Society of Chemistry 2021 |


