
 Open Access Article
 This Open Access Article is licensed under a Creative Commons Attribution-Non Commercial 3.0 Unported Licence
Critical biodegradation process of a widely used surfactant in the water environment: dodecyl benzene sulfonate (DBS)†
Yu Gu ,
Yanting Qiu‡
,
Xiuyi Hua,
Zhimin Shi§
,
Anfeng Li,
Yang Ning and
Dapeng Liang*
,
Yanting Qiu‡
,
Xiuyi Hua,
Zhimin Shi§
,
Anfeng Li,
Yang Ning and
Dapeng Liang*
Key Lab of Groundwater Resource and Environment, Ministry of Education, College of New Energy and Environment, Jilin University, Changchun, 130012, China. E-mail: liangdp@jlu.edu.cn
First published on 7th June 2021
Abstract
Sodium dodecyl benzene sulfonate (DBS) is a widely used surfactant that is now found extensively in water bodies because of anthropogenic emissions. Since the degradation of DBS in the environment mainly relies on microorganisms, it is essential to study the mechanism by which DBS is biodegraded. In this study, Chlorella vulgaris was used to research the biodegradation process of DBS. The C. vulgaris suspension was centrifuged to remove the supernatant, then secondary deionized water and DBS were added to the C. vulgaris. And the intermediate products were detected in real time by electrospray ionization mass spectrometry (ESI-MS). Some novel intermediate products, including 4-sodium sulfophenyldodecanoate acid and its homologs, were detected that had not been mentioned in previous studies. In this work, the process of DBS degradation was indicated, which consisted of three main steps: chain-shorting oxidation, ring-opening oxidation of benzene rings, and degradation of small molecules. By investigating the process of DBS degradation by C. vulgaris, we were able to propose a preliminary mechanism of DBS biodegradation, which is of great significance for research on the migration and conversion of surfactants in the environment.
1. Introduction
Sodium dodecyl benzene sulfonate (DBS) is a typical surfactant that is widely used in industry, such as food processing, pharmaceutical, cosmetics, and papermaking industries;1 it also is used in geoponics2 and daily chemical products.3 Globally, surfactant consumption reached almost 9![[thin space (1/6-em)]](https://www.rsc.org/images/entities/char_2009.gif) 000000 tons in the mid-1990s,4 and it is expected that the yearly amount of surfactants used will quadruple by 2050.5 Because of their widespread industrial applications, numerous surfactants are discharged into the environment where they cause pollution,6–10 such as reducing dissolved oxygen in water11 and affecting the survival of aquatic organisms.12 Further, DBS and other surfactants are known to adversely affect human health; for example, some surfactants can anaesthetize the eyeball13 or cause dermatitis and aphthous,14 yet there is no established link between using products containing these surfactants and the risk of cancer.15 In the microbial world, DBS have deleterious effects on various bacteria such as the phosphate-solubilizing Acinetobacter junii.16 Klebensberger's research proved that damaged DNA and starvation were found as counterparts even in bacteria capable of utilizing DBS as sole carbon source.17 Given their wide distribution in natural water systems, the degradation of DBS in the environment mainly relies on microorganisms, including bacteria and algae.18 For this reason, it is essential to study the mechanism by which DBS is biodegraded.
000000 tons in the mid-1990s,4 and it is expected that the yearly amount of surfactants used will quadruple by 2050.5 Because of their widespread industrial applications, numerous surfactants are discharged into the environment where they cause pollution,6–10 such as reducing dissolved oxygen in water11 and affecting the survival of aquatic organisms.12 Further, DBS and other surfactants are known to adversely affect human health; for example, some surfactants can anaesthetize the eyeball13 or cause dermatitis and aphthous,14 yet there is no established link between using products containing these surfactants and the risk of cancer.15 In the microbial world, DBS have deleterious effects on various bacteria such as the phosphate-solubilizing Acinetobacter junii.16 Klebensberger's research proved that damaged DNA and starvation were found as counterparts even in bacteria capable of utilizing DBS as sole carbon source.17 Given their wide distribution in natural water systems, the degradation of DBS in the environment mainly relies on microorganisms, including bacteria and algae.18 For this reason, it is essential to study the mechanism by which DBS is biodegraded.
The degradation of DBS has been proposed by many investigators. Beltran found the high oxidizing capacity of ozone capable of decreasing the concentration of surfactants in drinking water,19 and later O3-based or H2O2-based oxidation methods were shown to increase the removal rate of DBS in water samples in work by Rivera-Utrilla.20 Both TiO2 and UV light can break the alkyl chain of DBS,21 and the addition of either H2O2 or Fe2+ to an ultrasonic irradiation system can enhance the removal of DBS.22,23 Some algae and bacteria were also used to study the kinetics model of DBS degradation.24–26 Several methods are used to detect the concentration of DBS in water samples, such as methylene blue colourimetry,27 liquid chromatography-mass spectrometry (LC-MS),28 and indirect atomic absorption spectroscopy.29 However, these detection methods require much time to prepare the samples and the use of toxic chemical reagents such as trichloromethane may harm both the experimenter and the environment. Moreover, there are relatively few studies devoted to the degradation process per se and its intermediate products; some researchers have suggested probable intermediate products but without sufficient evidence to prove their conjecture due to inherent limits of the analytical methods used.24,30–32 Therefore, establishing an accurate detection method of the intermediate products of DBS and using it to investigate the biodegradation process of DBS is essential.
Algae and biofilm are able to degrade many organic pollutants,33–35 including DBS, for which photosynthesis by algae is the main contributing factor.36 Chlorella vulgaris, which belongs to the phylum Chlorophyta, is spherical or ellipsoid in shape and 3–12 μm in diameter.37 It has been proven that C. vulgaris is the dominant algae species of biofilm cultivated in natural water systems,38 so C. vulgaris is usually selected as a kind of representative algae by researchers. O'Toole defines biofilm as a single microbial species or multiple microbial species that form on a range of biotic and abiotic surfaces.39 Biofilm is widely distributed on stones and surface sediment in rivers, pools, and wetlands,40 having a composition that includes algae, bacteria, and minerals.41 The application of biofilm has been the subject of myriad studies. Notably, Mezohegyi demonstrated biofilm's ability to remove colour from textile wastewaters via its combined action with active carbon.42 Studies have shown that C. vulgaris can accelerate the degradation of chlortetracycline under light conditions, and 1O2 contributes to the degradation process.43,44 According to previous research reported, wastewater containing Chlorella pyrenoidosa can reduce nitrogen and phosphorus emissions and increase the consumption of organic matter.45
Using an electrospray ionization (ESI) source as a soft ionization method was first put forth by Fenn.46 Since then, electrospray ionization mass spectrometer (ESI-MS) and other derived ESI-MS based technologies have gained wider use for the detection of a complex matrix.47–50 In our study here, we used ESI-MS to establish a detection method and study the intermediate products of a complex system, namely the DBS solution degraded by C. vulgaris. First, a light simulation system was built to simulate a natural water system. Then, a detection method for DBS based on ESI-MS was established. Finally, a collision-induced dissociation experiment (CID)51 was used to identify the molecular structure of the intermediate products. In this study, DBS was chosen because of its known environmental hazards and its nonvolatile and non-photodegradation properties.36 Our study applies mass spectrometry to the dynamic monitoring of the degradation of DBS by C. vulgaris to determine the degradation products and infer the degradation products. A method based on mass spectrometry to determine the degradation products of organic pollutants can determine the degradation products of organic pollutants in polluted water when the composition of the water sample is unknown. The study of intermediate products and degradation processes will provide an indication of the stage of bioremediation of polluted water bodies. Many other organic pollutants degraded by algae will be studied in further work based on this method, which should promote more research into the biodegradation of organic pollutants. At the same time, expand the application of mass spectrometry in environmental chemistry, and provide new ideas for future environmental chemistry research.
2. Materials and methods
2.1 Materials and reagents
Sodium dodecyl benzene sulfonate was purchased from Shanghai Macklin Biochemical Co., China (analytical grade). Methanol was of high-performance liquid chromatography (HPLC) grade and bought from ROE Scientific Inc. (Newark, USA). Secondary deionized water was purified by the Milli-Q water purification system (Milli-Q Academic, USA). Its conductivity: ≤0.01 mS m−1 and absorbance (254 nm, 1 cm path length): ≤0.001. Chlorella vulgaris (FACHB-1068) was purchased from the Freshwater Algae Culture Collection at the Institute of Hydrobiology. Haemocytometer was purchased from Shanghai Qiujing Biochemical Reagent Instrument Co., China (XB.K. 25). Natural water was collected from East Lake at Jilin University, China.2.2 Experimental design
000 rpm for 5 min, and its supernatant was diluted 10000 times for detection by ESI-MS.000 rpm for 2 min. The ensuing supernatant was discarded and then secondary deionized water added to the algae. The total volume of the mixture of algae and secondary deionized water was adjusted to 1 L. Then two (2) mg of DBS powder was added to 1 L mixture of algae and secondary deionized water. Put it into the light simulation system. Then the same experimental procedure described in Section 2.2.1 was followed.Microscope photography of the C. vulgaris used in the experiment (Fig. S8†) showed its cells to be green in colour and almost round in shape. The haemocytometer was used to determine the cell density of the C. vulgaris suspension. A 20 microlitres of the C. vulgaris suspension was aspirated with a micropipette, and the haemocytometer was filled. Manual counting of C. vulgaris cells on the haemocytometer was then performed under light microscopy. The cell density of the C. vulgaris suspension was calculated as 1.7 × 10⁸ cells per millilitre. Therefor the cell density of the 2 mg L−1 DBS solution used in subsequent experiments was 8.5 × 10⁶ cells per millilitre. A 50 mL C. vulgaris suspension was taken and centrifuged at 10000 rpm for 2 min. The ensuing supernatant was discarded and then secondary deionized water added to the algae. The total volume of the mixture of algae and secondary deionized water was adjusted to 1 L. Put it into the light simulation system. Then the same experimental procedure described in Section 2.2.1 was followed.
To ensure the data reliability, each experiment was repeated until obtain at least 3 consistent results.
3. Results and discussion
3.1 The detection of DBS samples by ESI-MS
The optimization of the experimental conditions and the quantitative analysis are detailed in the ESI.† Briefly, the DBS solution was first detected (Fig. 1A), and, to determine the characteristic peak of DBS, secondary deionized water was also detected (Fig. 1B). Comparing Fig. 1A and B, two new ion peaks of m/z 325.18538 and m/z 311.16982 were present in Fig. 1A. This proves that these two ion peaks are caused by the addition of DBS. The ion peak m/z 325.18538 was determined to be the characteristic peak of DBS. Some previous studies used LC-ESI-MS to obtain the ion peaks of surfactants, including linear alkylbenzene sulfonate (LAS), which is similar to DBS in terms of its chemical structure. Fig. 1A result is similar that reported in previous studies.52,53 In our experiment the signal-to-noise ratio (S/N) of m/z 325.18538 was good. Because DBS is difficult to purify and some homologues such as undecyl benzene sulfonate also exist, the ion peak m/z 311.16982 formed (Fig. 1A).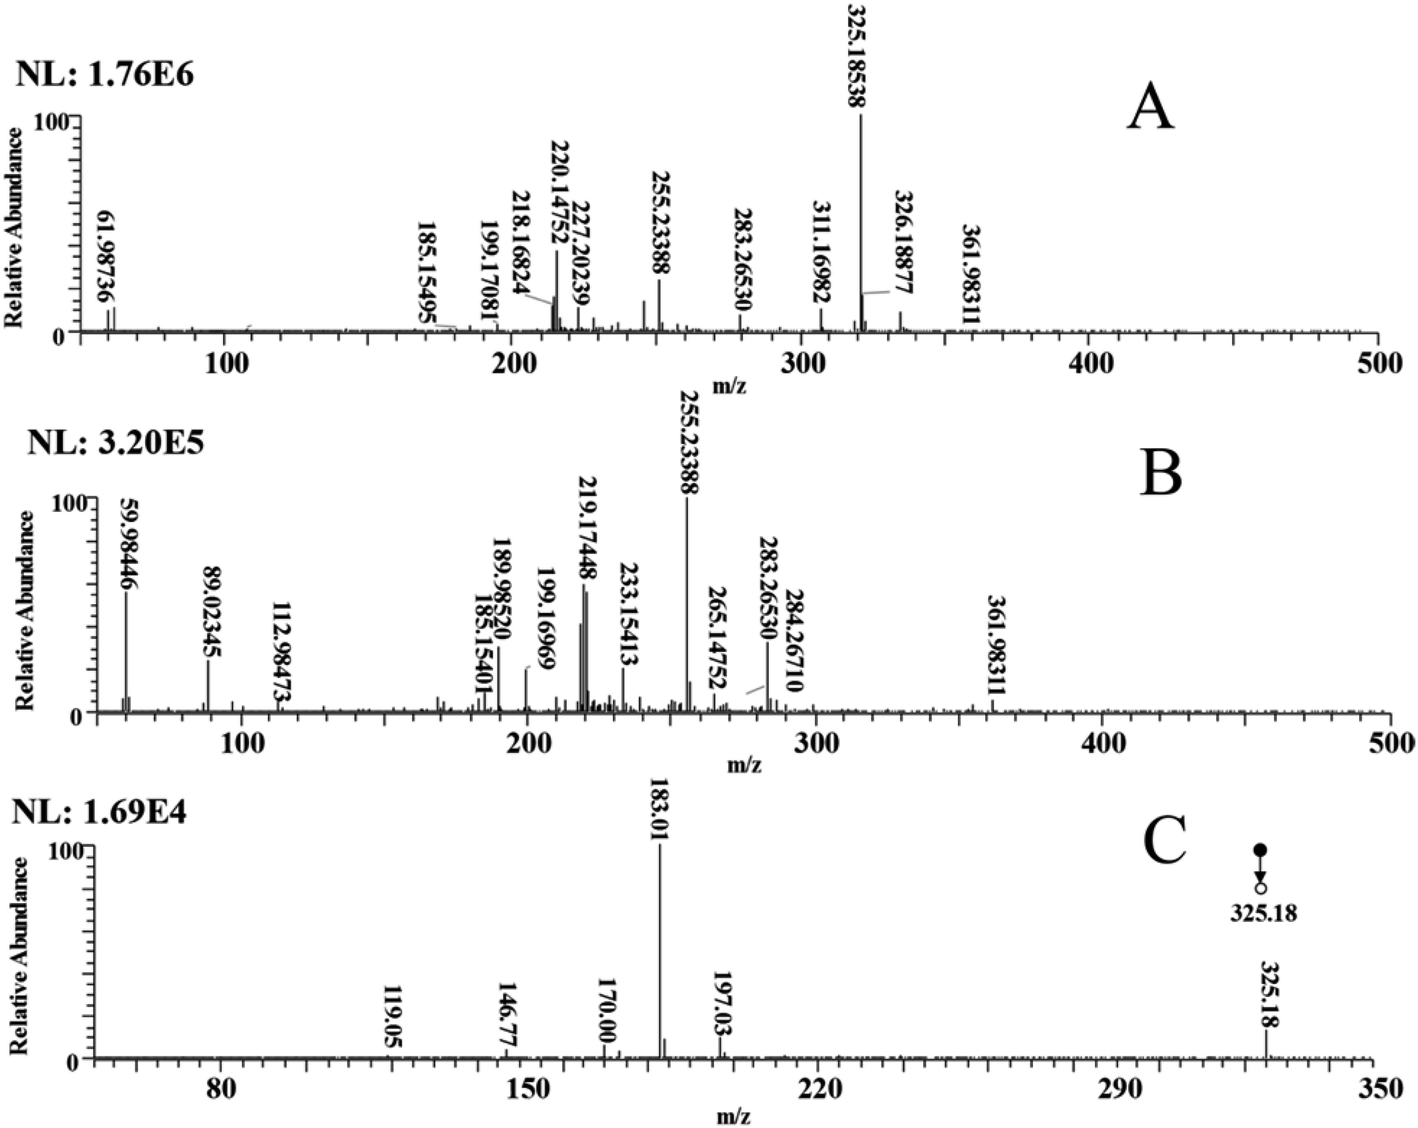 | ||
| Fig. 1 The electrospray ionization mass spectrometry (ESI-MS) spectra of dodecyl benzene sulfonate (DBS) standard solution (A), the secondary deionized water (B), and the MS2 spectrum of ion m/z 325.18 (C). | ||
The MS/MS (MS2) method was utilized to further enhance the identification of DBS. In the MS2 mass spectrum of DBS (Fig. 1C), the deprotonated DBS easily formed the ion at m/z 183.01 ([DBS–C10H22–Na]−), by losing a C10H22 molecule and a C9H20 molecule to generate the ion at m/z 197.03 ([DBS–C9H20–Na]−). Hence, the DBS in the water sample was successfully detected via ESI-MS, and m/z 183.01 was chosen as the quantitative peak to establish the DBS detection method.
3.2 Detection of mixed samples of DBS and C. vulgaris by ESI-MS
In the negative mode, the DBS solution at different degradation time points was detected by ESI-MS, and the first-order mass spectrum of m/z 50–500 was obtained. As Fig. 2 shows, MS spectra at 0 h, 6 h, and 12 h differed in their ion peaks during the degradation of DBS. An ion peak represents a substance. The comparison of the mass spectra at 0 hour, 6 hours and 12 hours is to prove whether there are new products in the samples at 6 hours and 12 hours. To clarify these slight differences, the m/z at 100–120, m/z 200–280, and m/z 340–360 were each magnified 10 times.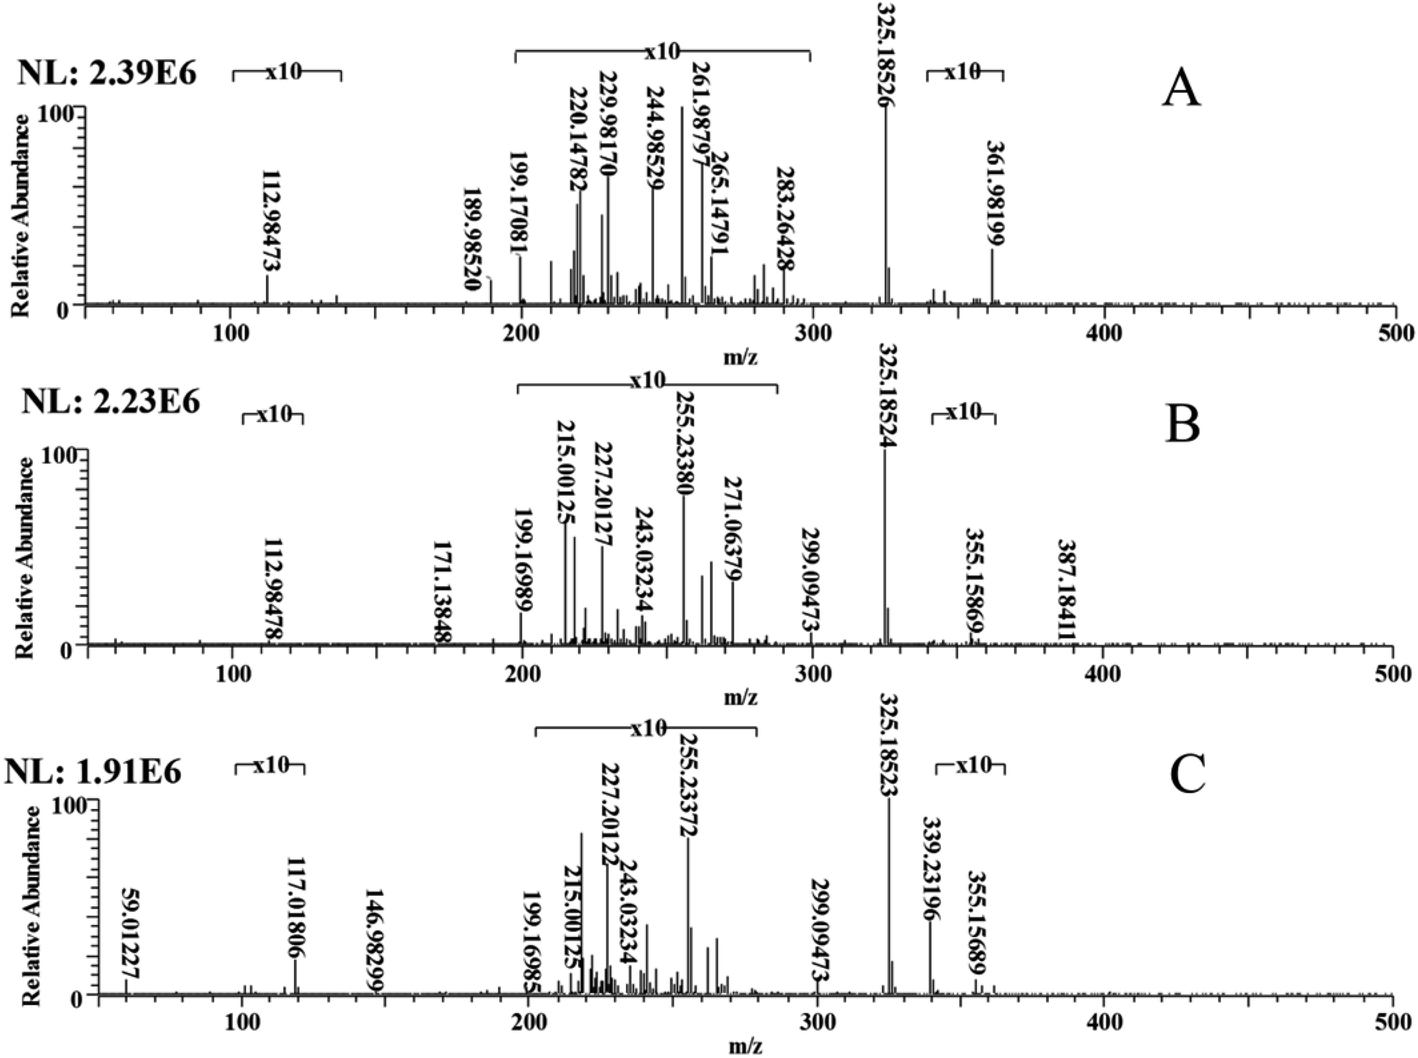 | ||
| Fig. 2 The ESI-MS spectra of mixed samples of DBS and C. vulgaris at 0 h (A), 6 h (B), and 12 h (C). | ||
This evinced that the main differences happened at m/z 200–280, though a few differences were also seen in m/z 340–360. This indicates that new products were detected in the 6 hour and 12 hour samples. The new product detected indicates that DBS has been degraded by C. vulgaris. By comparing Fig. 2A and B, we can find that some new ion peaks appear in Fig. 2B, such as m/z 355.15869, m/z 299.09473, m/z 271.06379, m/z 243.03234, m/z 215.00125, m/z 171.13848. This indicates that DBS has been degraded into some macromolecular degraded products. By comparing Fig. 2B and C, we can find that some new ion peaks appear in Fig. 2B, such as m/z 146.98299, m/z 117.01806, m/z 59.01227. This indicates that macromolecular degraded products are further degraded into small molecule degraded products. Previous studies have shown that the degradation products of DBS include sodium benzoate, benzene, benzoic acid and 4-hydroxybenzenesulfonic acid, which are consistent with the above ion peaks.54,55
3.3 Detection of C. vulgaris samples by ESI-MS
The C. vulgaris used during the degradation process were analysed to ensure these intermediate products did come from the degradation of DBS and not from the C. vulgaris. The latter's MS spectra at 0 h, 6 h, and 12 h during the degradation are shown in Fig. 3; to better convey the differences among them, m/z 50–500 was chosen. By comparing Fig. 3A–C, it can be found that a new ion peak m/z 435.87421, m/z 355.20634, m/z 146.98192 appears in Fig. 3B, and a new ion peak m/z 449.17163, m/z 402.22677, m/z 375.20839, m/z 96.95910 appears in Fig. 3C. This indicates that the metabolism of the C. vulgaris has also produced some new products. The ion peak mentioned in Section 3.2 does not appear here, which indicates that the ion peak in Section 3.2 is produced by the degradation of DBS, rather than the metabolism of the C. vulgaris. However, the ion peak of DBS (m/z 325.18538) was present, since DBS easily attaches to the cells of this algae species.56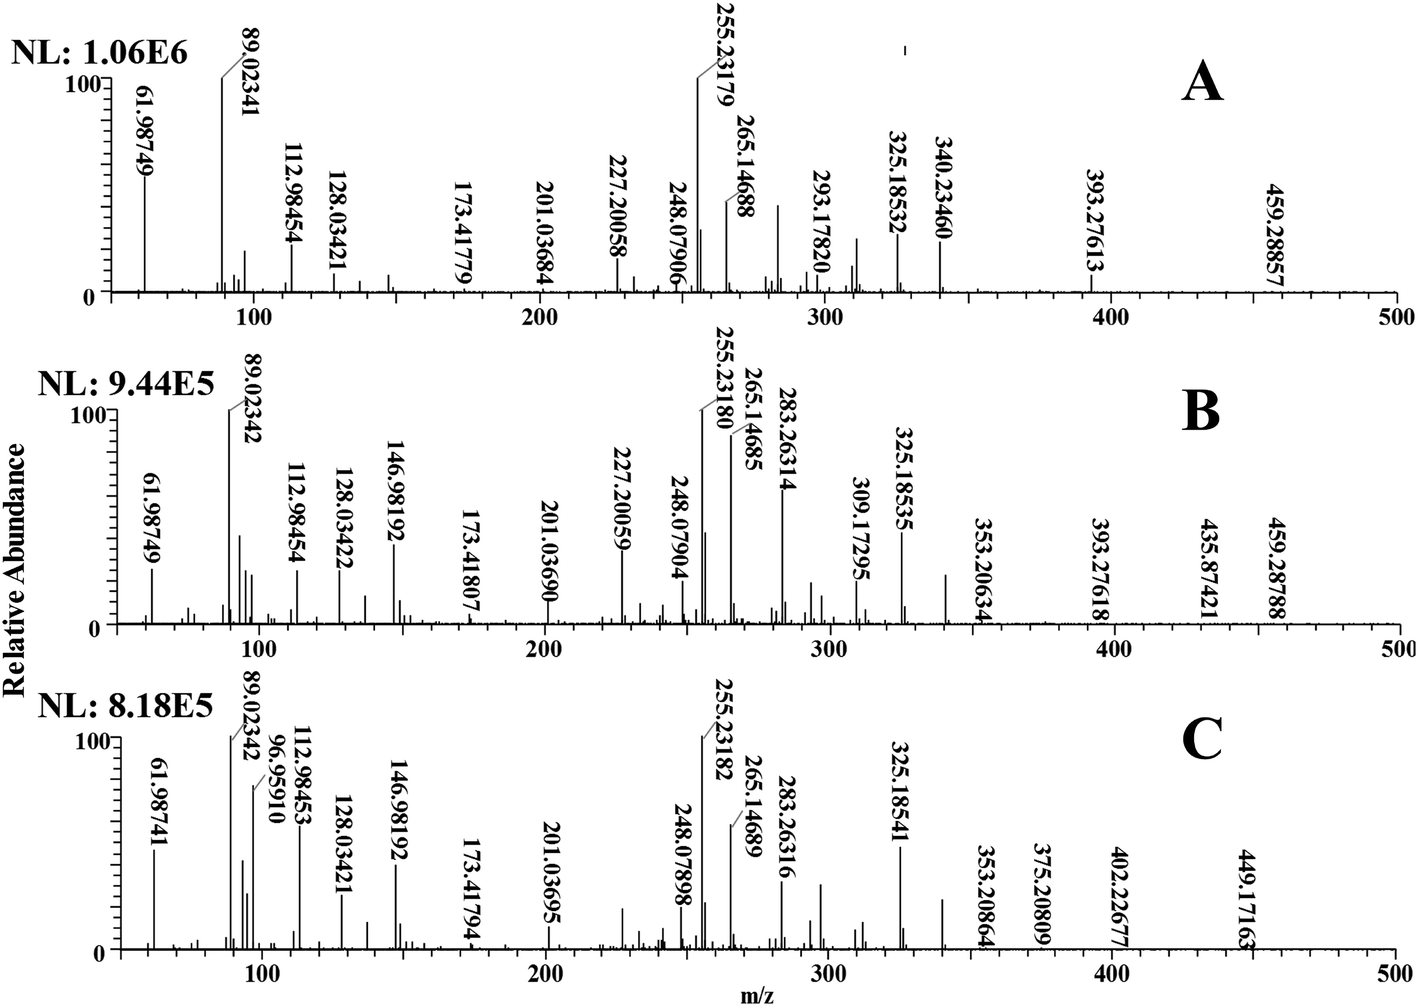 | ||
| Fig. 3 The MS spectra of Chlorella vulgaris sample at 0 h (A), 6 h (B), and 12 h (C). | ||
3.4 Analysis of biodegradation intermediate products by ESI-MS
Perform collision-induced dissociation (CID) experiment on the ion peaks in Section 3.2 (i.e., following the MS2 method) was carried out to determine the intermediate products and to analyse the feature fragment information of these ions. From this, we inferred that m/z 299.09473 represents 4-sodium sulfophenyldodecanoate acid, m/z 215.00125 corresponds to the characteristic peak of 4-sodium sulfobenzoic acid, while m/z 117.01806 is butanedioic acid. Further, m/z 215.00125, m/z 243.03234, m/z 271.06379, m/z 299.09473, m/z 327.12720, and m/z 355.15869 were detected in the reaction system, having characteristic fragment ions similar to m/z 299.09473, and identified as homologs. From the CID experimentation applied to m/z 355.15869, m/z 327.12720, m/z 299.09473, m/z 271.06379, and m/z 243.03234, the MS2 spectra of these ions were obtained (Fig. S4†), as were those for m/z 215.00125, m/z 200.98528, m/z 121.02892 and m/z 117.01806 (Fig. S5†). It is inferred that these compounds are related to DBS because of the similar ion peaks among the MS2 spectra and the benzene ring in the molecule from DBS.3.5 Detection of mixed samples of DBS and natural water by ESI-MS
In order to determine whether the degradation process exists in natural waters, ESI-MS was used to detect the mixed samples of DBS and natural water. The MS spectra for DBS degraded in natural (field) water at 0 h and 12 h are shown in Fig. 4, from which several ion peaks including m/z 355.15875 and m/z 299.09452 were detected. This is consistent with the ion peak in Section 3.2. However, because of their low concentrations, the ion peaks of some small molecules including m/z 146.98299 and m/z 117.01806 are were not detected.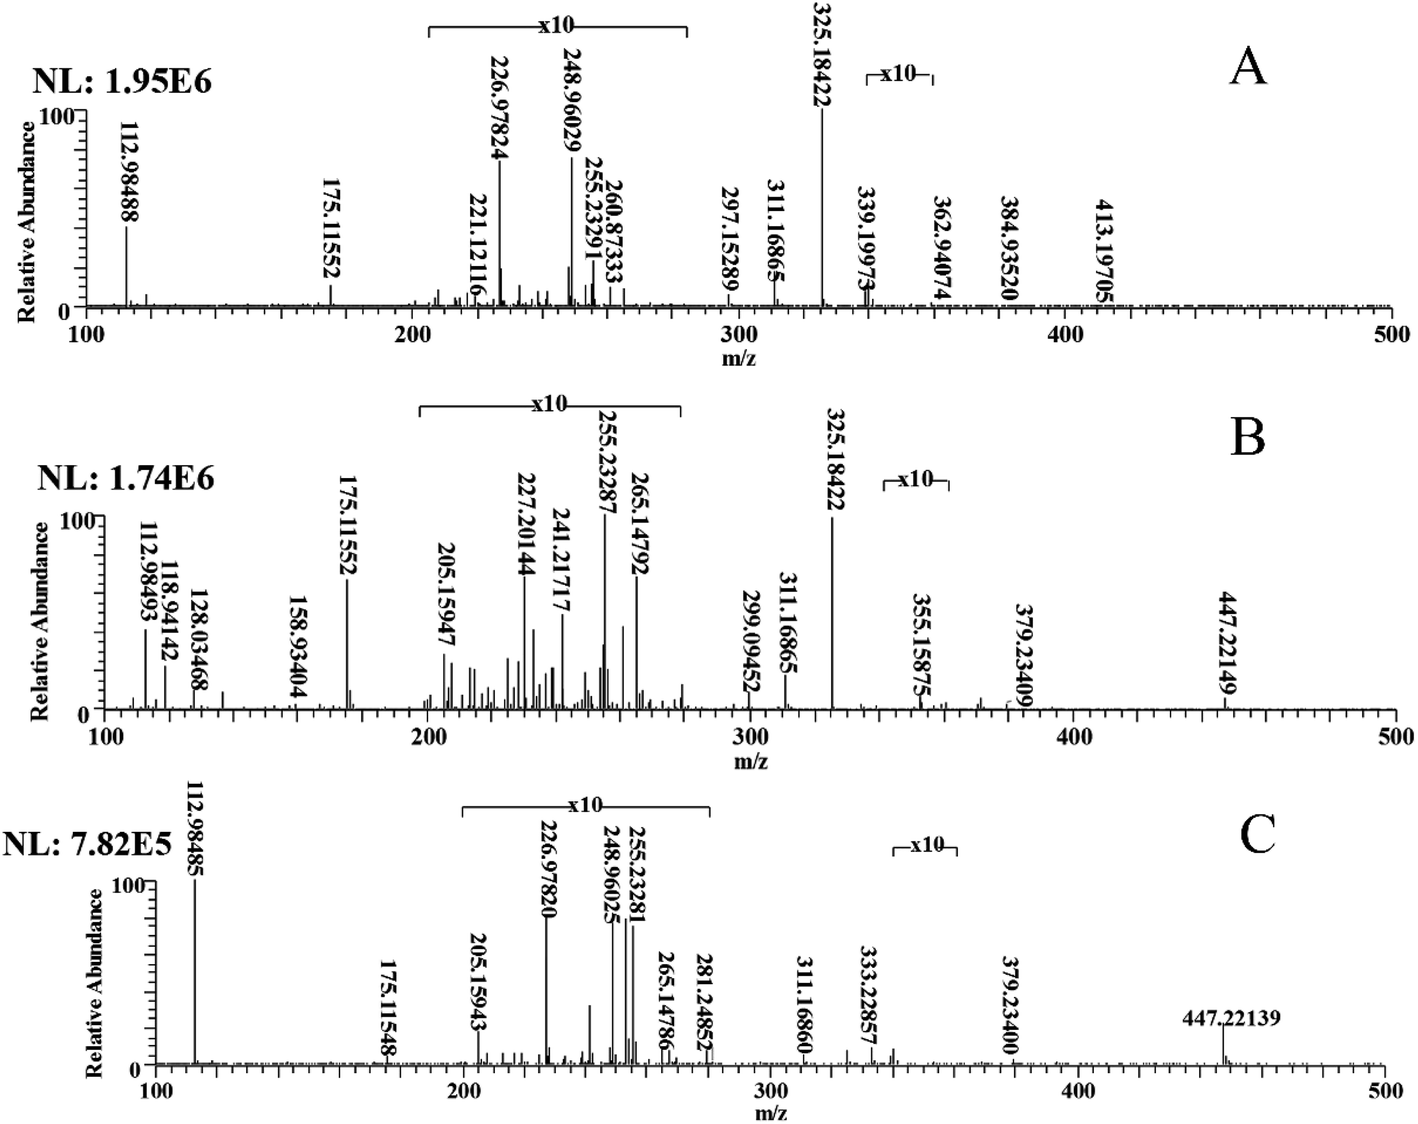 | ||
| Fig. 4 The MS spectra of mixed samples of DBS and natural water at 0 h (A) 12 h (B), and the blank control (C). | ||
3.6 The changed amount of DBS during its degradation process
To describe the changed amount of DBS during its degradation process, the signal intensity of the intermediate product was used as the evaluation standard. Fig. 5A and B show the signal intensity of every intermediate product during the degradation process. Evidently the homologs of 4-sodium sulfophenyldodecanoate acid (m/z 355.15869) displayed similar regularity (Fig. 5A), which is degraded DBS that had stabilized after 8 h, while the small molecule products that arose during its degradation are depicted in Fig. 5B. The reason why these curves start to appear after 0 h is that DBS has not been degraded by C. vulgaris at 0 h, so these ion peaks not appear at 0 h. The intermediate product benzoic acid (m/z 121.02982) shows the same regular with the homologs of 4-sodium sulfophenyldodecanoate acid, whereas ethanoic acid (m/z 59.01227) did not show a clear regularity. It may be so because the signal intensity is quite close to the detection limit, rendering the change unstable.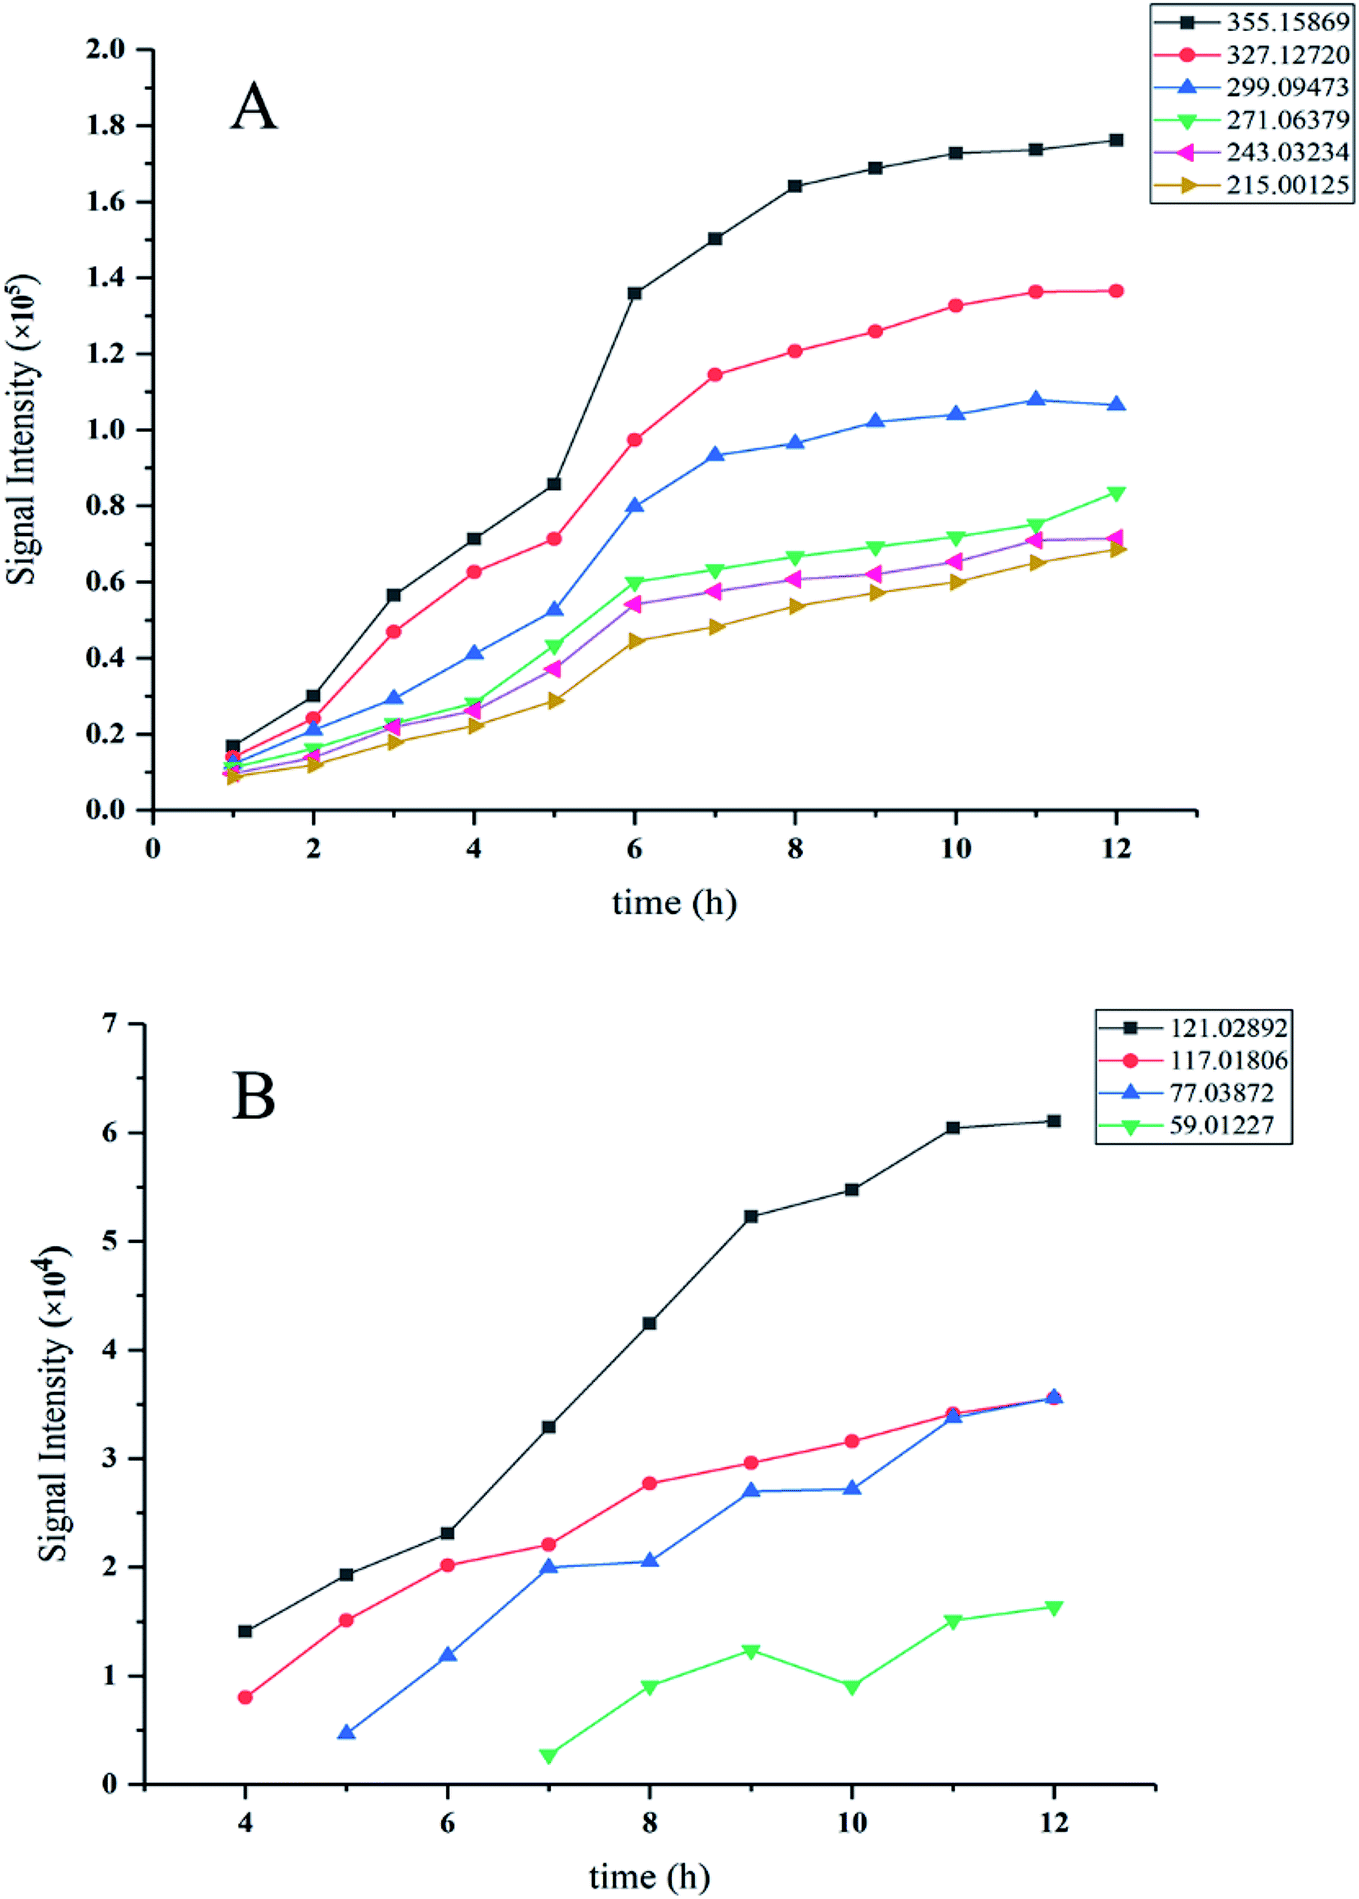 | ||
| Fig. 5 Signal intensities of the intermediate products: (A) signal intensity of m/z 355.15869, m/z 327.12720, m/z 299.09473, m/z 271.06379, m/z 243.03234, and m/z 215.00125; (B) the signal intensity of m/z 121.02892, m/z 117.01806, m/z 77.03872, and m/z 59.01227. | ||
The homologs in Fig. 5A are the products of aliphatic long-chain cleavage and oxidization. Since they show the same change regular of m/z 355, both acetic acid (m/z 59.01227) and butane dioic acid (m/z 117.01806) were also determined, which had formed when the benzene ring was disrupted and oxidized. Combining the Fig. 3 results with those of Fig. 5A and B, it is highly likely that some small molecular-weight intermediate products were the products of 4-sodium sulfophenyldodecanoate acid and its homologs. This was inferred by their change being similar to that of 4-sodium sulfophenyldodecanoate acid and its homologs, albeit delayed by several hours.
In prior research,57 the total organic carbon (TOC) in the degradation system decreases, so we anticipated the final degradation products of DBS should be water, carbon dioxide, and sodium sulfate. Structures of some compounds in the degradation of DBS appear in Fig. 6; the corresponding detection results of these intermediate products can be found in Table S1.†
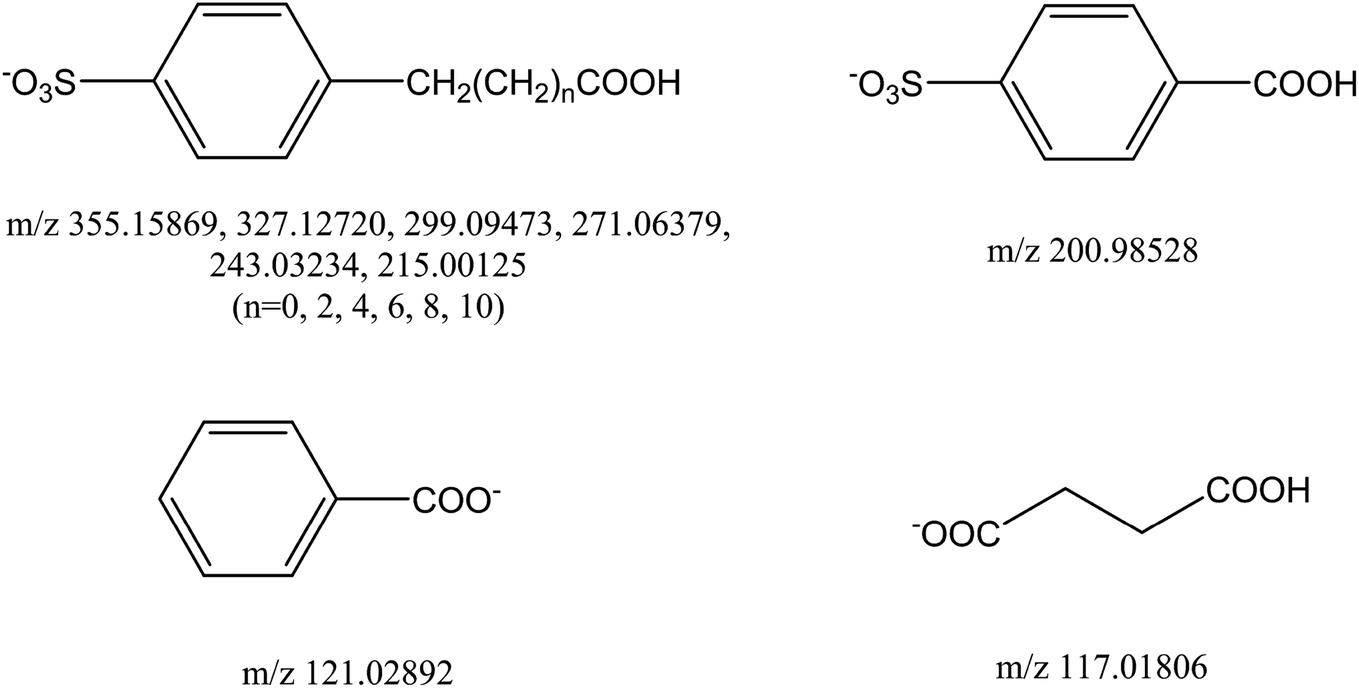 | ||
| Fig. 6 Several structures proposed for the m/z spectral species detected by ESI-MS in the degradation of DBS. | ||
We should point out that products having a higher molecular weight were easier to detect in our experiment, and they were detected in more samples. An explanation for this phenomenon is that small molecular products are degraded further by macromolecular degradation products. Compared with previous research, some intermediate products were detected, such as sodium benzoate, benzene, and benzoic acid, at the same time, yet others went undetected in our study (e.g., 4-hydroxybenzenesulfonic acid). The oxidase enzymes that affect the degradation of DBS cannot be ascertained according to previous studies. However, reactive oxygen species (ROS) were confirmed as the main driver behind the degradation of DBS.58 Other research has found that some enzymes and plant hormones, such as gibberellin and superoxide dismutase (SOD), do affect the degradation of other organic pollutants by algae.59,60 These researches mainly focus on the influence of different factors on the degradation amount of microbial degradation of sodium dodecylbenzene sulfonate, and there are few studies on the degradation process. Due to the limitations of the analysis method, some studies have given some possibilities intermediate products. Our work uses mass spectrometry technology to accurately analyse the characteristics of the chemical composition of the analyte, detect the degradation products of DBS, and infer the degradation mechanism of DBS. This work provides a new research idea, which can combine the research of influencing factors and intermediate products to further infer the degradation mechanism of pollution. And this work expands the application of mass spectrometry in environmental chemistry. In addition, other ion peaks were detected in this work, namely m/z 340.23522, m/z 222.07625, m/z 209.99135, and m/z 264.15987, and several ion peaks detected in this work—m/z 255, m/z 265, and m/z 227—occurred in the MS spectrum. These ion peaks have not been determined in previous work and this work. Further work by our lab will focus on the chemical identification of those ion peaks and determining the internal degradation process in the algae cells.
4. Conclusions
Overall, this study detected the intermediate products of DBS degraded by C. vulgaris, followed up with CID experimentation (i.e., the MS/MS method) to determine what the intermediate products are. To this end, we show the probable degradation process in Fig. 7. First, the aliphatic long-chain end of DBS is oxidized to a carboxyl. Then, the aliphatic long chain is shortened, and carboxyl formed. The final product in this process is formic acid sulfonate. Afterwards, formic acid sulfonate is desulfonated to benzoic acid; and the benzene ring is epoxidized to acetic acid and succinic acid. Lastly, DBS is degraded to some inorganic small molecules, such as water and carbon dioxide. This study establishes a method for detecting the intermediate products of DBS degraded by C. vulgaris, expands the application of mass spectrometry in environmental chemistry, and provides a new method for elucidating organic pollutant degradation.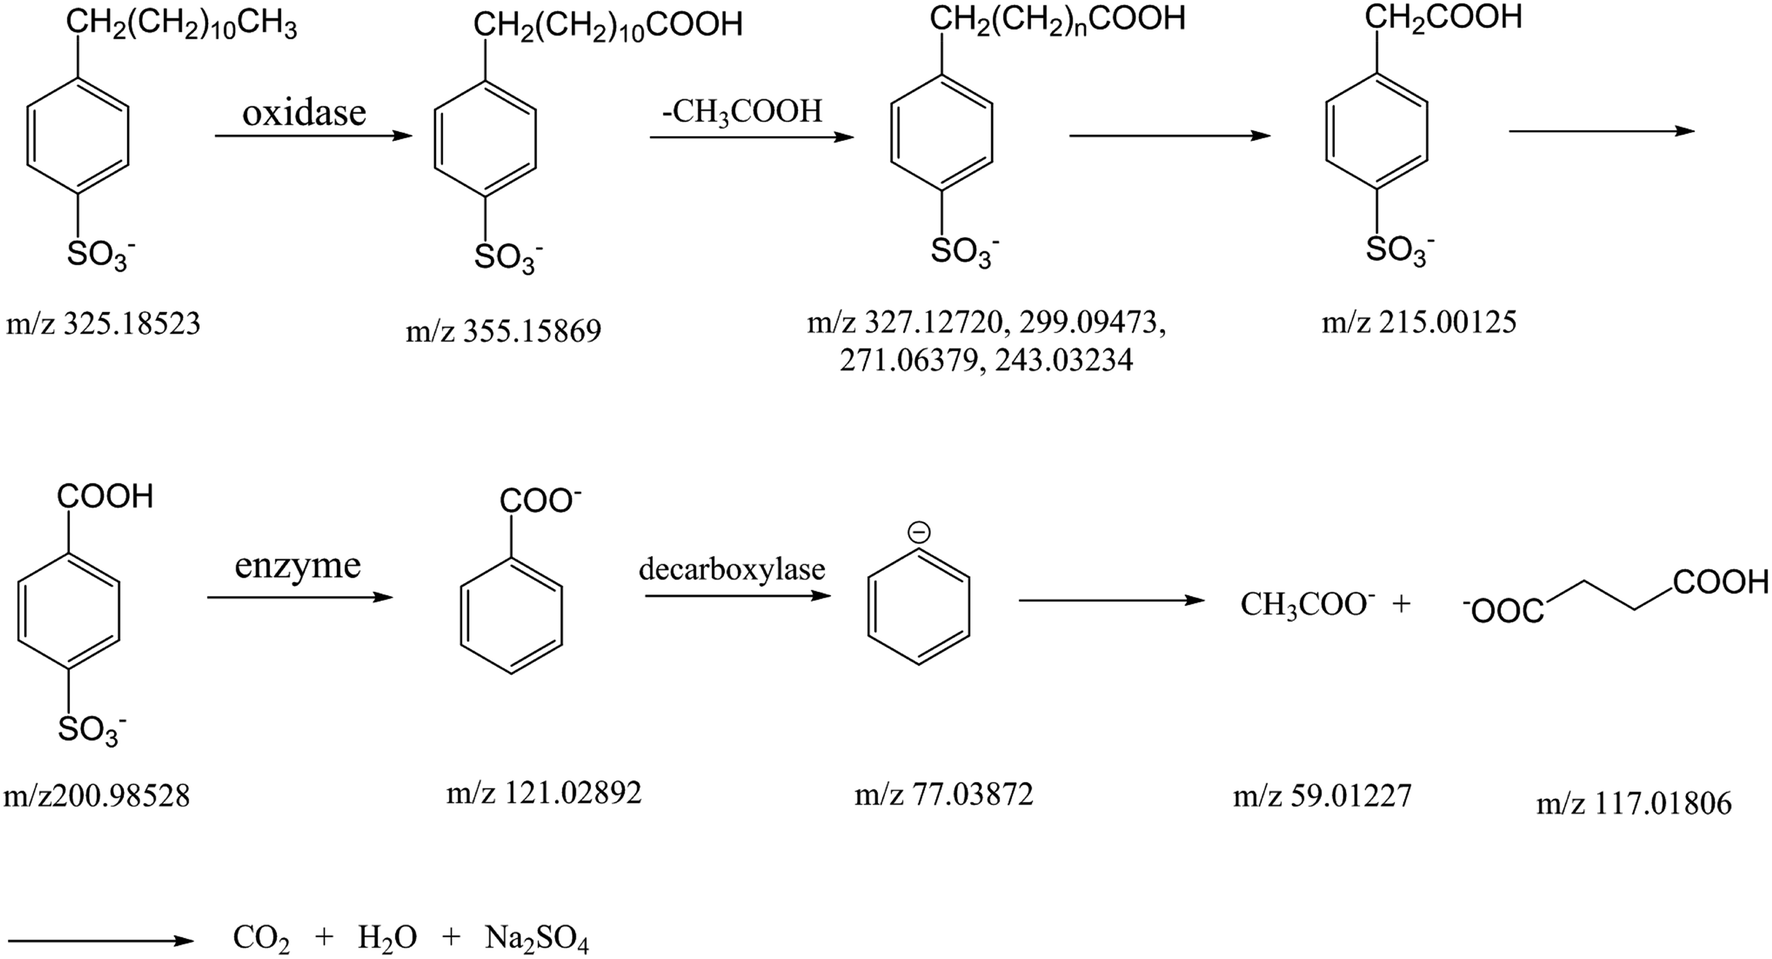 | ||
| Fig. 7 The process of DBS degradation by Chlorella vulgaris. | ||
Data availability
The datasets generated during and/or analysed during the current study are available from the corresponding author upon reasonable request.Author contributions
Y. G., Y. Q., X. H., Z. S., Y. N. and D. L.: conceptualization. Y. G., Y. Q., Z. S. and A. L.: validation. Y. G. and Y. Q.: formal analysis. Y. G.: writing – original draft. D. L.: supervision. All authors: writing – review & editing.Conflicts of interest
The author(s) declare no competing interests.Acknowledgements
We would like to thank Mr Wenjie Liu for the data collection and helping us conduct our experiment.References
- R. Taffarel Silvio and J. Rubio, Adsorption of sodium dodecyl benzene sulfonate from aqueous solution using a modified natural zeolite with CTAB, Miner. Eng., 2010, 23, 771–779 CrossRef.
- R. Falk, Surfactant Induced Phytotoxicity, Weed Technol., 1994, 12(3), 519–525 CrossRef.
- Y. M. Issa, S. H. Mohamed and M. Abd-El Baset, Chemically modified carbon paste and membrane sensors for the determination of benzethonium chloride and some anionic surfactants (SLES, SDS, and LABSA): Characterization using SEM and AFM, Talanta, 2016, 155, 158–167 CrossRef CAS PubMed.
- M. Sean and W. Zheng, Summary of Global Surfactants and Detergents in 2000, Adv. Fine Petrochem., 2001, 2(5), 52–54 Search PubMed.
- R. David and H. Huang, World Surfactant Market, Deterg. Cosmet., 1999, 6, 120–123 Search PubMed.
- A. Alemdar, N. Gungor and F. B. Erim, Effect of sodium dodecyl sulfate and sodium dodecyl benzene sulfonate on the flow behavior of purified bentonite dispersion, J. Mater. Sci. Lett., 2003, 22, 89–90 CrossRef CAS.
- K. C. D. Araujo, J. P. D. Barreto, J. C. Cardozo, E. V. dos Santos, D. M. de Araujo and C. A. Martinez-Huitle, Sulfate pollution: evidence for electrochemical production of persulfate by oxidizing sulfate released by the surfactant sodium dodecyl sulfate, Environ. Chem. Lett., 2018, 16, 647–652 CrossRef CAS.
- F. J. Zhu, W. L. Ma, T. F. Xu, Y. Ding, X. Zhao, W. L. Li, L. Y. Liu, W. W. Song, Y. F. Li and Z. F. Zhang, Removal characteristic of surfactants in typical industrial and domestic wastewater treatment plants in Northeast China, Ecotoxicol. Environ. Saf., 2018, 153, 84–90 CrossRef CAS PubMed.
- A. K. Bose, R. G. Wagner, B. E. Roth and A. R. Weiskittel, Influence of browsing damage and overstory cover on regeneration of American beech and sugar maple nine years following understory herbicide release in central Maine, New Forests, 2018, 49, 67–85 CrossRef.
- J. Yuan, H. Chen, B. Wu and Y. Li, The anion detergent pollution of antarctic Maxwell Bay and its adjacent sea areas, China Environ. Sci., 1998, 18(2), 151–153 Search PubMed.
- H. Takada, R. Ishiwatari and N. Ogura, Distribution of Liner Alkylbenzene (LABs) and Liner Alkylbenzene Sulphonate (LAS) in the Tokyo Bay sediments, Estuarine, Coastal Shelf Sci., 1992, 35(3), 141–156 CrossRef CAS.
- G. Z. Kyzas, M. Kostoglou and N. K. Lazaridis, Copper and chromium(VI) removal by chitosan derivatives—equilibrium and kinetic studies, Chem. Eng. J., 2009, 152, 440–448 CrossRef CAS.
- T. Conry, Consumer's guide to cosmetics, Ancor Press/Doubleday, Garden City, 1980 Search PubMed.
- L. Chahine, N. Sempson and C. Wagoner, The effect of sodium lauryl sulfate on recurrent aphthous ulcers: a clinical study, Compend. Contin. Educ. Dent., 1997, 18(12), 1238–1240 CAS.
- C. Doyle. Powerful choices podcast: dispelling cancer myths, http://www.cancer.org, 2002 Search PubMed.
- T. Ivankovic, J. Hrenovic and I. Gudelj, Toxicity of commercial surfactants to phosphate-accumulating bacterium, Acta Chim. Slov., 2009, 56, 1003–1009 CAS.
- J. Klebensberger, O. Rui, E. Fritz, B. Schink and B. Philipp, Cell aggregation of Pseudomonas aeruginosa strain PAO1 as an energy-dependent stress response during growth with sodium dodecyl sulfate, Arch. Microbiol., 2006, 185, 417–427 CrossRef CAS PubMed.
- M. Oya and N. Hisano, Decreases in surface activities and aquatic toxicities of linear alkylbenzene sulfonate and alcohol ethoxylates during biodegradation, J. Oleo Sci., 2010, 59, 31–39 CrossRef CAS PubMed.
- F. Beltran, J. Garcia-Araya and P. Alvarez, Sodium dodecylbenzene sulfonate removal from water and wastewater. Kinetics of decomposition by ozonation, Ind. Eng. Chem. Res., 2000, 39, 2214–2220 CrossRef CAS.
- J. Rivera-Utrilla, J. Méndez-Díaz, M. Sánchez-Polo, M. A. Ferro-García and I. Bautista-Toledo, Removal of the surfactant sodium dodecylbenzene sulfonate from water by simultaneous use of ozone and powdered activated carbon: comparison with systems based on O3 and O3/H2O2, Water Res., 2006, 40, 1717–1725 CrossRef CAS PubMed.
- H. Hidaka, Photodegradation of surfactants with TiO2 semiconductor for the environmental wastewater treatment, J. Chem. Sci., 1998, 110, 215–228 CAS.
- U. J. Rivera, D. J. Mendez and P. M. Sanchez, et al., Removal of the surfactant sodium dodecylbenzene sulfonate from water by simultaneous use of ozone and powdered activated carbon: comparison with systems based on O3 and O3/H2O2, Water Res., 2006, 40, 1717–1725 CrossRef PubMed.
- M. H. Dehghani, A. A. Najafpoor and K. Azam, Using sonochemical reactor for degradation of LAS from effluent of wastewater treatment plant, Desalination, 2010, 250, 82–86 CrossRef CAS.
- E. Manousaki, E. Psillakis, N. Kalogerakis and D. Mantzavinos, Degradation of sodium dodecylbenzene sulfonate in water by ultrasonic irradiation, Water Res., 2004, 38, 3751–3759 CrossRef CAS PubMed.
- H. X. Li, X. L. Jiang, F. Chen and H. Chen, Accumulation and degradation of anionic surfactant linear alkylbenzene sulfonate (LAS) by Spirulina platensis, J. Zhejiang Univ., Sci. Ed., 2006, 33, 434–438 CAS.
- H. Farzaneh, M. Fereidon, A. Noor and G. Naser, Biodegradation of dodecylbenzene sulfonate sodium by Stenotrophomonas maltophilia biofilm, Afr. J. Biotechnol., 2010, 9, 55–62 CAS.
- GB 7494-87, National Standards of People's Republic of China.
- F. Bruno, R. Curini and A. Di Corcia, et al., Determination of surfactants and some of their metabolites in untreated and anaerobically digested sewage sludge by subcritical water extraction followed by liquid chromatography-mass spectrometry, Environ. Sci. Technol., 2002, 36, 4156–4161 CrossRef CAS PubMed.
- K. Sawada, S. Inomata, B. Gobara and T. Suzuki, Extraction and determination of anionic surfactants with copper(II)-ethylenediamine derivative complexes, Talanta, 1983, 30(3), 155–159 CrossRef CAS PubMed.
- A. K. Asok and M. S. Jisha, Biodegradation of the anionic surfactant linear alkylbenzene sulfonate (LAS) by autochthonous Pseudomonas sp., Water, Air, Soil Pollut., 2012, 223, 5039–5048 CrossRef CAS.
- A. K. Mungray and P. Kumar, Fate of linear alkylbenzene sulfonates in the environment: a review, Int. Biodeterior. Biodegrad., 2009, 63, 981–987 CrossRef CAS.
- A. Asok and M. Jisha, Assessment of soil microbial toxicity on acute exposure of the anionic surfactant linear alkylbenzene sulfonate, J. Environ. Sci. Technol., 2012, 5, 354–363 CrossRef CAS.
- R. J. Ram, N. C. VerBerkmoes and M. P. Thelen, et al., Community proteomics of a natural microbial biofilm, Science, 2005, 308, 1915–1920 CrossRef CAS PubMed.
- D. Onyancha, W. Mavura, J. C. Ngila, P. Ongoma and J. Chacha, Studies of chromium removal from tannery wastewaters by algae biosorbents, Spirogyra condensata and Rhizoclonium hieroglyphicum, J. Hazard. Mater., 2008, 158, 605–614 CrossRef CAS PubMed.
- L. Balabanova, L. Slepchenko, O. Son and L. Tekutyeva, Biotechnology Potential of Marine Fungi Degrading Plant and Algae Polymeric Substrates, Front. Microbiol., 2018, 9, 1527 CrossRef PubMed.
- X. Y. Hua, M. Li, Y. L. Su, D. M. Dong, Z. Y. Guo and D. P. Liang, The degradation of linear alkylbenzene sulfonate (LAS) in the presence of light and natural biofilms: The important role of photosynthesis, J. Hazard. Mater., 2012, 229, 450–454 CrossRef PubMed.
- E. W. Becker, Micro-algae as a source of protein, Biotechnol. Adv., 2007, 25, 207–210 CrossRef CAS PubMed.
- G. W. Abou-El-Souod and M. M. El-Sheekh, Biodegradation of Basic Fuchsin and Methyl Red by the Blue Green Algae Hydrocoleum oligotrichum and Oscillatoria limnetica, Environ. Eng. Manage. J., 2016, 15, 279–286 CrossRef CAS.
- G. O'Toole, H. B. Kaplan and R. Kolter, Biofilm formation as microbial development, Annu. Rev. Microbiol., 2000, 54, 49–79 CrossRef PubMed.
- D. M. Dong, M. Li, J. Q. Sun, T. Y. Zhao and X. Y. Hua, et al. H2O2 Generated by Natural Biofilms under Light Irradiation and Its Effects on Degradation of Sodium Dodecyl Benzene Sulfonate, Chem. J. Chin. Univ., 2014, 35, 1247–1251 CAS.
- Y. M. Nelson, L. W. Lion, M. L. Shuler and W. C. Ghiorse, Modeling oligotrophic biofilm formation and lead adsorption to biofilm components, Environ. Sci. Technol., 1996, 30(6), 2027–2036 CrossRef CAS.
- G. Mezohegyi, F. P. van der Zee, J. Font, A. Fortuny and A. Fabregat, Towards advanced aqueous dye removal processes: A short review on the versatile role of activated carbon, J. Environ. Manage., 2012, 102, 148–164 CrossRef CAS PubMed.
- Y. Tian, J. Zou, F. Li, L. Zhang and Y. Liu, Chlorella vulgaris enhance the photodegradation of chlortetracycline in aqueous solution via extracellular organic matters (EOMs): Role of triplet state EOMs, Water Res., 2018, 149, 35–41 CrossRef PubMed.
- Y. Tian, L. Wei, Z. Yin, L. Feng, L. Zhang, Y. Liu and L. Zhang, Photosensitization Mechanism of Algogenic Extracellular Organic Matters (EOMs) in the transformation of Chlortetracycline: Role of Chemical Constituents and Structure, Water Res., 2019, 164, 1–8 CrossRef PubMed.
- Z. J. Yan, J. Liu and L. Qian, et al., Development and validation of a photobioreactor for uniform distribution of light intensity along the optical path based on numerical simulation, Environ. Sci. Pollut. Res., 2020, 27, 42230–42241 CrossRef CAS PubMed.
- J. B. Fenn, M. Mann, C. K. Meng, S. F. Wong and C. M. Whitehouse, Electrospray ionization for mass spectrometry of large biomolecules, Science, 1989, 246, 64–71 CrossRef CAS PubMed.
- H. Zhang, A. S. Bibi, H. Y. Lu, J. Han and H. W. Chen, Comparative study on ambient ionization methods for direct analysis of navel orange tissues by mass spectrometry, J. Mass Spectrom., 2017, 52, 526–533 CrossRef CAS PubMed.
- J. Q. Xu and H. W. Chen, Internal extractive electrospray ionization-mass spectrometry: a powerful platform for bioanalysis, Bioanalysis, 2018, 10(8), 523–525 CrossRef CAS PubMed.
- W. Kou, H. Zhang, C. Konstantin and H. W. Chen, Charged Bubble Extractive Ionization Mass Spectrometry for Protein Analysis, Chin. J. Anal. Chem., 2017, 45, 1937–1942 Search PubMed.
- H. Y. Lu, J. Y. Zhang, W. Zhou, Y. P. Wei and H. W. Chen, Direct Analysis of Phospholipids in Biological Tissues Using Internal Extractive Electrospray Ionization Mass Spectrometry, Chin. J. Anal. Chem., 2016, 44, 329–334 CAS.
- T. Zhang, X. Y. Wu, C. F. Ke and M. Z. Yin, et al., Identification of Potential Biomarkers for Ovarian Cancer by Urinary Metabolomic Profiling, J. Proteome Res., 2013, 12, 505–512 CrossRef CAS PubMed.
- J. Tolls, R. Samperi and A. Di Corcia, Bioaccumulation of LAS in feral fish studied by a novel LC-MS/MS method, Environ. Sci. Technol., 2003, 37, 314–320 CrossRef CAS PubMed.
- V. Andreu and Y. Pico, Determination of linear alkylbenzenesulfonates and their degradation products in solis by liquid chromatography-electrospray-ion trap multiple-stage mass spectrometry, Anal. Chem., 2004, 76, 2878–2885 CrossRef CAS PubMed.
- E. W. Becker, Micro-algae as a source of protein, Biotechnol. Adv., 2007, 25(2), 207–210 CrossRef CAS PubMed.
- G. O'Toole, H. B. Kaplan and R. Kolter, Biofilm formation as microbial development, Annu. Rev. Microbiol., 2000, 54(1), 49–79 CrossRef PubMed.
- X. Hua, L. Ming and Y. Su, et al., The degradation of linear alkylbenzene sulfonate (LAS) in the presence of light and natural biofilms: The important role of photosynthesis, J. Hazard. Mater., 2012, 229–230, 450–454 CrossRef CAS PubMed.
- H. Hidaka, T. Koike, T. Kurihara and N. Serpone, Dynamics and mechanistic features in the photocatalyzed oxidation of disulfonated anionic surfactants on the surface of UV-irradiated titania nanoparticles, New J. Chem., 2004, 28, 1100–1106 RSC.
- D. Dong, Y. Zhang and X. Hua, et al., Effect of Dissolved Organic Matter on the Generation of H2O2 in Natural Biofilm Systems Under Illumination, Chem. J. Chin. Univ., 2019, 40, 800–808 CAS.
- C. Liu, S. Liu and J. Diao, Enantioselective growth inhibition of the green algae (Chlorella vulgaris) induced by two paclobutrazol enantiomers, Environ. Pollut., 2019, 250, 610–617 CrossRef CAS PubMed.
- O. Lefebvre and R. Moletta, Treatment of organic pollution in industrial saline wastewater: A literature review, Water Res., 2006, 40, 3671–3682 CrossRef CAS PubMed.
Footnotes |
| † Electronic supplementary information (ESI) available. See DOI: 10.1039/d1ra02791c |
| ‡ Currently at: State Key Laboratory of Environmental Simulation and Pollution Control, College of Environmental Sciences and Engineering, Peking University, Beijing, 100871, China. |
| § Currently at: State Key Laboratory of Environmental Simulation and Pollution Control, School of Environment, Beijing Normal University, Beijing, 100875, China. |
| This journal is © The Royal Society of Chemistry 2021 |