
 Open Access Article
 This Open Access Article is licensed under a
 Creative Commons Attribution 3.0 Unported Licence
Water-dispersed semiconductor nanoplatelets with high fluorescence brightness, chemical and colloidal stability†
Henry
Halim
a,
Johanna
Simon
ab,
Ingo
Lieberwirth
 a,
Volker
Mailänder
ab,
Kaloian
Koynov
a and
Andreas
Riedinger
*a
a,
Volker
Mailänder
ab,
Kaloian
Koynov
a and
Andreas
Riedinger
*a
aMax-Planck-Institute for Polymer Research, Ackermannweg 10, 55128 Mainz, Germany. E-mail: riedinger@mpip-mainz.mpg.de
bDermatology Clinic, University Medical Center of the Johannes Gutenberg-University Mainz, Langenbeckstr. 1, 55131 Mainz, Germany
First published on 22nd November 2019
Abstract
Quasi-two dimensional semiconductor nanoplatelets (NPLs) exhibit high spectral brightness and large absorption cross sections, making them promising for various applications including bioimaging. However, the synthesis of NPLs takes place in organic solvents, therefore they require phase transfer in order to use them in aqueous environments. The phase transfer of NPLs has so far been challenging with few examples in literature. This is likely due to the facile agglomeration of materials with plate-like geometries during the coating procedure. Here we demonstrate how to overcome agglomeration and transfer NPLs, individually coated with amphiphilic polymer chains, to aqueous phase. Upon one and two-photon excitation the water transferred NPLs exhibit more than two fold higher fluorescent brightness relative to commercially available quantum dots. Additionally, the polymer coating increase the stability of nanoparticles in physiological conditions (pH 4.5–7.4, [NaCl] 5.8–11.7 g L−1, and in human serum). Our experiments with NPL labeled RAW264.7 cells demonstrate the capabilities of NPLs as next generation ultra-bright fluorescent labels for bioimaging.
Introduction
Semiconductor nanocrystals are the ideal fluorescent light emitters in terms of spectral properties and long-term stability.1–4 Quasi-two dimensional semiconductor nanoplatelets (NPLs) are the new generation of these nanocrystals, having unique physical properties compared to the traditional quasi-spherical semiconductor nanocrystals, known as quantum dots (QDs).5–7 CdSe NPLs can by synthesized by colloidal methods so that every particle in the ensemble has exactly the same thickness of an integer number of atomic layers, while being extended in the other two dimensions.8,9 As a result, every NPL experiences the same level of quantum confinement (across their thickness) and the ensemble and single particle spectral properties are nearly identical.10 The absence of inhomogeneous broadening leads to exceptionally narrow line widths.6 In conjunction with high fluorescence quantum yield (QY)7 and large one and two-photon absorption cross section,11 NPLs make promising fluorescent markers in biological systems where often more than one fluorescent label is used at the same time. Labels with high spectral brightness facilitate multiplexed imaging by reducing spectral cross-talk.However, as with many semiconductor nanocrystals, cadmium chalcogenide NPLs are synthesized in organic solvents but biological studies are conducted in aqueous media. Whilst there are numerous literature on the phase transfer of QDs to water,1 there exist only a limited number of examples to date of the transfer of NPLs into water.12–14 This may relate to the specific geometry of the NPLs imposing additional challenges during the phase transfer. In particular, the higher agglomeration tendency of NPLs during coating procedures relative to QDs originates from large contact area between the flat surfaces of NPLs. This makes it challenging to transfer individual NPLs into aqueous phase without accidentally inducing agglomerative stacking of NPLs instead.15 Even if the transfer could be done by simple ligand exchange,16 the fluorescence properties of the NPLs still need to be considered since such a process usually damages the surface of the NPLs and quenches the fluorescence. Simple ligand exchange also leaves the surface of the NPLs exposed and accessible to chemical attacks. This makes them more prone to surface damage and subsequent loss in fluorescent brightness.
In the first example of NPL phase transfer, Lim et al. carefully considered the geometry of the NPLs.13 They used a combination of phospholipids, detergents and membrane scaffold proteins that match the geometry of NPLs in order to wrap them around the NPLs. Before the transfer process, they grew a shell of CdS around the CdSe core NPLs to maintain some of the fluorescence of the NPLs through the transfer (QY 4.3% in hexane, 1.6% in water).13 The biomolecular encapsulation material gave their NPLs specific characteristics in cellular environment, enabling e.g. rapid cellular uptake. However, this encapsulation technique relies on costly protein synthesis limiting the scalability of this method.
Following the ligand exchange approach, two developments were made to improve the properties of the final product.12,14 Kechkeche et al. used a two-step ligand exchange to first transfer the NPLs into aqueous phase using simple, small molecular ligands followed by attachment of tailor made, water soluble polymer as the final coating to disperse the NPLs in a aqueous environments of high ionic strength.12 The advantage of this method is that the polymers could be customized to contain useful functional groups and the transfer method is scalable. However, the requirement for a special, finely tuned polymer and being a two-step method perhaps hampers the wide use of this method in the community. Meanwhile, Shendre et al. focused on the retention of fluorescent properties and synthesized core/crown/shell NPLs applying only the ligand exchange method to transfer the NPLs to water.14 Although they were able to reach very high QYs, Kechkeche et al. pointed out that ligand exchange with small hydrophilic thiol ligands can only stabilize the NPLs for a short term due to the oxidation of the thiol groups and the weak binding of monodentate ligands.14
To simplify the encapsulation and water transfer of NPLs we exploited a commonly used polymer coating strategy previously applied to a wide range of nanoparticles of isotropic geometry.17,18 Here, the hydrophobic side-chains of dodecyl-grafted-poly(isobutylene-alt-maleic acid) interacts via hydrophobic forces with the hydrophobic ligands of nanocrystals, while the anhydride units provide a large number of negatively charged carboxylate group on the outer surface after water transfer. Importantly, this one-step procedure utilizes only cheap and commercially available starting materials, making this method easy to use and also scalable. Furthermore, by generating a hydrophobic inter-layer between the nanoparticles and the hydrophilic backbone of the dodecyl-grafted-poly(isobutylene-alt-maleic acid) (Scheme 1), the nanoparticles are able to withstand harsh conditions (e.g. low pH ∼ 4.7 as found in some cellular compartments like the lysosome).19,20 This polymer coating has also been shown to make nanocrystals accumulate selectively in the liver sinusoidal endothelial cells, which may be useful for studies related to regulatory T-cell based therapies.21 Thus, bringing this well established and studied polymer coating to the NPLs certainly could foster their widespread use in bioimaging. To do this, the aforementioned agglomeration challenge related to the flat, anisotropic shape of NPLs must be solved.
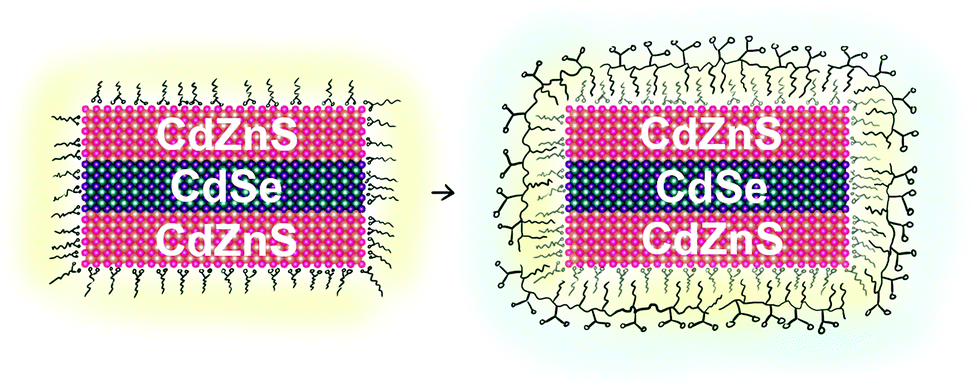 | ||
| Scheme 1 Illustration of polymer coating. Hydrophobic regions are highlighted in yellow. | ||
Results and discussion
Much like the existing attempts to transfer the NPLs into water, we employed core/shell NPLs for the water transfer. Applying our polymer coating method to core only CdSe NPLs resulted in degradation of the NPLs when we added the borate buffer (pH 12) to the polymer-NPLs mixture as seen by the change in absorption and PL spectra (see Fig. S1, ESI†).To overcome this issue, 4 monolayer (ML, number of selenium atoms across the thickness) thin CdSe NPLs with lateral sizes of 43 ± 8 nm × 12 ± 2 nm and oleic acid surface ligands were coated with a graded CdZnS shell according to a procedure described by Mahler et al.22 The spectral properties of the NPLs before and after shell growth are shown in Fig. 1 together with the corresponding transmission electron microscopy (TEM) micrographs. At the end of the core/shell synthesis, the NPLs were precipitated from the reaction mixture and re-dispersed in chloroform. In some published protocols a post treatment step consisting of the addition zinc nitrate and oleic acid is applied to stabilize the properties of the NPLs.22 The zinc nitrate improves the spectral properties of the NPLs by passivating S dangling bonds23 while the oleic acid helps to preserve the colloidal stability.
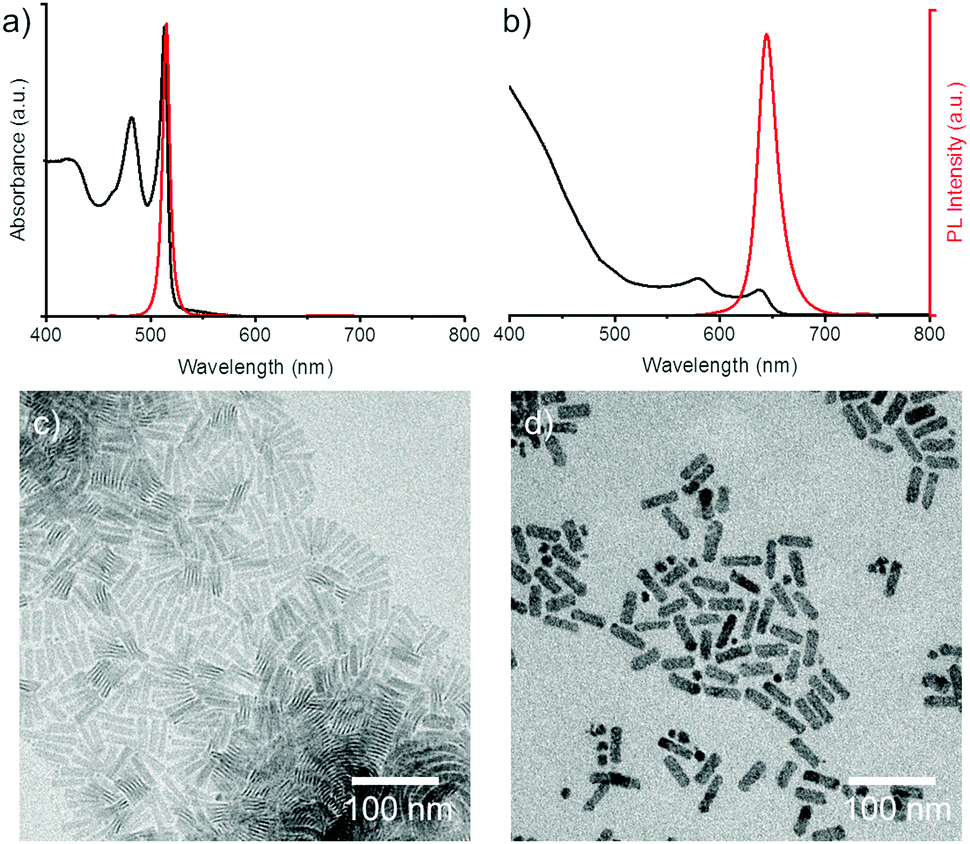 | ||
| Fig. 1 Characterization of the NPLs. (a) Absorption spectrum (black) and fluorescence spectrum (red) of 4ML CdSe NPLs in hexane. (b) Absorption spectra (black) and fluorescence spectra (red) of CdSe/CdZnS core/shell NPLs in chloroform. (c) TEM image of 4ML NPLs. (d) TEM image of core/shell NPLs. | ||
Interestingly, we found that this post treatment step is crucial for successful phase transfer of NPLs from non-polar solvents to water. To do the phase transfer,18 the core/shell NPLs in chloroform are mixed with a solution of amphiphilic polymer (dodecyl-grafted-poly(isobutylene-alt-maleic acid), with 75% of the anhydride rings opened by dodecylamine and the rest remains closed as anhydride groups). The mixture is dried with a rotatory evaporator and re-dispersed in chloroform through several cycles to ensure even coating. After the final evaporation, boric acid buffer (pH 12) is added to the dried film to open all the anhydride rings. NPL samples which did not undergo the Zn(NO)3/oleic acid post-treatment do not phase transfer after polymer coating, while NPLs that received the post-treatment undergo the phase transfer. To understand this phenomenon, we conducted a test with and without the zinc nitrate and oleic acid to figure out whether the effect is due to the zinc nitrate, the oleic acid or both components (Fig. S2, ESI†).
The results clearly show that oleic acid plays a key role in the polymer coating step and phase transfer while zinc nitrate alone does not work. However, the effect of oleic acid at this point was ambiguous since it could have changed the system in two different ways. Firstly, free oleic acid at high concentrations could act as a solvent at low pressure during the chloroform evaporation step since it does not evaporate. Avoiding complete dryness in the system could keep the NPLs dispersed, which could prevent irreversible agglomeration. Secondly, surface-bound oleic acid could facilitate the polymer coating if it acts as a ligand that interacts better with the dodecyl side chain of the polymer coating compared to the octylamine ligands introduced in the core/shell synthesis step. To determine whether the excess oleic acid plays a role in the phase transfer, we removed the excess oleic acid by precipitating the core/shell NPLs with methyl acetate before the polymer coating. This way, during the chloroform evaporation, the NPLs do not stay as a viscous liquid at 1 mbar pressure, but rather are embedded in a solid polymer film. It turns out that removing the excess oleic acid not only allows phase transfer (Fig. S2, ESI†) but also makes the transfer happen faster. For samples with excess oleic acid it takes a few hours to fully disperse polymer coated NPLs in water while the samples precipitated with methyl acetate acid transfers completely within a few minutes.
After dispersion in water, the samples contain polymer coated NPLs and excess polymer in the form of micelles which can be detected by either gel electrophoresis (Fig. S3, ESI†) or TEM (Fig. 2). To remove the excess polymer, we purified the NPLs with a sucrose density gradient (Fig. 2).24 Here, we note that purification by gel electrophoresis may be too harsh as we observed a drastic loss in QY for NPLs purified this way. Purification of NPLs by sucrose gradient yields NPLs with negligible loss in QY (see Table S1, ESI†).
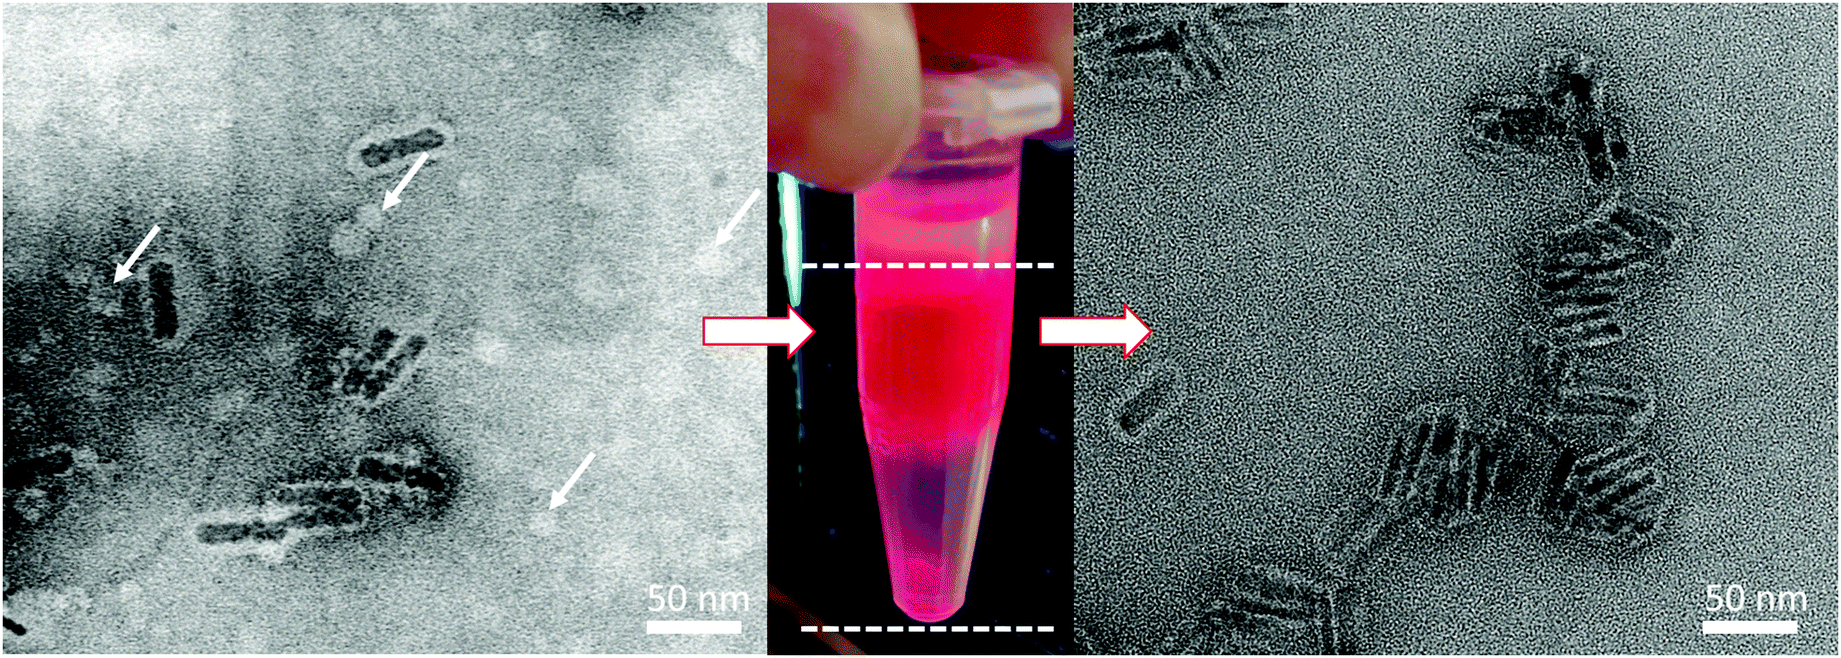 | ||
| Fig. 2 TEM images of core/shell NPLs after polymer coating and phase transfer with uranyl acetate staining. Left TEM image shows NPLs before sucrose gradient purification. White arrows indicate bright circles, which are remains of the excess polymer in the sample in the form of spherical micelles. Middle photograph shows the section of NPLs taken from the sucrose gradient separation. Right image shows sample purified with sucrose gradient centrifugation. Micelles are no longer present in this sample. Additional high resolution TEM images of the NPLs can be found in the ESI† (Fig. S4). The absence of micelles was also confirmed by polymer coating the NPLs with fluoresceinamine labelled polymer and checking the fluorescence signal in gel electrophoresis (Fig. S3, ESI†). | ||
To demonstrate the effect of the polymer coating to the chemical stability of the NPLs, we monitored the fluorescence spectrum of the NPLs at pH 1.8–12.2 environments (Fig. 3c and Fig. S5, ESI†). We observed minor changes in fluorescence intensity from the NPLs. This suggests that the polymer coating indeed protects the NPLs from the external aqueous environment through the hydrophobic interlayer. The colloidal stability of the polymer coating was also tested in Dulbecco's Phosphate Buffered Saline (PBS) buffer at different NaCl concentrations (Fig. S6, ESI†). For salt concentrations in physiological conditions (<14 g L−1), no increase in scattering signals were observed which suggests the absence of agglomerates.
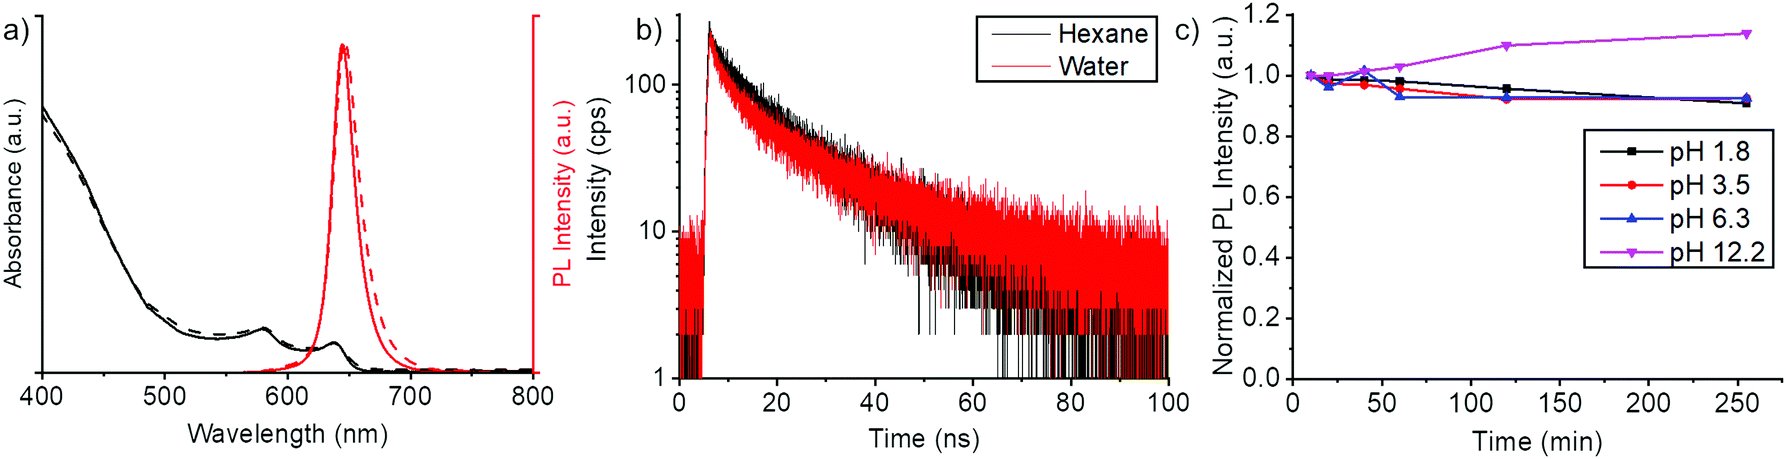 | ||
| Fig. 3 Basic properties of core/shell NPLs. (a) Absorption spectra (black) and fluorescence spectra (red) of CdSe/CdZnS core/shell NPLs in chloroform (solid line) and water (dashed line). (b) Fluorescence lifetime measurements of core/shell NPLs before phase transfer (in hexane, black decay curve) and after phase transfer (in water, red decay curve). Double exponential fitting (Fig. S6, ESI†) of the fluorescence decay gave lifetimes of 14.1 ns and 1.0 ns for NPLs in hexane and 13.7 ns and 1.3 ns for NPLs in water. (c) Fluorescence intensities of polymer coated NPLs in different pH environments. pH values were adjusted by adding hydrochloric acid for the acidic conditions and by adding sodium hydroxide for the basic conditions. The full absorption and PL spectra of the samples are found in Fig. S5 (ESI†). | ||
Overall, we have achieved a water transfer process, which largely preserves the spectral shape (Fig. 3a) and the QY of the NPLs (Table S1, ESI†). To gain further understanding of the optical properties, we conducted fluorescence lifetime measurements of the core/shell NPLs in hexane and polymer coated core/shell NPLs in water. From these experiments, we have found that there are only minor changes in the fluorescence lifetime of the NPLs before and after the phase transfer (Fig. 3). In the double exponential fitting (Fig. S7, ESI†), we found only slight variations in the short and long-lived components. Thus, water transfer did not introduce surface defects to a significant extent. The negligible change in lifetime also shows that the thick CdZnS shell and polymer coating efficiently shield excitons from the dielectric of the solvent.
To ensure the quality of our phase transfer and purification, we studied the properties of our water dispersed NPLs with TEM (Fig. 2 and Fig. S4, ESI†) and fluorescence correlation spectroscopy (FCS)25 (Fig. S8, ESI†) and compared them to commercially available Quantum Dots (QDs, Thermo Fisher Qdot™ 655 ITK™ Carboxyl Quantum Dots, see Fig. S9, ESI†). From the TEM images and the FCS data, we confirmed that we transferred NPLs individually to water rather than as agglomerates. This is also reflected in the fluorescence intensity time trace (inset in Fig. S8, ESI†) that shows no spikes, which would be expected if agglomerates were present.
To use the NPLs for bioimaging, we would need to confirm that the NPLs also do not agglomerate in biological medium. Thus, we also tested the behaviour of the NPLs under physiological conditions by performing FCS studies in human serum. Typical autocorrelation curve of the NPL dispersed in human serum is shown in Fig. S10 (ESI†). A fit with eqn (2) yielded a hydrodynamic radius of ≈16.5 nm after accounting for the plasma viscosity as in earlier studies.26 This value that is only ∼4 nm larger than the one measured in water, probably due to protein corona formation,27 indicates that the NPLs are still well dispersed and show no aggregation in human serum. This is further confirmed by the fluorescence intensity time trace (inset in Fig. S10, ESI†) that shows no spikes caused by agglomerates. These results are also consistent in the cell culture medium (DMEM + 10% FBS) we use later on for bioimaging experiments where we observed no agglomeration and a 4 nm size increase (Fig. S11, ESI†).
In bioimaging experiments, a good fluorophore should be as bright as possible to increase the signal-to-noise ratio that inherently suffers from autofluorescence.28 The fluorescence brightness of a sample is given by eqn (1):
| FB ∝ ε·φ | (1) |
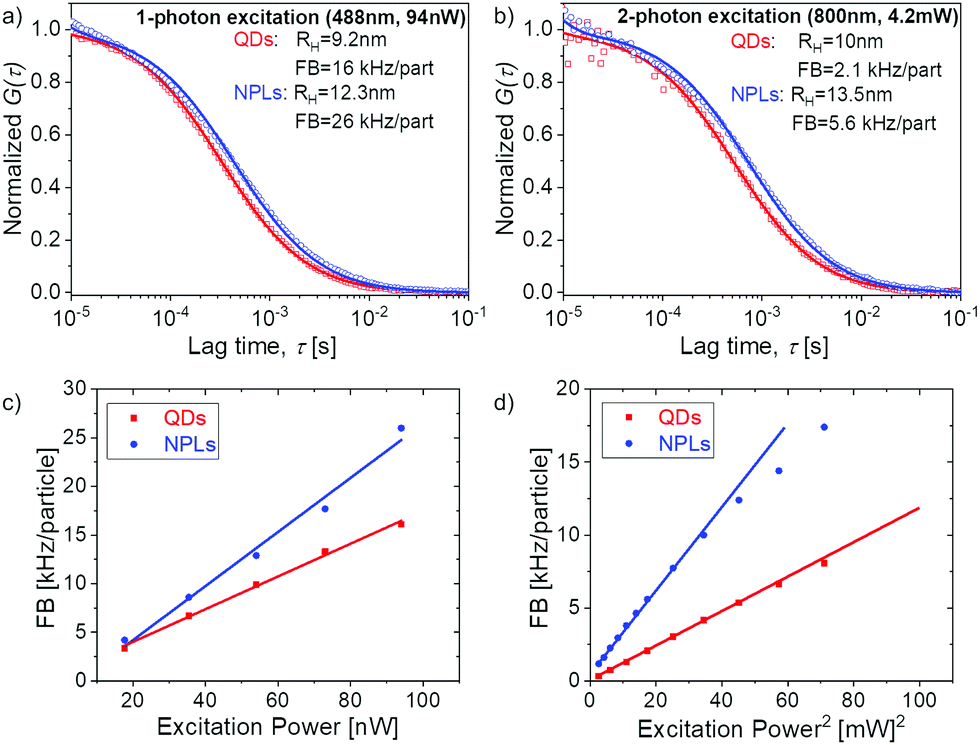 | ||
| Fig. 4 FCS studies of QDs and NPLs dispersed in water. (a) Normalized experimental autocorrelation curves of the two samples (symbols) measured upon one photon excitation at 488 nm (a) and two photon excitation at 800 nm (b). The data points were fitted. The solid lines represent the corresponding fits with eqn (2). The fluorescent brightness (FB) was 16 (QDs) and 26 kHz per particle (NPLs) with excitation at 488 nm and 2.1 (QDs) and 5.6 kHz per particle (NPLs) with excitation at 800 nm. (c and d) Power dependence of the FB of the QDs and NPLs at an excitation wavelength of 488 nm (c) and of 800 nm (d). | ||
To investigate the performance of NPLs in bioimaging experiments, we incubated different concentration of NPLs (18–150 μg mL−1) with RAW264.7 macrophages in the absence (0%) or presence of 10% FBS. Cellular uptake of NPLs into macrophages was quantitatively analysed by flow cytometry (Fig. 5a and b) and verified by confocal laser scanning microscopy (Fig. 5c). To prove that the fluorescence intensity of the NPLs is not quenched after cell uptake, NPLs were added to RAW264.7 cells for 24 h. Twenty-four hours after NPLs incubation, the NPLs were localized in phagolysosomes, which have an acidic pH between 4.5–6.5.30,31 Our stability experiments (see Fig. 2, 3a and Fig. S5, ESI†) suggest that the NPL photoluminescence is not quenched under these harsh conditions, due to the robust polymer coating.
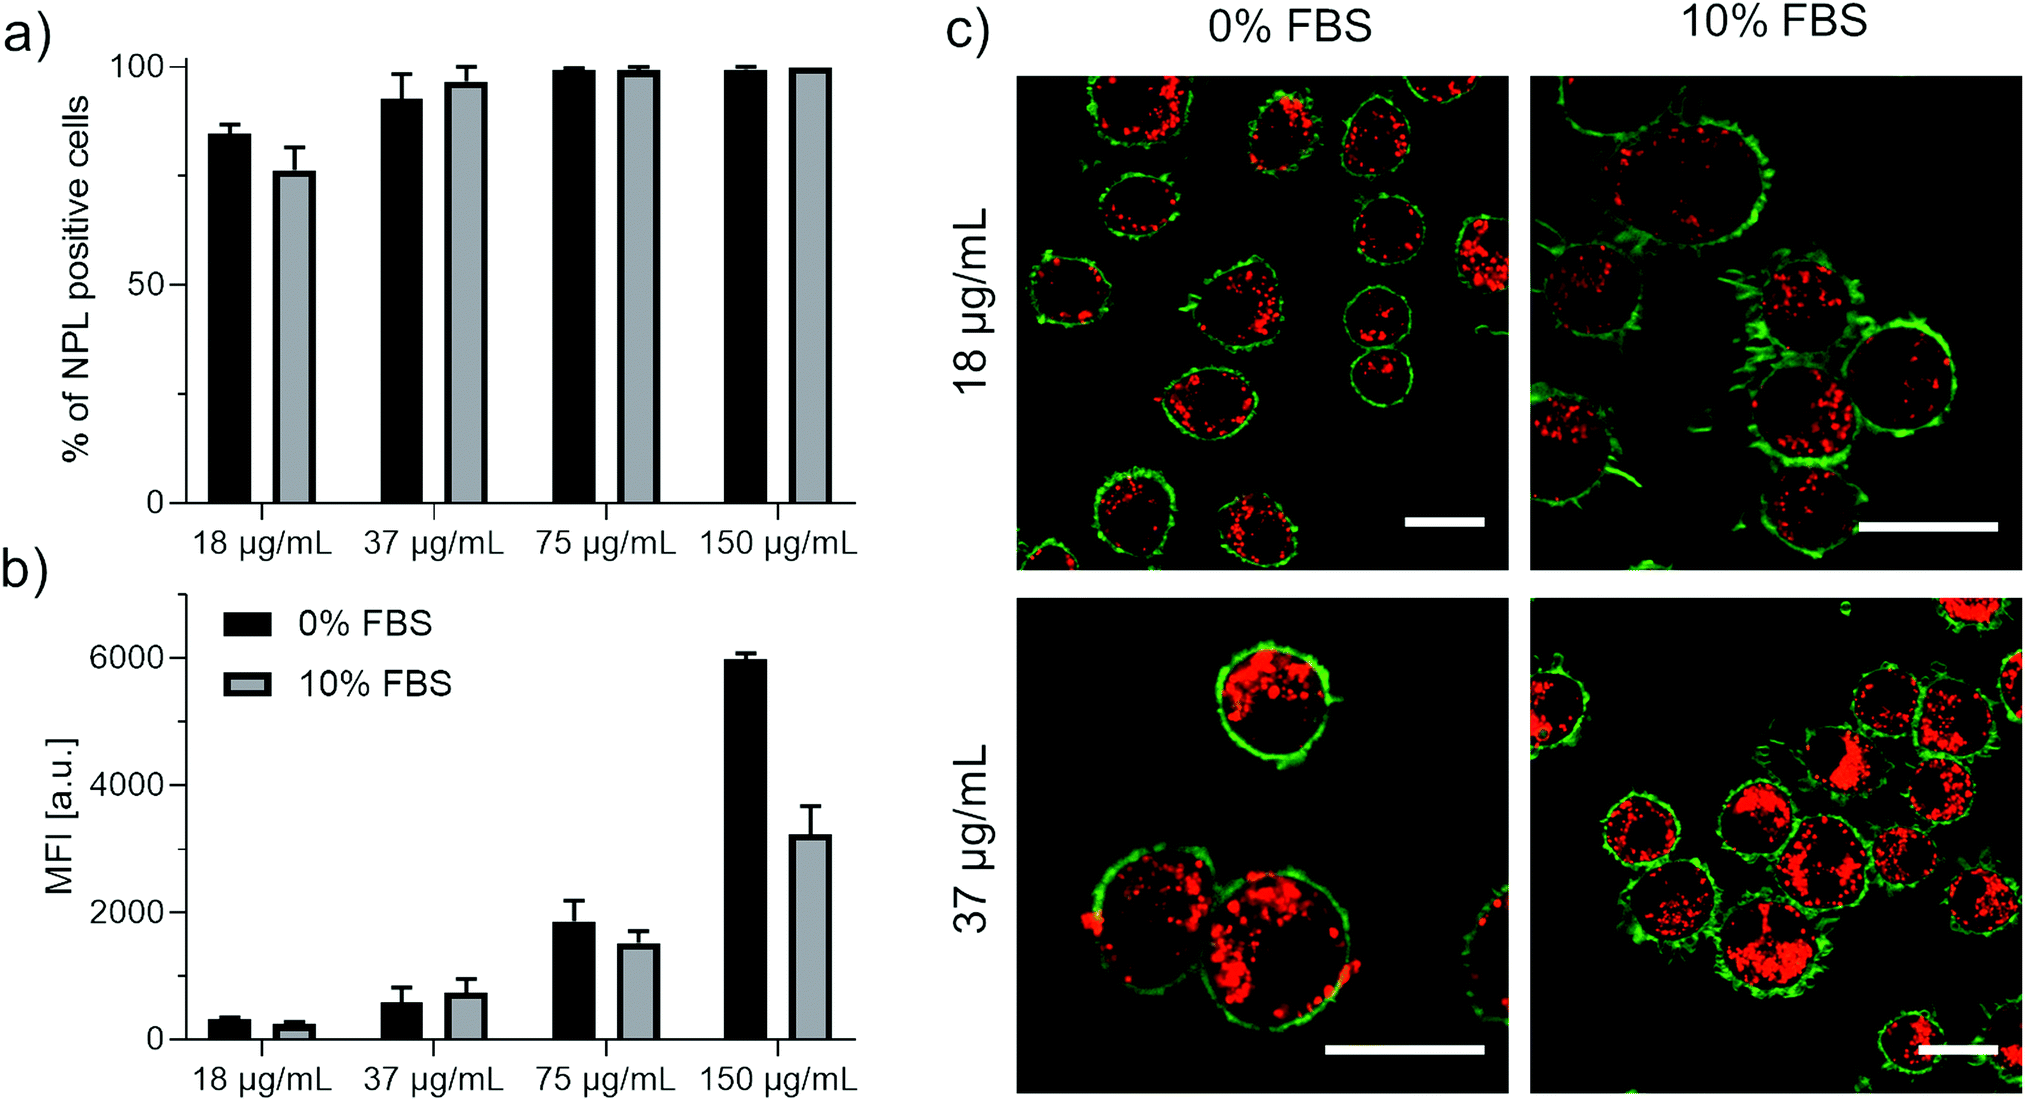 | ||
| Fig. 5 Cellular uptake of CdSe/CdZnS core/shell NPLs by RAW264.7 macrophages. Different concentrations of NPLs (18–150 μg mL−1) were added to RAW264.7 cells in cell culture medium containing 0% FBS or 10% FBS for 24 h. Cellular uptake was quantified by flow cytometer and the amount of NPL positive cells in % (a) or the median fluorescence intensity (MFI) is shown (b). (c) The intracellular localization of the NPLs was confirmed by confocal laser scanning microscopy (cLSM). RAW264.7 cells were treated with NPLs for 24 h. The cell membrane was stained with CellMask Green and is pseudo-colored in green and NPLs are pseudo-colored in red. The scale bars correspond to 20 μm. | ||
With flow cytometry, we determined a concentration dependent cellular uptake of the NPLs by RAW264.7 macrophages after 24 h. Additionally, we saw that the presence of FBS in the cell culture medium slightly reduced the cellular uptake.
This effect has also been observed in literature for spherical nanoparticles and is attributed to the adsorption of serum proteins towards the NPLs surface (protein corona formation).32,33
Finally, with confocal laser scanning microscopy (cLSM), we could verify the intracellular localization of the NPLs in the presence or absence of serum after 24 h. Internalized NPLs had a bright, fluorescent signal, were distributed inside the cell and did not accumulate on the cell membrane. Overall, these results indicate that the NPLs are highly suitable for bio imaging.
Conclusions
In this work, we have demonstrated the phase transfer of NPLs into aqueous medium using a cheap, one-step polymer coating method. The main challenge of applying this method to NPLs was the agglomeration problems inherent to the flat platelet shape, which was overcome by the post treatment of the core/shell NPLs with oleic acid. This method not only offers practical advantages over the other existing NPL phase transfer methods12,13 but also application advantages in terms of a hydrophobic protection layer between the NPL and the aqueous environment. The protection layer provides high chemical stability (pH 1.8–12.2) and colloidal stability in high ionic strength media ([NaCl] 5.8–11.7 g L−1) and in human serum. We have shown the NPLs retain their fluorescent properties also inside a cell, as shown in the bioimaging experiments. From these results, we believe that the combination of the superior chemical stability and colloidal stability of these NPLs in biological media along with the extremely high FB will foster the widespread use of these NPLs for all sorts of imaging applications.Experimental section
Materials
1-Octadecene (technical grade 90%, O806-1L), oleic acid (technical grade 90%, 364525-1L), cadmium nitrate tetrahydrate (CdNO3(H2O)4, 98%, 642045-100G), zinc nitrate hydrate (ZnNO3(H2O), 99.999%, 230006-25G), poly(isobutylene-alt-maleic anhydride) (85%, average Mw ∼ 6000, 12–200 mesh, 531278-250G), Dulbecco's phosphate buffered saline and sodium chloride were purchased from Aldrich. Cadmium acetate dihydrate (Cd(OAc)2(H2O)2, 98%, 317131000) was purchased from Acros Organics. Selenium powder −200 mesh (Se, 99.999%, 36208) and 1-octylamine (99%, B24193) was purchased from Alfa Aesar. Hexane (95% n-hexane, analytical reagent grade, H/0355/21) and tetrahydrofuran (THF, analytical reagent grade 99.99%, T/0701/17) was purchased from Fisher Chemical. Chloroform, stabilized with amylene (100%, 83627.290), absolute ethanol (20821.330), and sodium hydroxide (NaOH, 1 mol L−1 1N, UN1824) were purchased from VWR Chemicals. Thioacetamide (TAA, >98%, T0187) and 1-dodecylamine (>97%, D0980) was purchased from TCI. Boric acid (>99.8%, 6943.1) was purchased from Carl Roth GmbH and Qdot™ 655 ITK™ Carboxyl Quantum Dots were purchased from Thermo Fisher. Human blood serum was obtained from six healthy donors at the Transfusion Center of the University Clinic of Mainz, Germany, in accordance with the Declaration of Helsinki. For serum generation, blood was clotted overnight and centrifuged according to the standard procedure. All serum batches were pooled together and stored at −20 °C. For the serum preparation, blood is naturally coagulated so there were no additives used.Synthesis of 4 monolayer (4ML) thick CdSe NPLs
The 4ML CdSe NPLs were prepared modifying the procedure published by Mahler et al.22 Briefly, 60 mL of 1-octadecene, 320 mg (1.20 mmol) of Cd(OAc)2(H2O)2, and 879 μL (787 mg, 2.79 mmol) of oleic acid were added into a 100 mL three-neck flask. The mixture was degassed under vacuum while stirring at 110 °C for 90 min. After stopping the vacuum and putting the flask to argon, 48 mg (0.607 mmol) of Se powder was swiftly added into the flask and the temperature was set to 240 °C. When the temperature reached 205 °C, 160 mg (0.600 mmol) of Cd(OAc)2(H2O)2 was introduced into the reaction mixture and the reaction proceeded for 15 min at 240 °C. The mixture was then cooled to room temperature using a water bath and 6.7 mL of oleic acid was added. The mixture was centrifuged for 10 min at 5000 rpm (2599g), the supernatant was discarded and the precipitated NPLs were re-dispersed in 12 mL hexane.Synthesis of Cd0.33Zn0.67S shell
The shell synthesis to create core/shell NPLs was done by modifying an existing procedure.22 Briefly, 6 mL of the as-synthesized 4ML NPLs (optical density at 510 nm was 30) were added into a 50 mL round bottom flask. In a separate flask, 300 mg (3.99 mmol) of TAA, 3 mL (18.2 mmol) of octylamine and 9 mL of chloroform were combined, stirred for a few seconds and then sonicated in an ultrasound bath until the TAA dissolved. The TAA solution was added to the NPL solution while stirring. The mixture was stirred further for a couple of minutes. Then 500 μL of CdNO3 solution (0.2 M in ethanol) and 1000 μL of ZnNO3 solution (0.2 M in ethanol) were added into the mixture while stirring. The flask was capped and left to stir for 24 hours in ambient conditions.To stop the reaction and obtain the product, the mixture was first concentrated by evaporating some of the solvent using a rotatory evaporator at approximately 280 mbar, 40 °C for a couple of minutes. Then the concentrated mixture (volume approx. 15 mL) was centrifuged for 10 min at 8000 rpm (6654g), the supernatant was discarded, and the precipitated NPLs were suspended in 15 mL chloroform. To better stabilize the NPLs and to facilitate the polymer coating, 300 μL of ZnNO3 solution (0.2 M in ethanol) and 600 μL of oleic acid were added into the solution while stirring and the solution was kept at ambient conditions for a couple of days for PL recovery.
To remove the excess oleic acid introduced in this step, methyl acetate was added to the chloroform dispersion of core/shell NPLs (chloroform![[thin space (1/6-em)]](https://www.rsc.org/images/entities/char_2009.gif) :methyl acetate = 1:1 v/v). The NPLs were precipitated by centrifugation and re-dispersed in chloroform.
:methyl acetate = 1:1 v/v). The NPLs were precipitated by centrifugation and re-dispersed in chloroform.
Synthesis of dodecyl-grafted-poly(isobutylene-alt-maleic acid)
The amphiphilic polymer was synthesized according to the method described elsewhere.18 Briefly, 105.3 mg (0.662 mmol monomer units/1.10 × 10−5 mmol polymer) of poly(isobutylene-alt-maleic anhydride), 4.6 mg (0.013 mmol, equivalent to 2% of monomer units) of fluoresceinamine, 92.0 mg (0.497 mmol, equivalent to 75% of monomer units) of 1-dodecylamine and 25 mL of THF were combined in a 50 mL round bottom flask containing a magnetic stir bar. Note that the fluoresceinamine is used as a label to visualize the polymer and can be left out if unnecessary. Then a reflux condenser was attached and the mixture was heated to reflux. After approximately 10 minutes, the solution turned clear and it was kept refluxing for 18 hours. Then the solution was brought back to room temperature and the THF was removed using a rotatory evaporator. 13.24 mL of chloroform was then added to the solid polymer film to make a 0.05 M solution (based on monomer concentration).Preparation of boric acid buffer
To prepare the buffer, 80 mL of distilled water and 245.6 mg (3.972 mmol) of boric acid were mixed until the boric acid dissolved. Then a 1 N solution of NaOH was added into the boric acid solution until it reached pH 12.Polymer coating of NPLs and phase transfer
To coat the NPLs with the polymer, 7.5 mL of the core/shell NPLs (optical density = 2.574 at lowest-energy exciton peak) was added into a 2.125 mL polymer solution in a 50 mL round bottom flask. The flask was gently shook for a few seconds and the mixture was then evaporated gently using a rotatory evaporator until all the solvent is removed (approx. 10 minutes, 40 °C water bath). The remains were re-dispersed in chloroform, re-evaporated again for a total of three times to ensure even coating. Then 30 mL of boric acid buffer (pH 12) was added to open the remaining anhydride rings of the polymer in the dried polymer and NPLs mixture. The flask was gently shaken for 10 minutes for complete dispersion in water.Sucrose gradient separation
To remove the excess polymer introduce in the polymer coating step the NPLs were run through a sucrose density gradient. Water dispersed core/shell NPLs were concentrated with Amicon® Ultra-15 Centrifugal Filter (Mw cutoff 100k) by centrifuging the sample at 6.9k rpm (5000g) for 15 minutes. This step also removes small molecule impurities e.g. free fluoresceinamine if the labelled polymer coating is used. Sucrose solutions with 30/35/40/45/50/55% sucrose were prepared by dissolving 338.1/402.9/470.6/541.3/614.8/691.9 mg sucrose in 1 mL water each. Sucrose gradients were prepared by taking 200 μL sucrose solutions (highest % first) and adding them layer by layer into a 1.5 mL Eppendorf tube without shaking. After six layers of different sucrose concentrations, 100 μL of concentrated core/shell NPLs was added to the top and the tube was centrifuged at 16.6k rpm (20000g) for 45 minutes at room temperature. The NPLs penetrate into the sucrose gradient (see Fig. 2), therefore the sucrose above the NPLs was discarded. The sucrose gradient containing the NPLs was diluted with water and concentrated with Amicon filters to wash off the sucrose. The washing was repeated three times to ensure that the sucrose is removed.
Centrifugation
Centrifugation was done using a Sigma spin control 3–30k centrifuge. Centrifugation for the sucrose gradient separation was done with the 12110 – H rotor (12 × 1.5 mL tubes, fixed angle) while all other centrifugations were done with the 19776 rotor (6 × 50 mL tubes, fixed angle).
UV-vis absorption measurements
To measure the absorption spectra we used either an Agilent Cary 60 Spectrophotometer or Avantes spectrophotometer, consisting of Avantes AvaLight-DH-S-BAL as the UV-vis light source passing through a neutral density filter (optical density = 2.0) and fiber-coupled to an Avantes SensLine AvaSpec-HSC-TEC detector.Photoluminescence measurements
Photoluminescence spectra were recorded using an Avantes SensLine AvaSpec-HSC-TEC spectrophotometer in 90° geometry with a Prizmatix Silver high power LED as excitation source (emission peak 369 nm, FWHM ∼ 10 nm).Quantum yield measurements
Quantum yield measurements were made relative to reference dyes.34 Rhodamine 6G and Sulforhodamine 101 were dissolved in ethanol. CdSe core only NPLs and CdSe/CdZnS core/shell NPLs were diluted in hexane. Polymer coated CdSe/CdZnS core/shell NPLs were diluted in distilled water. Samples were diluted until the absorbance approaches a value of 0.1 at the wavelength of 370 nm. The photoluminescence of the samples were recorded at that concentration using blue LED excitation at 369 nm (full-width half maximum, FWHM ∼ 10 nm). Further dilution of the samples allowed us to obtain a linear fit between the sample absorption and the integrated photoluminescence, which was compared to the Rhodamine 6G/Sulforhodamine 101 standard linear fit to obtain the quantum yield of the samples.Fluorescence lifetime measurements
Fluorescence lifetime measurements were conducted with a FluoTime200 time-correlated single photon counting setup. Samples were excited with a green LED at 500 nm which was controlled by PicoQuant PDL 800-D. The signal was detected using a micro-channel plate photomultiplier tube that was connected to PicoHarp 300 time-correlated single photon counting system. The instrument response function was measured using a dispersion of silica nanoparticles (LUDOX® HS-40 colloidal silica) in water.Gel Electrophoresis
Gel Electrophoresis was conducted in 1% aragose gel and Tris acetate-EDTA (TAE) buffer (pH 8.3). The voltage applied was 10 V cm−1 for duration of 40 minutes. Typical sample loading used 10 μL of concentrated core/shell NPLs per well.Transmission electron microscope (TEM)
Samples were prepared by dropcasting a hexane/chloroform/water solution of the NPLs onto a carbon coated copper TEM grid. The grid sat on filter paper during the dropcasting to assist the drying of solvent. Routine TEM imaging was done using JEOL1400 TEM with an acceleration voltage of 120 kV. Microstructural characterization was done using a FEI Tecnai F20 TEM with an acceleration voltage of 200 kV.Fluorescence correlation spectroscopy (FCS)
Serum containing samples were prepared 30 min prior to the experiments by diluting 1 part of NPL stock solution with 20 parts serum. Experiments were performed on a commercial setup LSM 880 (Carl Zeiss), with a Zeiss C-Apochromat 40×/1.2 W water immersion objective. The one photon excitation was done by an argon laser (488 nm) and the two photon excitation by a Ti:Sa laser (Spectra Physics) operating at wavelength of 800 nm and providing ∼100 fs long pulses at repetition rate of 80 MHz. In both cases the emission in the range 550–700 nm was detected using a Quasar spectral detection unit (Carl Zeiss) operating in single-photon counting mode. The excitation power given in Fig. 4 refers to the power after the objective. Eight-well polystyrene-chambered coverglass (Nunc™ Lab-Tek™, Thermo Fisher Scientific) was used as a sample cell. For each solution, a series of 10 measurements with a total duration of 5 min were performed at room temperature (23 °C). The fluctuations of the fluorescent intensity δI(t) = I(t) − 〈I(t)〉 were recorded and analyzed by an autocorrelation function G(τ) = 1 + 〈δI(t)δI(t + τ)〉/〈I(t)〉2. For an ensemble of identical freely diffusing fluorescence species, G(τ) has the following analytical form: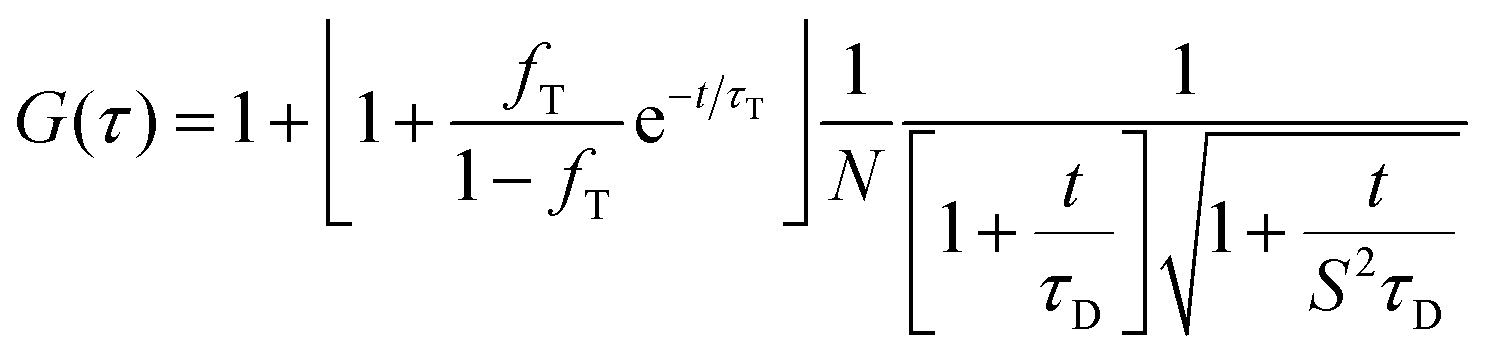 | (2) |
Inductively coupled plasma-optical emission spectrometry (ICP-OES)
All measurements were performed with an ACTIVA M spectrometer (Horiba Jobin Yvon, Bernsheim, Germany) equipped with a Meinhardt-type nebulizer, a cyclone chamber, and controlled by ACTIVAnalyst 5.4 software. The following conditions were applied: 1200W forward plasma power, 12L min−1 Ar flow and 15 rpm pump flow. The water dispersed NPLs were diluted in MilliQ water prior to measuring to reach ion concentrations in the range of 2–20 mg L−1. The carbon emission line at 193.026 nm (for the Cd measurements) and the argon emission line at 404.442 nm (for the Zn measurements) were used as the reference lines. Measurements were performed three times per emission line, using three different elemental emission lines. As baseline correction, a dynamic underground correction provided by the software was used. The emission lines chosen for the characterization of the respective elements were: Cd: 326.105 nm, 346.620 nm, 361.051 nm; Zn: 202.548 nm, 206.200 nm, 213.857 nm.
The concentration of the NPLs was determined by the following equation:
 :Zn ratio in one platelet was found to match well with the actual ratio of Cd:Zn measured by ICP.
000 cells per well) in DMEM with all supplements. The next day, the medium was removed and NPLs were added to cells at a concentration between 18–150 μg mL−1 in DMEM with all supplements or DMEM without FBS. After 24 h, cells were detached with trypsin-EDTA (Gibco, Germany), centrifuged (500g, 5 min) and resuspended in PBS (1 mL). Flow cytometry measurements were performed on an Attune NxT flow cytometer (Thermo Fisher, USA).
000 cells per well) were seeded in Ibidi iTreat-dishes (IBIDI, Germany). The next day, the medium was removed and NPLs were added to cells at a concentration of 18 or 37 μg mL−1 in DMEM with all supplements or DMEM without FBS. After 24 h, the NPLs were removed and the cell membrane was stained with CellMask Green (dilution 1:5000 in PBS, Thermo Fisher, USA). Images were acquired on a Leica TCS SP5 II microscope with an HC PL APO CS 63×/1.4 oil objective using the LAS AF 3000 software. NPLs are pseudo-colored in red and the cell membrane is pseudo-colored in green.
:Zn ratio in one platelet was found to match well with the actual ratio of Cd:Zn measured by ICP.
000 cells per well) in DMEM with all supplements. The next day, the medium was removed and NPLs were added to cells at a concentration between 18–150 μg mL−1 in DMEM with all supplements or DMEM without FBS. After 24 h, cells were detached with trypsin-EDTA (Gibco, Germany), centrifuged (500g, 5 min) and resuspended in PBS (1 mL). Flow cytometry measurements were performed on an Attune NxT flow cytometer (Thermo Fisher, USA).
000 cells per well) were seeded in Ibidi iTreat-dishes (IBIDI, Germany). The next day, the medium was removed and NPLs were added to cells at a concentration of 18 or 37 μg mL−1 in DMEM with all supplements or DMEM without FBS. After 24 h, the NPLs were removed and the cell membrane was stained with CellMask Green (dilution 1:5000 in PBS, Thermo Fisher, USA). Images were acquired on a Leica TCS SP5 II microscope with an HC PL APO CS 63×/1.4 oil objective using the LAS AF 3000 software. NPLs are pseudo-colored in red and the cell membrane is pseudo-colored in green.
Conflicts of interest
There are no conflicts to declare.Acknowledgements
Henry Halim was supported by a fellowship from the Max Planck Graduate Center (MPGC), Mainz, Germany. We thank Taniya Chakraborty for the help with the gel electrophoresis separation, Özlem Yildiz for preparing some of the core/shell NPLs samples, Michael Steiert for ICP-OES measurements and Katharina Landfester for discussion. Open Access funding provided by the Max Planck Society.Notes and references
- P. Zrazhevskiy, M. Sena and X. Gao, Chem. Soc. Rev., 2010, 39, 4326–4354 RSC.
- X. Gao, L. Yang, J. A. Petros, F. F. Marshall, J. W. Simons and S. Nie, Curr. Opin. Biotechnol., 2005, 16, 63–72 CrossRef CAS.
- F. Zhang, Z. Ali, F. Amin, A. Riedinger and W. J. Parak, Anal. Bioanal. Chem., 2010, 397, 935–942 CrossRef CAS.
- O. Chen, J. Zhao, V. P. Chauhan, J. Cui, C. Wong, D. K. Harris, H. Wei, H.-S. Han, D. Fukumura, R. K. Jain and M. G. Bawendi, Nat. Mater., 2013, 12, 445–451 CrossRef CAS.
- S. Ithurria and B. Dubertret, J. Am. Chem. Soc., 2008, 130, 16504–16505 CrossRef CAS.
- S. Ithurria, M. D. Tessier, B. Mahler, R. P. S. M. Lobo, B. Dubertret and A. L. Efros, Nat. Mater., 2011, 10, 936–941 CrossRef CAS.
- M. D. Tessier, B. Mahler, B. Nadal, H. Heuclin, S. Pedetti and B. Dubertret, Nano Lett., 2013, 13, 3321–3328 CrossRef CAS.
- A. Riedinger, A. S. Mule, P. N. Knüsel, F. D. Ott, A. A. Rossinelli and D. J. Norris, Chem. Commun., 2018, 54, 11789–11792 RSC.
- A. Riedinger, F. D. Ott, A. Mule, S. Mazzotti, P. N. Knüsel, S. J. P. Kress, F. Prins, S. C. Erwin and D. J. Norris, Nat. Mater., 2017, 16, 743–748 CrossRef CAS.
- M. D. Tessier, C. Javaux, I. Maksimovic, V. Loriette and B. Dubertret, ACS Nano, 2012, 6, 6751–6758 CrossRef CAS.
- R. Scott, A. W. Achtstein, A. Prudnikau, A. Antanovich, S. Christodoulou, I. Moreels, M. Artemyev and U. Woggon, Nano Lett., 2015, 15, 4985–4992 CrossRef CAS.
- D. Kechkeche, E. Cao, C. Grazon, F. Caschera, V. Noireaux, M.-L. Baron Niel and B. Dubertret, ACS Appl. Mater. Interfaces, 2018, 10, 24739–24749 CrossRef CAS.
- S. J. Lim, D. R. McDougle, M. U. Zahid, L. Ma, A. Das and A. M. Smith, J. Am. Chem. Soc., 2016, 138, 64–67 CrossRef CAS.
- S. Shendre, S. Delikanli, M. Li, D. Dede, Z. Pan, S. T. Ha, Y. H. Fu, P. L. Hernández-Martínez, J. Yu, O. Erdem, A. I. Kuznetsov, C. Dang, T. C. Sum and H. V. Demir, Nanoscale, 2019, 11, 301–310 RSC.
- S. Jana, T. N. T. Phan, C. Bouet, M. D. Tessier, P. Davidson, B. Dubertret and B. Abecassis, Langmuir, 2015, 31, 10532–10539 CrossRef CAS.
- M. Pelton, S. Ithurria, R. D. Schaller, D. S. Dolzhnikov and D. V. Talapin, Nano Lett., 2012, 12, 6158–6163 CrossRef CAS.
- T. Pellegrino, L. Manna, S. Kudera, T. Liedl, D. Koktysh, A. L. Rogach, S. Keller, J. Rädler, G. Natile and W. J. Parak, Nano Lett., 2004, 4, 703–707 CrossRef CAS.
- A. Riedinger, F. Zhang, F. Dommershausen, C. Rocker, S. Brandholt, G. U. Nienhaus, U. Koert and W. J. Parak, Small, 2010, 6, 2590–2597 CrossRef CAS.
- L. Lartigue, D. Alloyeau, J. Kolosnjaj-Tabi, Y. Javed, P. Guardia, A. Riedinger, C. Péchoux, T. Pellegrino, C. Wilhelm and F. Gazeau, ACS Nano, 2013, 7, 3939–3952 CrossRef CAS.
- W. G. Kreyling, A. M. Abdelmonem, Z. Ali, F. Alves, M. Geiser, N. Haberl, R. Hartmann, S. Hirn, D. J. de Aberasturi, K. Kantner, G. Khadem-Saba, J.-M. Montenegro, J. Rejman, T. Rojo, I. R. de Larramendi, R. Ufartes, A. Wenk and W. J. Parak, Nat. Nanotechnol., 2015, 10, 619–624 CrossRef CAS.
- A. Carambia, B. Freund, D. Schwinge, O. T. Bruns, S. C. Salmen, H. Ittrich, R. Reimer, M. Heine, S. Huber, C. Waurisch, A. Eychmüller, D. C. Wraith, T. Korn, P. Nielsen, H. Weller, C. Schramm, S. Lüth, A. W. Lohse, J. Heeren and J. Herkel, J. Hepatol., 2015, 62, 1349–1356 CrossRef CAS.
- B. Mahler, B. Nadal, C. Bouet, G. Patriarche and B. Dubertret, J. Am. Chem. Soc., 2012, 134, 18591–18598 CrossRef CAS.
- S. Yadav, A. Singh, L. Thulasidharan and S. Sapra, J. Phys. Chem. C, 2018, 122, 820–829 CrossRef CAS.
- S. H. Lee, B. K. Salunke and B. S. Kim, Biotechnol. Bioprocess Eng., 2014, 19, 169–174 CrossRef CAS.
- K. Koynov and H.-J. Butt, Curr. Opin. Colloid Interface Sci., 2012, 17, 377–387 CrossRef CAS.
- I. Negwer, A. Best, M. Schinnerer, O. Schäfer, L. Capeloa, M. Wagner, M. Schmidt, V. Mailänder, M. Helm, M. Barz, H.-J. Butt and K. Koynov, Nat. Commun., 2018, 9, 5306–5314 CrossRef.
- S. Morsbach, G. Gonella, V. Mailänder, S. Wegner, S. Wu, T. Weidner, R. Berger, K. Koynov, D. Vollmer, N. Encinas, S. L. Kuan, T. Bereau, K. Kremer, T. Weil, M. Bonn, H.-J. Butt and K. Landfester, Angew. Chem., Int. Ed., 2018, 57, 12626–12648 CrossRef CAS.
- N. C. Shaner, P. A. Steinbach and R. Y. Tsien, Nat. Methods, 2005, 2, 905–909 CrossRef CAS.
- A. A. Rossinelli, A. Riedinger, P. Marques-Gallego, P. N. Knusel, F. V. Antolinez and D. J. Norris, Chem. Commun., 2017, 53, 9938–9941 RSC.
- P. Foroozandeh and A. A. Aziz, Nanoscale Res. Lett., 2018, 13, 339 CrossRef.
- Y.-B. Hu, E. B. Dammer, R.-J. Ren and G. Wang, Transl. Neurodegener., 2015, 4, 18 CrossRef.
- S. Schöttler, K. Klein, K. Landfester and V. Mailänder, Nanoscale, 2016, 8, 5526–5536 RSC.
- S. Schöttler, G. Becker, S. Winzen, T. Steinbach, K. Mohr, K. Landfester, V. Mailänder and F. R. Wurm, Nat. Nanotechnol., 2016, 11, 372 CrossRef.
- U. Resch-Genger and K. Rurack, Pure Appl. Chem., 2013, 85, 2005–2013 CAS.
Footnote |
| † Electronic supplementary information (ESI) available: Halim_etal_2019_SI.pdf. See DOI: 10.1039/c9tb02377a |
| This journal is © The Royal Society of Chemistry 2020 |