
Anti-breast cancer activity of resveratrol encapsulated in liposomes†
Y. N.
Zhao
a,
Y. N.
Cao
a,
J.
Sun
a,
Z.
Liang
b,
Q.
Wu
a,
S. H.
Cui
a,
D. F.
Zhi
a,
S. T.
Guo
*c,
Y. H.
Zhen
*b and
S. B.
Zhang
 *a
*a
aKey Laboratory of Biotechnology and Bioresources Utilization of Ministry of Education, Dalian Minzu University, Dalian, Liaoning 116600, China. E-mail: zsb@dlnu.edu.cn; Tel: +86 411 87656141
bCollege of Pharmacy, Dalian Medical University, Dalian, Liaoning 116044, China. E-mail: zhenyhwaner@aliyun.com; Tel: +86 411 86110414
cKey Laboratory of Functional Polymer Materials of Ministry of Education and State Key Laboratory of Medicinal Chemical Biology and Institute of Polymer Chemistry, College of Chemistry, Nankai University, Tianjin, 300071, China. E-mail: stguo@nankai.edu.cn
First published on 14th November 2019
Abstract
Resveratrol (RES) is a naturally occurring and effective drug for tumor prevention and treatment. However, its low levels of aqueous solubility, stability, and poor bioavailability limit its application, especially when used as a free drug. In this study, RES was loaded into peptide and sucrose liposomes (PSL) to enhance the physico-chemical properties of RES and exploit RES delivery mediated by liposomes to effectively treat breast cancer. RES loaded PSL (the complex: PSL@RES) were stable, had a good RES encapsulation efficiency, and prolonged RES-release in vitro. PSL@RES was exceptionally efficient for inhibiting the growth of cancer cells, as the IC50 of PSL@RES in MCF-7 cells was found to be only 20.89 μmol L−1. The therapeutic efficacy of PSL@RES was evaluated in mice bearing breast cancer. The results showed that PSL@RES at a dosage of 5 mg kg−1 was more effective than 10 mg kg−1 free RES, and PSL@RES inhibited tumor growth completely at a dosage of 10 mg kg−1. PSL@RES induced apoptosis in breast tumor by upregulation of p53 expression. This then downregulated Bcl-2 and upregulated Bax, thereby inducing Caspase-3 activation. More importantly, encapsulation of RES within peptide liposomes greatly reduced the toxicity of free RES to mice. Overall, the simple formulation of liposomal nanocarriers of RES developed in this study produces satisfactory outcomes to encourage further applications of liposomal carriers for the treatment of breast cancer.
Introduction
Recently, there is increased interest in the use of agents derived from natural products for cancer therapy. Resveratrol (3,5,4′-trihydroxystilbene; RES) is a naturally occurring polyphenol and phytoalexin compound (Fig. 1) found in large quantities in red wine, berries, peanuts and soybeans. RES has attracted considerable attention in the last two decades for its purported health-promoting benefits in humans, such as antioxidant, anti-inflammatory, and putative benefits for the cardiovascular system, including cardio-protective activities.1–3 The interest in anti-cancer properties of RES is heightened after its chemo preventive effects were demonstrated at all stages of cancer including initiation, promotion and progression.4,5 Several studies propose that RES could have a strong anti-tumor activity by inducing apoptosis and/or cell cycle arrest in various mammary cancer cell lines.6–9 In particular, breast cancer is inhibited by the use of RES, and several animal experiments have revealed a decreased incidence of mammary tumor formation and delayed tumor onset following treatment with RES.10–12 | ||
| Fig. 1 Structure of trans-3,5,4′-trihydroxystilbene (a) and cis-3,5,4′-trihydroxystilbene (b). The trans isomer is the biologically active form of the drug. | ||
However, like many polyphenolic compounds, RES is characterized by poor bioavailability, as the solubility of RES in water and physiological fluid is less than 0.1 mg mL−1.13 Moreover, a high dosage of RES is required to reach significant beneficial effects.14 Many studies show that greater than 200 μmol L−1 RES should be used to inhibit the growth of cancer cells,15 and usually only dosage over 50 mg kg−1 shows anti-tumor activity in animals. This dosage leads to a high number of side effects.16 A strategy to circumvent the above-mentioned limitations is to load RES into water soluble carriers, which offers chemical and biological protection. Liposomes are one of the promising nanocarriers that have drawn considerable attention in the pharmaceutical field for delivering genes, proteins, and drugs.17–20 The widely acclaimed advantage of liposomes has been the encapsulation of both hydrophilic compounds (in the core) and hydrophobic compounds (in the lipidic-bilayers). They are remarkably cheap, non-toxic and bio-compatible in nature. However, the major limitation of utilizing liposomes for delivery of hydrophobic drugs is their stability and low drug loading rates. They are suspected to be capable of causing unquantifiable harm to normal tissues.21–23 Although a few studies show that liposomes with specific properties improve the stabilization of drug-liposomes and drug encapsulation efficiency, the problem of implementing high dosage utilization of RES remains unresolved. In one study, RES-loaded and YHWYGYTPQNVI-conjugated liposomes shows a half maximal inhibitory concentration in head and neck cancer cells of 151.59 μmol L−1 RES.24 In addition, the reported delivery systems mediated by liposomes are too complex, causing difficulties in implementing the clinical applications of RES.
In this study, we constructed novel and simple RES liposomes (PSL@RES) through the assembly of the tri-peptide lipid CDO (1,2-bis-myristyloxyamidopropyl ornithine), sucrose laurate L126, and RES. The formulation inhibited the growth of breast cancer at very low dosage (10 mg kg−1 RES) and also exhibited controlled release of RES in cells due to the presence of a hydrolyzable carbamate linker in the lipid structure. As we used peptide lipid and sucrose laurate to form the RES liposome, it exhibited very low toxicity to mice. To the best of our knowledge, this is the first study to report the delivery of RES by a peptide liposomal carrier for inhibition of breast cancer in vitro and in vivo.
Results and discussion
Blank liposomes were prepared using the peptide lipid CDO and sucrose laurate L126 at the weight ratio of 1![[thin space (1/6-em)]](https://www.rsc.org/images/entities/char_2009.gif) :1. RES was loaded into the liposome to obtain PSL@RES liposomes using the thin-film hydration method at the lipid/drug weight ratios of 1:1, 5:1 and 10:1. The encapsulation efficiency (EE) of RES in PSL@RES at the lipid/drug ratio of 1:1 was less than 70%, but over 90% at the ratios of 5:1 and 10:1 (Fig. S1, ESI†). To reduce the toxicity of lipids, we select relatively less lipid content under the same drug loading. So we chose PSL@RES with the lipid/drug ratio of 5:1 to use for the current study. PSL@RES was measured for particle size, zeta potential and morphology, as shown in Fig. 2. The average particle size of the peptide liposome (PSL) was about 120 nm with a narrow size distribution (Fig. 2a). Addition of RES increased the average PSL@RES size by about 20 nm, and these particles still maintained a homogeneous distribution. The particles within the size range of 100–200 nm can escape systemic clearance by Kupffer cells and remain in the blood circulation for longer times.25,26 This may enhance the bioavailability of RES. The zeta potential of blank liposome PSL was 42.3 mV (Fig. 2b), and that of PSL@RES decreased slightly after RES encapsulation. TEM images indicate that both types of PSL particles were spherical, and RES was visibly encapsulated in PSL@RES particles as shown in Fig. 2c and d. The PSL@RES liposome exhibited excellent stability for three months at 4 °C and it was also stable at 37 °C in 48 h, as evidenced from measurements of the particle size, zeta potential changes (Fig. S2, ESI†) and the TEM images of PSL@RES at 4 °C and 37 °C (Fig. S3, ESI†).
:1. RES was loaded into the liposome to obtain PSL@RES liposomes using the thin-film hydration method at the lipid/drug weight ratios of 1:1, 5:1 and 10:1. The encapsulation efficiency (EE) of RES in PSL@RES at the lipid/drug ratio of 1:1 was less than 70%, but over 90% at the ratios of 5:1 and 10:1 (Fig. S1, ESI†). To reduce the toxicity of lipids, we select relatively less lipid content under the same drug loading. So we chose PSL@RES with the lipid/drug ratio of 5:1 to use for the current study. PSL@RES was measured for particle size, zeta potential and morphology, as shown in Fig. 2. The average particle size of the peptide liposome (PSL) was about 120 nm with a narrow size distribution (Fig. 2a). Addition of RES increased the average PSL@RES size by about 20 nm, and these particles still maintained a homogeneous distribution. The particles within the size range of 100–200 nm can escape systemic clearance by Kupffer cells and remain in the blood circulation for longer times.25,26 This may enhance the bioavailability of RES. The zeta potential of blank liposome PSL was 42.3 mV (Fig. 2b), and that of PSL@RES decreased slightly after RES encapsulation. TEM images indicate that both types of PSL particles were spherical, and RES was visibly encapsulated in PSL@RES particles as shown in Fig. 2c and d. The PSL@RES liposome exhibited excellent stability for three months at 4 °C and it was also stable at 37 °C in 48 h, as evidenced from measurements of the particle size, zeta potential changes (Fig. S2, ESI†) and the TEM images of PSL@RES at 4 °C and 37 °C (Fig. S3, ESI†).
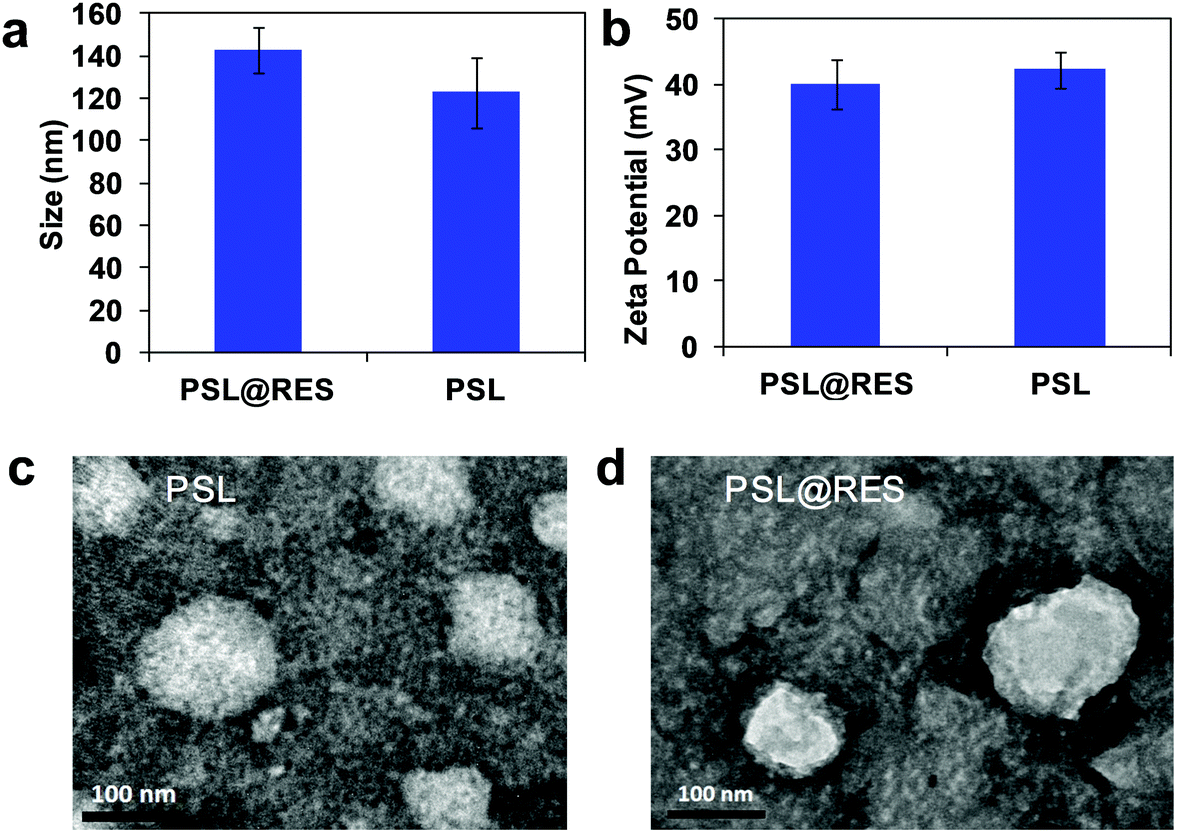 | ||
| Fig. 2 Particle size (a), zeta potential (b), morphology of PSL (c), and PSL@RES (d). Transmission electron microscopy (TEM) images of PSL and PSL@RES at 8000× magnification (scale bar 100 nm). | ||
To find out the protection of liposome PSL to RES in the blood circulation system and tumor micro-environment, and the controlled release of the drug at the target site, we tested RES release from the liposome complex in the simulated acidic tumor micro-environment (pH 6.8) and endosomes/lysosomes (pH 5.5) using a dialysis membrane sleeve. Fig. 3 showed that molecular RES reached the highest concentration in a very short time, whereas the liposome complex PSL@RES released RES very slowly. Only 30% RES was released at pH 6.8. At the same time, under the endosomes/lysosomes environment (pH 5.5), the RES release rate of PSL@RES increased significantly compared with RES release from PSL@RES at pH 6.8. Nearly 96% RES was released in approximately 50 h. These results demonstrated that the peptide liposomal carrier was stable under neutral pH conditions and inhibited RES from being released into the blood circulation. In the acidic environment, the breakage of carbamate linkages in the lipid structure and the proton sponge effect afforded the PSL@RES complex efficient RES sustained release.
 | ||
| Fig. 3 Accumulative RES release in vitro. All values are expressed as mean ± SD (n = 3), significance level: **p < 0.01. | ||
To evaluate in vitro anticancer activity of RES liposomes, we first investigated the effects of the RES liposome on the viability of human breast cancer MCF-7 cells by employing the MTT assay and using free RES as a control. As shown in Fig. 4a, both PSL@RES and RES produced attrition of MCF-7 cells in a dose-dependent manner in the RES concentration range of 2–64 μmol L−1. PSL@RES was more efficient in inhibiting the growth of cancer cells than RES, as the IC50 of PSL@RES and RES in MCF-7 cells were 20.89 μmol L−1 and 25.67 μmol L−1, respectively. To investigate the cytotoxicity of PSL@RES on non-malignant cells, a viability assay was performed in MCR-5 cells, which were a variety of human lung fibroblasts. The results in Fig. 4b indicate that PSL@RES had much lower toxicity to MCR-5 cells than to MCF-7 cells. For example, after treatment with PSL@RES containing a RES concentration of 64 μmol L−1, cell viability of MCR-5 was 85%, whereas that of MCF-7 cells was only 23%. Furthermore, RES induced more MCR-5 cell death than PSL@RES. We also found that the blank liposome PSL offered no impediment to the survival of the two cell lines. The above results confirmed that PSL@RES liposome was selective in killing cancer cells over normal cells, and PSL could lower the cytotoxicity of RES to normal cells. Since the lipid in PSL liposome was composed of acid-responsive carbamate bond, RES could release from the liposome after the endocytosis of PSL@RES under the endosomes/lysosomes environment of tumor cells. In addition, we used an ornithine head lipid and sucrose ester to prepare liposomes that are more biocompatible than other components, such as quaternary ammonium lipids, we could increase the tolerance of cells to the liposome complexes. Therefore, PSL@RES appeared to be superior to RES alone, as it inhibited the growth of tumor cells but had significantly less toxicity to normal cells.
 | ||
| Fig. 4 Effects of liposomes PSL@RES on the cell viability of MCF-7 cancer cells (a) and MCR-5 non-malignant cells (b). Data represent the mean ± SD of three independent experiments. | ||
As apoptosis is one of the most common causes of cell death, the ability of PSL@RES liposomes to initiate apoptosis was studied in MCF-7 cells by fluorescence microscopy and flow cytometry. As shown in Fig. 5a, the population of apoptotic cells increased with increasing RES concentration. PSL@RES was capable of inducing greater cell apoptosis than RES alone when applied at lower RES concentrations. For applications of PSL@RES, the rate of cell apoptosis was over 60% when the concentration of RES was 16 μM, but only 45% for RES was alone applied under the same conditions. We found that there was no significant difference between the two groups at a RES concentration of 64 μM (Fig. 5b and c). In addition, few necrotic cells were observed for either PSL@RES or RES groups in the range of all RES concentrations. For the blank liposome PSL group, apoptotic cells remained at low levels, although they slightly increased upon raising the PSL concentration (Fig. 5d). These data also demonstrated that the cytotoxicity of PSL liposomes was low.
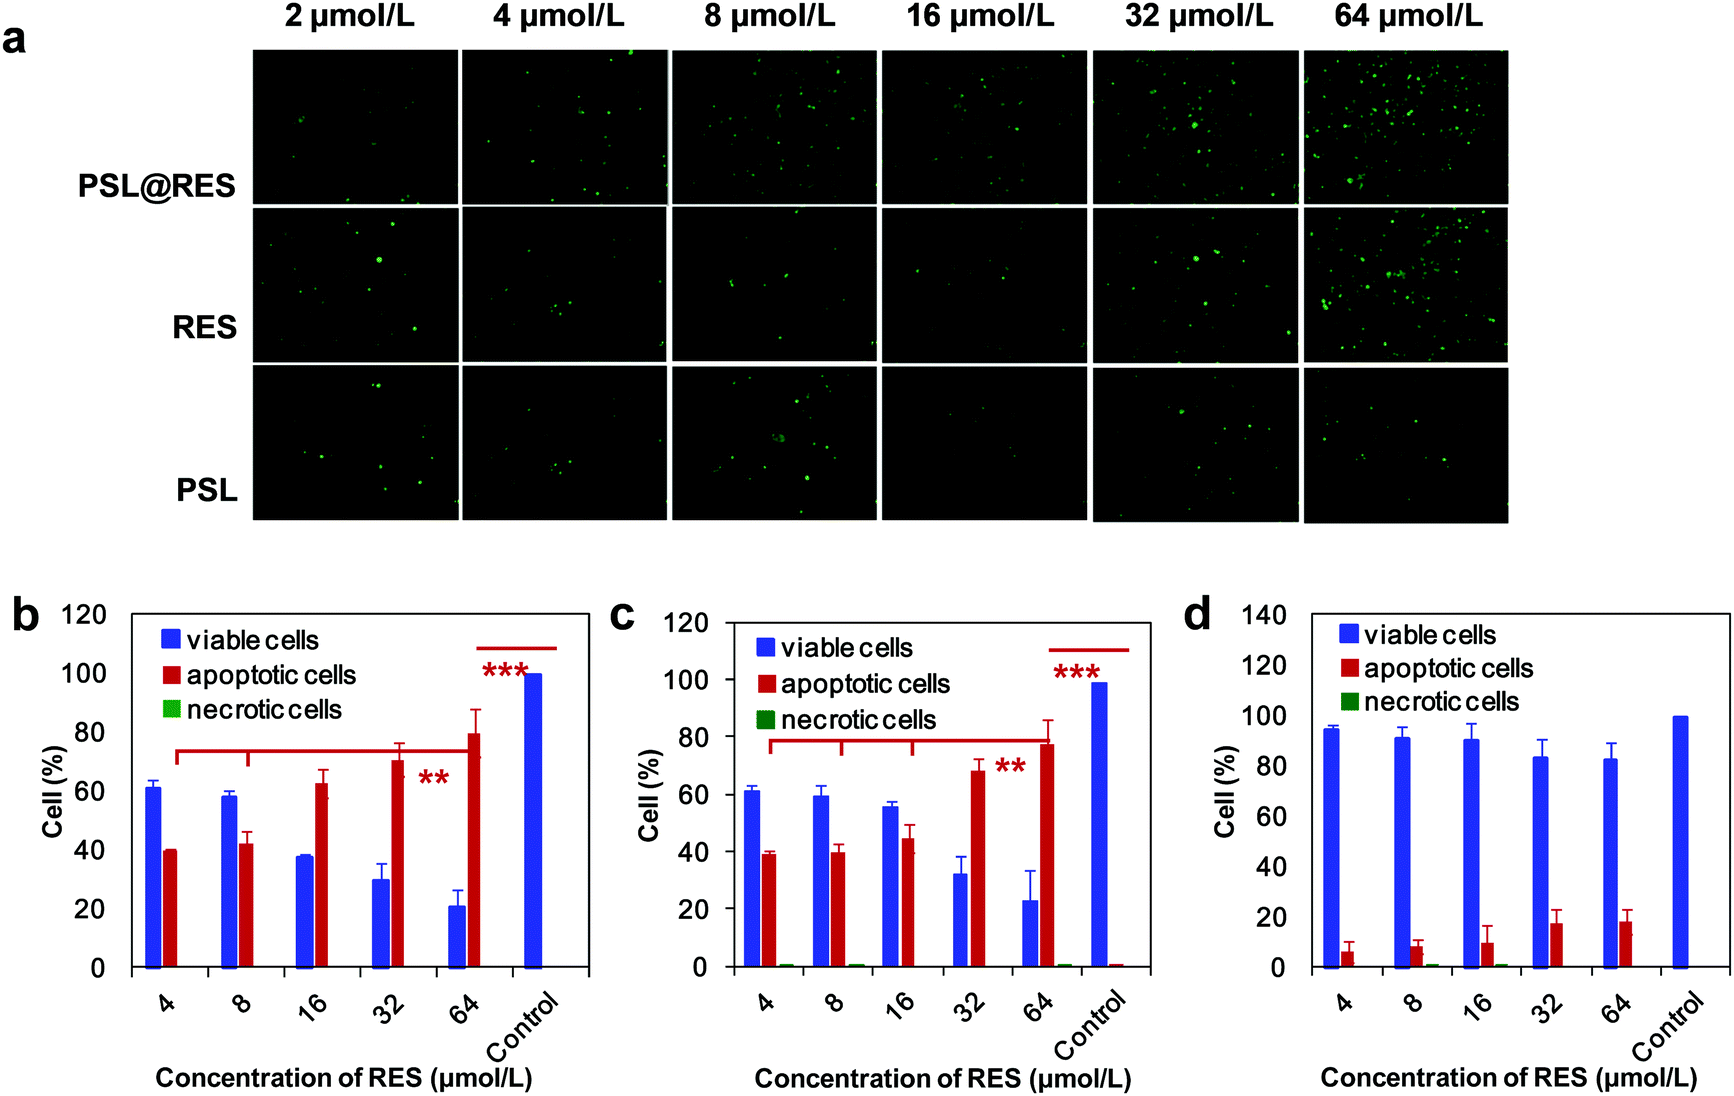 | ||
| Fig. 5 MCF-7 cells were treated with PSL@RES for 48 h before staining with AnV-Alexa Fluor 488® and PI and analyzed by imaging under an inverted fluorescence microscope (a: 200×) and quantified by flow cytometry (b: PSL@RES, c: RES, d: PSL). Cells labeled with one or both compounds were analyzed using a quadrant plot. Significance level: **p < 0.01 and ***p < 0.001. | ||
Intracellular reactive oxygen species (ROS) plays an important role in apoptosis and accumulating experimental evidence has demonstrated involvement of ROS in RES-induced apoptosis in a variety of cancer cells.27–29 To produce more information about the role of ROS in this study, we measured the production of intracellular ROS by the 2′,7′-dichlorofluorescein diacetate (DCFH-DA) assay. As shown in Fig. 6a, the level of ROS generation gradually increased with increasing RES concentration. Significant levels of ROS were generated in MCF-7 cells at a RES concentration of 64 μM by treatment with both PSL@RES and free RES. The average value of the fluorescence intensity in cells were 4 and 3.4 folds higher than those in untreated cells for applications of PSL@RES and RES, respectively. These results suggest that the apoptosis induced by RES could occur by means of its pro-oxidant effects on cancer cells, as observed in other studies.30–32 Caspases are key effectors of apoptosis in mammalian cells. Active caspases participate in a cascade of cleavage events that disable key homeostatic and repair enzymes and initiate apoptosis. Higher Caspase-8, Caspase-9 and Caspase-3 activities were observed upon addition of PSL@RES and RES compared to the untreated control group. Fig. 6b–d showed that the levels of caspases noticeably increased with the increase in RES concentration. PSL@RES treated cells had slightly higher caspase activities compared to the RES group, although there was no significant difference between the two groups. We concluded that cells treated with PSL@RES generated more ROS, and consequently induced greater apoptosis than RES.
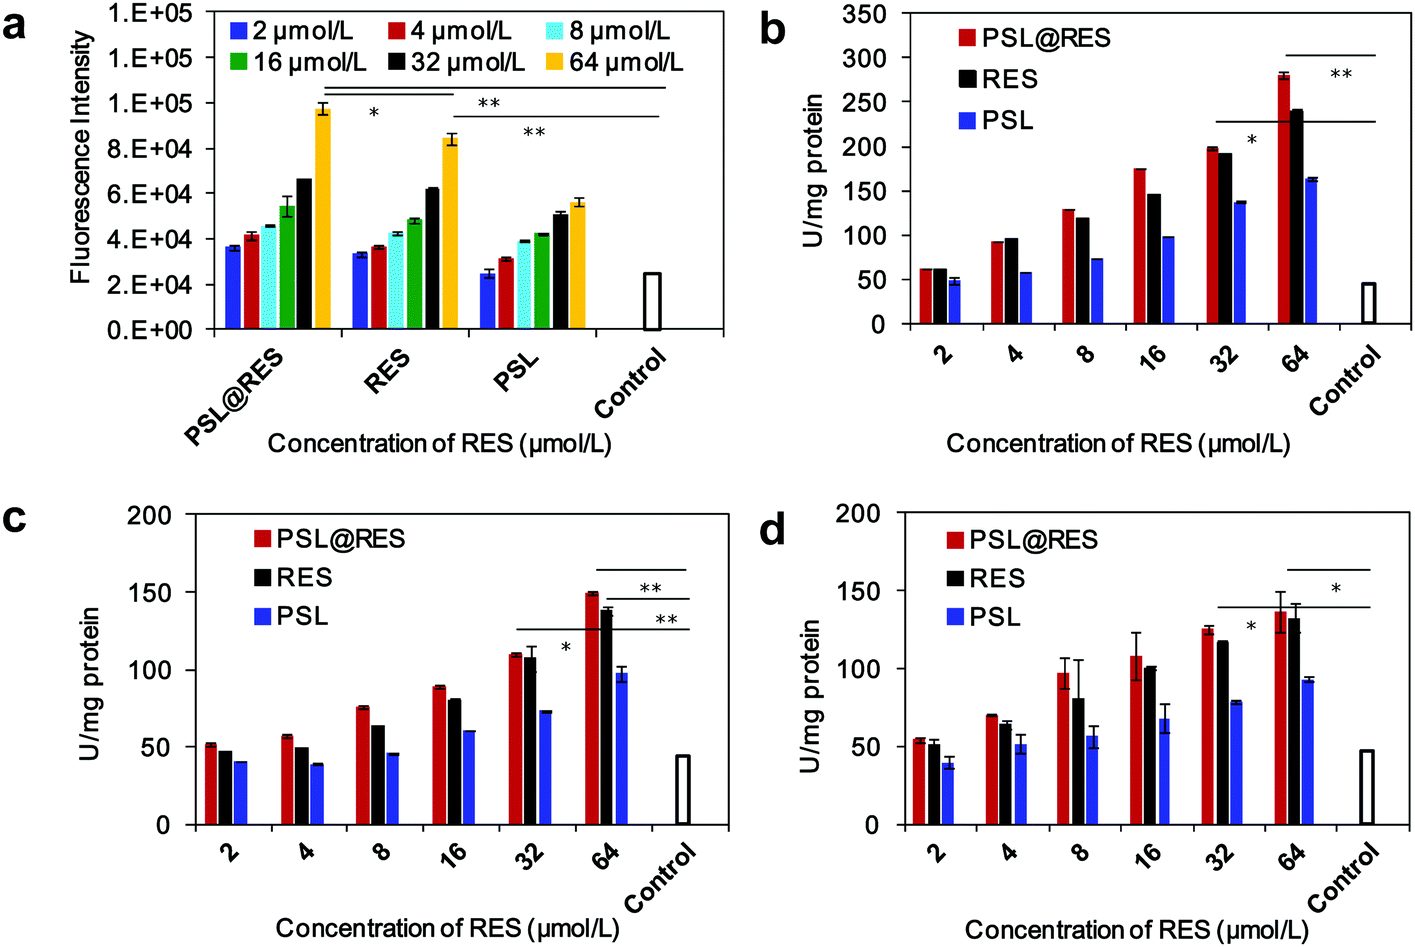 | ||
| Fig. 6 Intracellular ROS levels determined by CM-DCHF-DA staining combined with flow cytometry (a). Protein levels of Caspase-8 (b), Caspase-9 (c) and Caspase-3 (d). Significance levels: *p < 0.05 and **p < 0.01. | ||
In vivo therapeutic efficacy of RES liposome complexes on tumor-bearing mice was studied as well. BALB/c mice bearing MCF-7 breast cancer with tumor volumes of approximately 100 mm3 in the right flanks were treated with PSL@RES-10 (10 mg kg−1 RES), PSL@RES-5 (5 mg kg−1 RES), PSL@RES-2.5 (2.5 mg kg−1 RES) and RES-10 (10 mg kg−1 RES) with six consecutive tail intravenous injections on days 1, 3, 5, 7, 9 and 11. Photos of the tumors in Fig. 7a demonstrated that the growth of all tumors in the drug treatment groups was inhibited compared with the control group. The PSL@RES-10 treatment group showed the greatest growth inhibition. The curves of tumor growth (Fig. 7b) were used to further analyze the inhibition rates. Compared with the RES-10 group, the PSL@RES-5 group exhibited slightly greater efficiency in the reduction of tumor volume, although only half (5 mg kg−1) of the RES concentration was used. More importantly, PSL@RES-10 was nearly three times more effective than RES-10 at inhibiting tumor growth, demonstrating a significant difference over time (p < 0.01). The dosages used here were much lower than those reported in other studies.33,34 In addition, TUNEL and DAPI staining of the tumors confirmed that the PSL@RES-10 and PSL@RES-5 doses resulted in greater apoptosis in tumor cells as compared to the RES-10 dose (Fig. 7c).
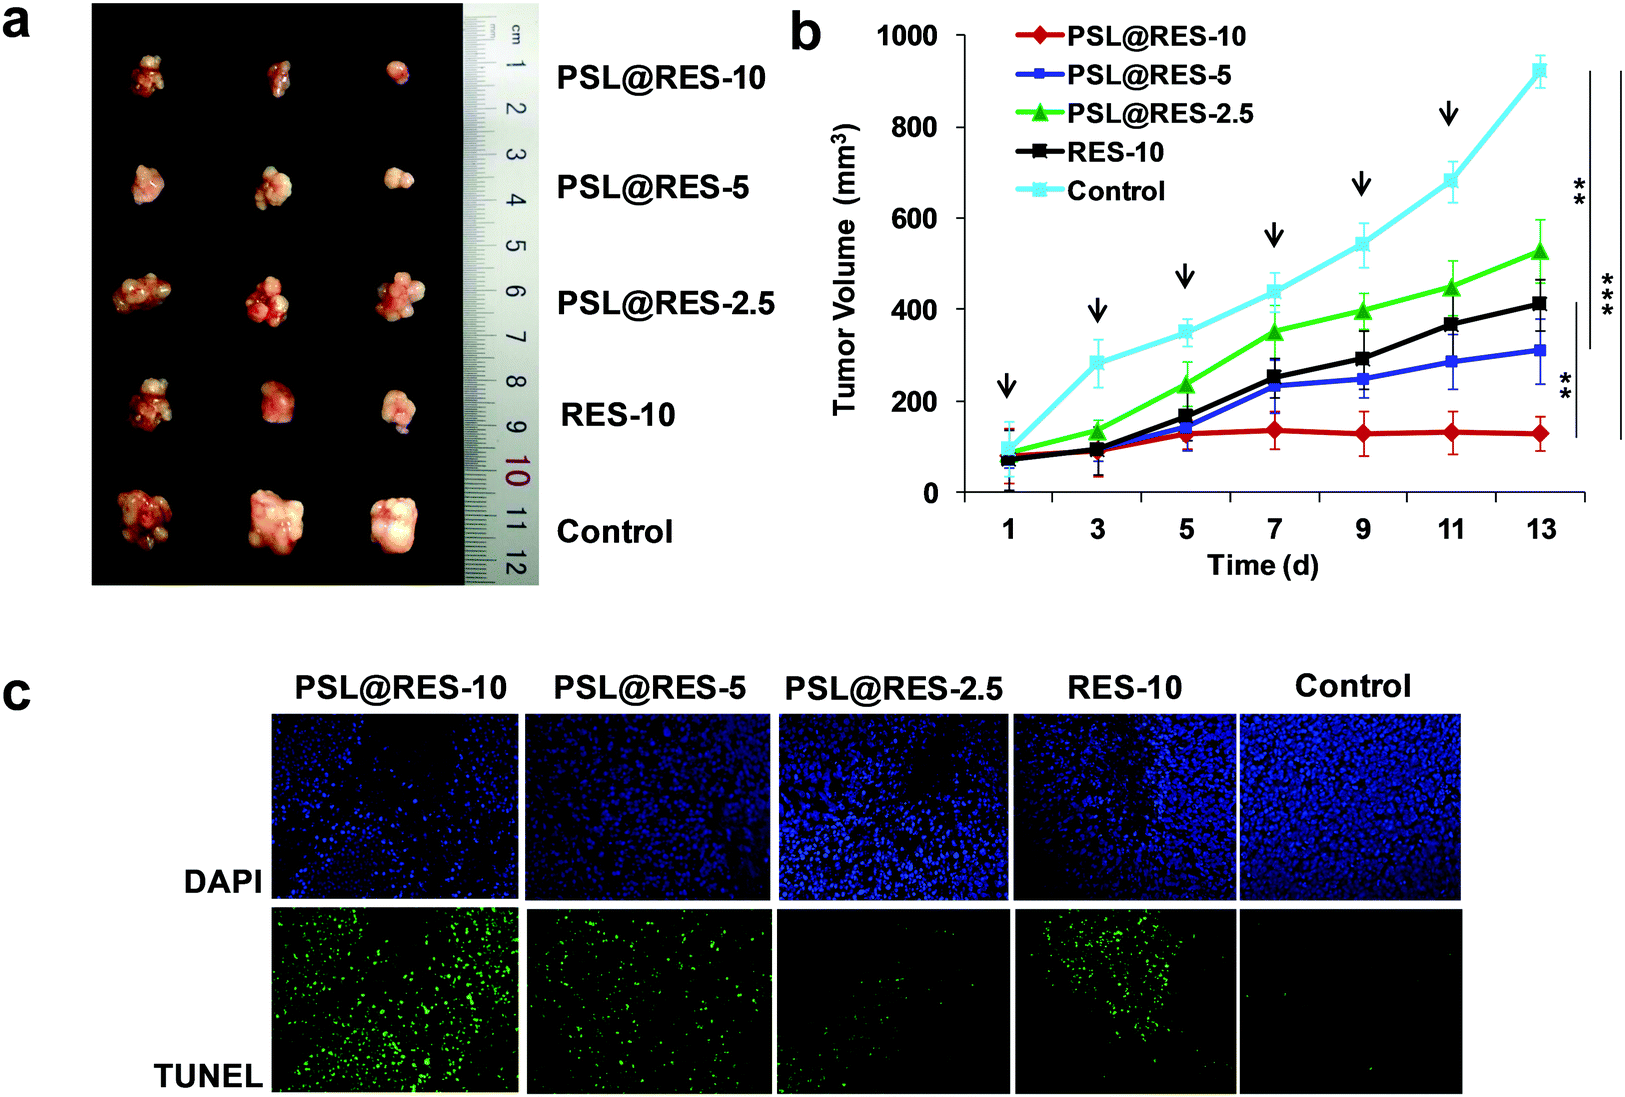 | ||
| Fig. 7 In vivo antitumor efficacy of RES liposomes in MCF-7 tumor-bearing mice. Photos of tumor growth in mice (a). Tumor growth as a function of time; results are presented as the means ± SD. **p < 0.01, ***p < 0.001 (b). Evaluation of tumor cell apoptosis in vivo by TUNEL assay (nuclei were stained blue with DAPI, apoptotic cells were shown in green) (c). Mice received injections of PSL@RES-10 (10 mg kg−1), PSL@RES-5 (5 mg kg−1) and PSL@RES-2.5 (2.5 mg kg−1) as indicated by the arrows. Mice with RES-10 (10 mg kg−1) and saline treatment were used as controls. | ||
The main causes of breast cell apoptosis may be associated with changes in the tumor suppression gene and apoptosis related to protein expression.35,36 We measured the expression of p53, Bax, Bcl-2 and caspase-3 proteins to characterize the signaling pathways involved in apoptosis induced by PSL@RES (Fig. 8a–d). The results of Western Blot experiments demonstrated that PSL@RES significantly enhanced the expression of p53 in a concentration-dependent manner. For the treatment groups of PSL@RES-2.5, PSL@RES-5, and PSL@RES-10, the expression of p53 was significantly higher than the control group. The PSL@RES-10 group increased their p53 expression by 3.13 fold compared to the control, the RES-10 group increased about 2.01 fold over the same control (Fig. 8a and b). P53 is recognized as an important suppression gene that subsequently promotes apoptosis by its ability to control the transcription of pro-apoptotic members of the Bcl-2 family, such as Bcl-2 and Bax. In this work, the expression of Bax increased significantly after the treatment with PSL@RES-10. In contrast, the expression of the Bcl-2 protein decreased prominently under the same conditions (Fig. 8a and c). The Bcl-2/Bax ratio was found to diminish 45% in the PSL@RES-10 group over the RES-10 group (Fig. S4, ESI†). This ratio reflects favorable apoptosis capability of the liposome complex. Finally, we investigated the Caspase-3 activity in breast tumors and obtained the results shown in Fig. 8a and d. The treatment group with PSL@RES-10 showed significantly higher Caspase-3 activity compared to the saline control and the RES treatment groups. These results confirmed that RES liposomes induced apoptosis in breast tumors, accompanied by the activation of Caspase-3. Based on our data, we demonstrated that PSL@RES increases the expression of p53 in breast tumors, downregulated Bcl-2, and upregulated Bax, thus inducing Caspase-3 activation.37–39
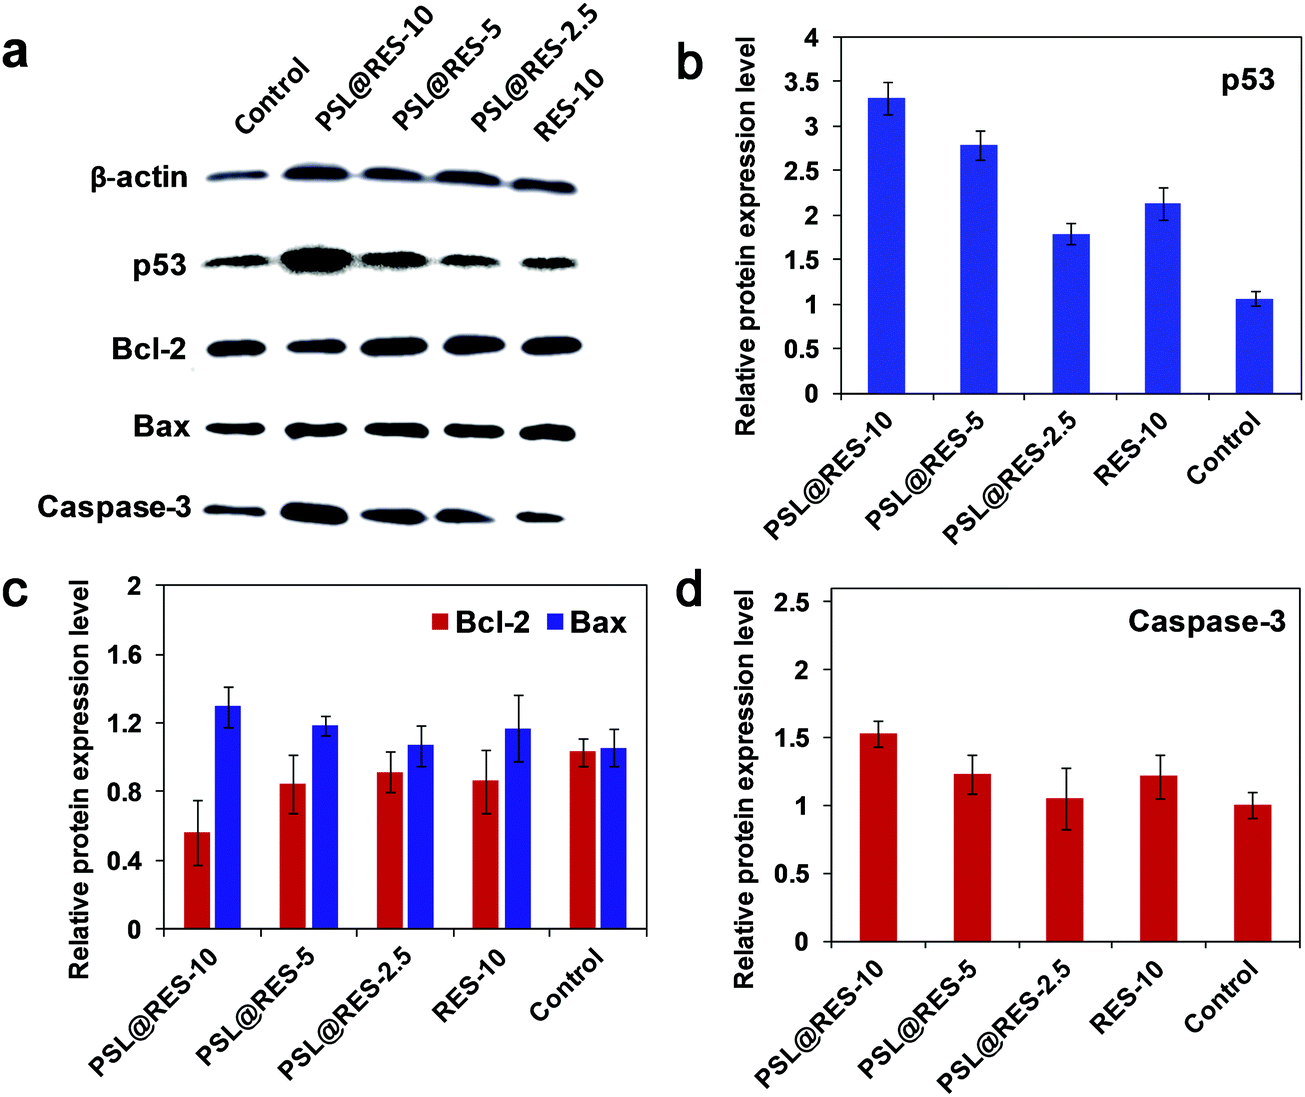 | ||
| Fig. 8 Protein expression of Bcl-2, Bax, p53 and Caspase-3 in MCF-7 tumor cells by Western blot. Anti-β-actin was used as a loading control to normalize the data. Tumor-bearing mice were treated with PSL@RES and RES for 13 days, and saline was used as control. (a) Representative autoradiographs of Bax, Bcl-2, p53 and Caspase-3 expression. Relative protein expression level of p53 (b), Bcl-2 (c), Bax (c) and Caspase-3 (d) were quantified by densitometry traces. Results are expressed as mean ± SD from three-independent experiments. | ||
Since toxicity of drug carriers is a major obstacle for their application in clinical trials, we evaluated general organ toxicity of the PSL@RES and RES in the in vivo mice model. Compared with the control group, no apparent signs of dehydration, locomotor impairment, anorexia, or other symptoms associated with animal toxicity were observed during the treatment, and no behavioral abnormalities occurred. Furthermore, the body weight of the mice after the treatment under three dosages of PSL@RES did not present evidence of obvious loss during the entire experiment in vivo. For the RES group, however, body weight dropped noticeably at day 13 after the treatment (Fig. 9a). The body weight measurements confirmed that the toxicity of RES was reduced after the encapsulation in the PSL liposome. Major organs including the heart, liver, spleen, lung and kidney were stained with hematoxylin and eosin (H&E) for histological analysis (Fig. 9b). The histological slides of these organs showed no significant damage or inflammatory lesions after the treatment with any of the three dosages of PSL@RES. However, RES-10 treatment produced observable heart damage, as myocardial fibers were disordered, with instances of cellular breaks and noteworthy infiltration of inflammatory cells. Moreover, liver tissue was seriously damaged after the treatment with RES-10. Hepatic peri-portal inflammatory cell infiltration and liver cell diffuse vacuolar degeneration were observed. The results confirmed that RES remained encapsulated in PSL liposomes under non-acidic conditions, leading to the protection of the normal organs.
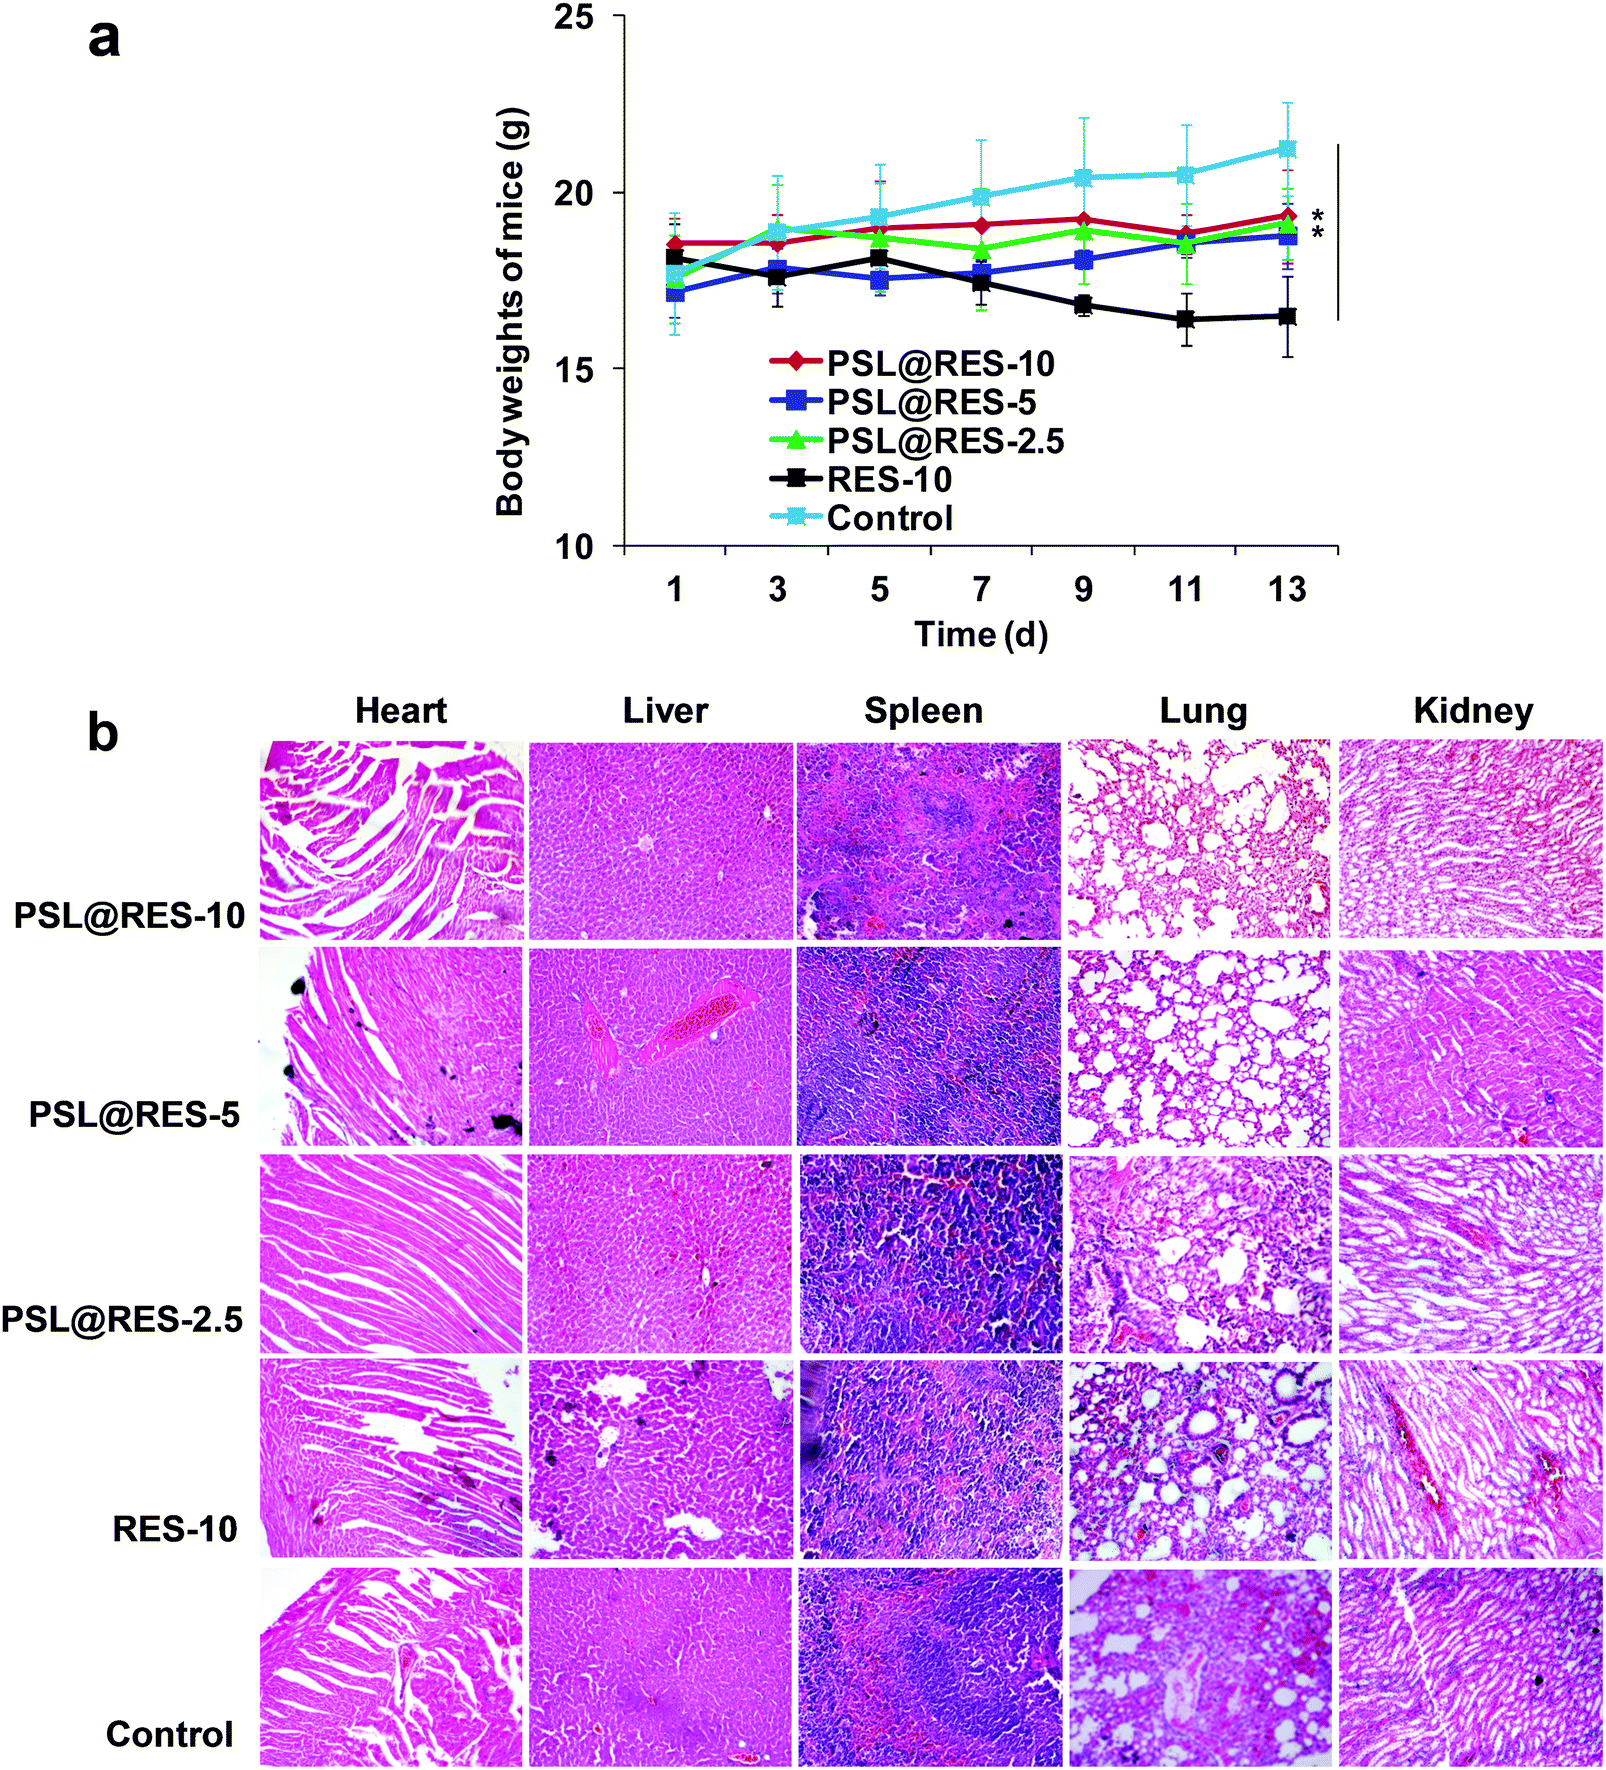 | ||
| Fig. 9 (a) Body weights of mice were determined every two days, significance level: **p < 0.01. (b) Histological analysis of organs extracted from tumor-bearing mice (200×). | ||
In order to further investigate in vivo toxicity of PSL@RES, renal indicators and liver enzymes were also measured. As shown in Fig. 10, we found that PSL@RES did not produce significant changes in renal indicators and liver enzymes, including blood urea nitrogen (BUN), creatinine, aspartate aminotransferase (AST) and alanine aminotransferase (ALT). Although the BUN values were slightly low in the PSL@RES-10 and PSL@RES-5 treatment groups as compared with the saline group, all values were within the normal range. For the RES-10 group, however, the ALT value was greatly elevated compared with the saline group. This further confirmed that free RES can lead to serious inflammation of the liver. These data were consistent with our organ histological analysis (Fig. 8b), further confirming that encapsulation of RES within peptide liposomes reduces the systematic toxicity of RES to mice.
 | ||
| Fig. 10 Toxicity assessments of PSL@RES to kidney and liver functions. The normal range of ALT, AST, BUN and CREA were 62–120 IU L−1, 134–199 IU L−1, 4.78–9.52 μmol L−1 and 44.20–91.05 μmol L−1, respectively. Values are expressed as mean ± SD of 3 animals in each group. | ||
Conclusions
In summary, we successfully developed PSL@RES liposomes with impressive biocompatibility and therapeutic benefits for RES delivery. PSL@RES complexes exhibited improved aqueous solubility and stability of RES. In addition, the PSL@RES liposome was inferred to enter tumor cells and tissues by enhanced permeability and retention. This was followed by controlled RES release at the target sites over a prolonged period of time, leading to the induction of apoptosis of tumor cells. Importantly, PSL@RES inhibited the growth of tumors at a significantly reduced dosage of RES with no evident toxicity to normal tissues in a mouse model. These unique properties indicate that the PSL@RES liposome delivery nanocarriers may become a promising new tool for future clinical applications of RES.Materials
RES was purchased from Meilun Biotechnology (Dalian, China). Sucrose laurate L195 (1% monoester, HLB: 1) and sucrose laurate L1695 (80% monoester, hydrophilic/lipophilic balance, HLB: 16) were purchased from the Shineroad Company (Shanghai, China). Tri-peptide lipid CDO was synthesized by our laboratory. RPMI1640 and fetal bovine serum (FBS) were purchased from Gibco (Grand Island, USA). MCF-7 and MCR-5 cells were obtained from the Institute of Biochemistry and Cell Biology (Nanjing, China). 3-(4,5-Dimethylthiazol-2-yl)-2,5-diphenyltetrazolium bromide (MTT) was purchased from Sangon Biotech Co., Ltd (Shanghai, China). Apo-ONE homogeneous caspase-3, caspase-8 and caspase-9 assay kits were purchased from Beyotime Biotechnology (Shanghai, China). The ANNEXIN V-FITC-PI apoptosis kit was purchased from Beyotime Biotechnology (Shanghai, China). All other chemicals were of reagent grade. All materials were used as received. All water used was purified using a Milli-Q Plus 185 water purification system (Millipore, Massachusetts, USA), giving a resistivity greater than 18 MΩ cm.Experimental
Preparation of RES liposomes
Liposomes were prepared using the thin film hydration method.40 To prepare RES liposome (PSL@RES), chloroform solutions of CDO and sucrose laurate L126 (HLB = 6) were added to a round-bottomed flask (1:1 at weight ratio), along with a solution of trans-RES in methanol at different lipid–drug weight ratios (1:1, 5:1 and 10:1). The methanol was then evaporated to form a thin film, followed by high-vacuum desiccation. The dry lipid film was resuspended in 1 mL distilled water to obtain liposomes in a concentration of approximately 1 mg mL−1. The liposomes were extruded through a 200 nm aperture in a liposome extruder (FL-1 Avestin, Canada). The extruded liposomes were filtered through 0.22 μm filters to remove the unincorporated drug and to sterilize them for subsequent studies. Plain liposomes (PSL) were made without adding RES. For in vivo studies, the lipid concentration was scaled up to 2–3 mg mL−1 and the hydration time was increased to improve the incorporation efficiency of RES.
Particle size, zeta potential and morphology
For the measurement of particle size and zeta potential, 20 μL of the liposomes were diluted in distilled water (1 mL). The particle size and zeta potential were measured by dynamic light scattering (DLS) using a Nano-Particle Size Analyzer (HORIBA SZ-100, Japan). The measurements for each sample were done in triplicate. The morphology of liposome PSL and RES liposome PSL@RES was determined using a JEOL 2100F transmission electron microscope (TEM) as previously described.41Encapsulation efficiency of PSL@RES
The amount of RES loaded in liposomes was determined using a UV spectrophotometer (UV-2700, Shimadzu Corporation, Kyoto, Japan). The wavelength for peak detection of RES was measured by performing a spectral scan of RES dilutions in methanol in a range between 200–400 nm, and a standard curve was plotted. The PSL@RES and free RES were separated by dialysis; the total RES concentration (Ctotal) and free RES concentration (Cfree) were quantified according to the standard curve. The encapsulation efficiency (EE) of PSL@RES was calculated using the following formula:
In vitro release of RES
The in vitro release kinetics of RES was measured in a solution (pH 6.8) composed of water and methanol (90:10, v/v) using a dialysis membrane following the method of Chinese Pharmacopoeia (2015) with minor modifications.42,43 Samples equivalent to 1.0 mg of RES were dispersed in 2 mL of aqueous solution and then placed in the dialysis bag with Molecular Weight Cut Off 500. The dialysis bag was dipped with the help of a thread in a conical flask containing 40 mL of solution (37 °C) on a shaking bed. The dialysate aliquots were withdrawn at 0.5, 1, 2, 4, 6, 8, 10, 12, 20, 24, 28, 32, 36, 44, 48, 64, 72 and 84 h and the same amount of fresh solution was added to the medium. The RES released into the medium was determined using a UV spectrophotometer at 308 nm.
Cytotoxicity of RES liposome on cancer cells
To study the inhibition of liposome complexes of PSL@RES on tumor cells, MCF-7 cells or MCR-5 cells were seeded at 5 × 10⁴ cells per well in 96-well plates for 24 h at 37 °C and 5% CO2. The medium was replaced with media containing either free RES, PSL@RES, or PSL at a RES concentration ranging from 2 μm to 64 μm. After 48 h, the drug-containing media was discarded from the wells, and cells were washed twice with complete medium, then MTT (20 μL, 5 mg mL−1, pH 7.4) was added. Cells with reagent were incubated for 4.5 h, following which 150 μL of dimethyl sulfoxide (DMSO) was added into each well to dissolve the substrate. The absorbance at 570 nm was monitored by using the enzyme mark instrument (Sunrise Tecan, Australia). Cells without lipoplexes served as controls. Cell viability was expressed as a percentage of the control. Cell viability was calculated as [[Abs]sample/[Abs]control × 100%]. All experiments were repeated three times, and data are presented as the mean ± standard deviation (SD). Half maximal inhibitory concentration was calculated by the Logit method.Apoptosis induction in vitro
To study the apoptosis induction capability of the RES liposomes, MCF-7 cells (105 cells per well) were seeded in 24-well plates and incubated at 37 °C under 5% CO2 for 18–24 h to produce a confluence fraction of about 80%. They were then treated with PSL@RES, PSL and free RES (RES concentration of 2–64 μM) for 48 h to induce apoptosis. After 48 h, the cells were washed twice with 1× PBS, and detached using 0.25% trypsin-EDTA. The cells were collected in tubes and centrifuged at 1500 rpm for 5 min to obtain the cell pellets. The supernatant was discarded, and cell pellets were rinsed twice with ice-cold PBS. The cell pellets were resuspended in 195 μL 1× Annexin V-FITC binding buffer. Alexa Fluor®488 (5 μL) and propidium iodide (PI) solutions (100 μg mL−1, 1 μL) were added to each 100 μL cell suspension. The cells were incubated in the dark at room temperature for 10–20 min, after which 400 μL binding buffer was added to the tubes. The stained cells were analyzed by flow cytometry (Becton Dickinson, Franklin, NJ, USA) at an excitation wavelength of 488 nm. The emission of Alexa Fluor®488 was recorded in the FL-1 channel while that of PI was recorded in the FL-3 channel. Cells were gated upon acquisition using forward vs. side scatter to eliminate the dead cells and debris, and 10000 gated events were collected for each sample. Analysis was performed making use of the CellQuest™ Pro software (Becton Dickinson, Franklin, NJ, USA).
Measurement of the generation of intracellular ROS
MCF-7 cells were seeded at 105 cells per well in 24-well plates and allowed to adhere for 18–24 h. All the treatments were carried out in DMEM. Following 24 h, the cells were washed once with PBS and detached using 0.25% trypsin–EDTA. The cells were centrifuged at 1500 rpm for 5 min and treated with a solution of the ROS-indicator dye DCFH-DA (500 μL) for 20 min. Cells were analyzed immediately for ROS levels by flow cytometry using a Becton Dickinson FACSCalibur™.Caspase activity assay in vitro
The Apo-ONE homogeneous caspase-3, caspase-8 and caspase-9 assay kits were used to study the activation of caspases. MCF-7 cells were seeded at a density of 105 cells per well in 24-well plates and allowed to adhere for 18–24 h. They were treated for 24 h with PSL@RES, PSL and free RES at a RES concentration of 2–64 μM. After 24 h, the cells were washed once with serum free media. The caspase substrate was diluted in the caspase buffer according to the Caspase Activity Assay Kit, and 50 μL was added to the cells containing 50 μL of media. The plates were incubated at room temperature in the dark with gentle shaking for 2 h. The fluorescence of each well was read at a wavelength of 405 nm using a Bio-Tek Synergy HT multi-detection micro-plate reader (BioTek, Winooski, VT, USA).In vivo antitumor activity
All animal experiments were performed in compliance with the Animal Management Rules of the Ministry of Health of the People's Republic of China (Document No. 55, 2001) as well as under institutional guidelines. All experiments were in accordance with and approved by the Institutional Animal Care and Use Committee of Dalian Medical University. Male BALB/c nude mice of 4–6 weeks of age (body weight: 18–20 g) were purchased from Nanjing Biomedical Research Institute of Nanjing University.The tumor-bearing mice model was established by subcutaneous inoculation of MCF-7 cancer cells into the right flank of BALB/c mice. When the tumor volumes were approximately 100 mm3, the mice were randomly divided into five groups. Three groups were treated with PSL@RES in three dosages (10 mg kg−1, 5 mg kg−1 and 2.5 mg kg−1), the other groups were treated with free RES (10 mg kg−1) in DMSO aqueous solution; normal saline solution was used in the negative control group. All groups were injected intravenously six times in 2 day intervals, and the body weights of mice and the tumor volumes were measured at the same intervals. The tumor volume was calculated using the formula for a prolate ellipsoid as follows: tumor volume = ((width)2 × length)/2. All the data of tumor volumes and body weight were expressed as relative values, with respect to original volume and weight. After treatment, all the animals were euthanized and sacrificed, and major organs and tumor were collected and washed with PBS, and then fixed in 4% formaldehyde. Subsequently, all the organs and tumors were inspected by histopathological techniques. Hematoxylin and eosin (H&E) staining and the terminal deoxynucleotidyltransferase-mediated dUTP nick end labeling (TUNEL) assay were applied to evaluate for acute toxicity and apoptosis of cancer cells.44 The blood serum was obtained from the mice before sacrifice by means of retro-orbital bleed and centrifugation. Hepatic and renal damage was assessed by measuring the level of Aspartate transaminase (AST), Alanine transaminase (ALT), Creatinine (CREA), and Blood urea nitrogen (BUN) in the serum samples.
Apoptosis factors activity assay by Western blot
After the mice were euthanized, the tumors were removed and collected by centrifugation to extract protein using modified RIPA buffer and 1 tablet/10 mL of protease inhibiter cocktail tablets (Roche, Basel, Switzerland). The lysate was centrifuged at 12000 rpm for 15 min at 4 °C and the protein extract was collected in the supernatant. Protein concentration was determined using the Pierce BCA protein assay kit from Thermo Scientific (MA, USA). For Western blotting, 25 μg of total cellular proteins were separated on a 10% SDS-PAGE gel and transferred to polyvinylidene difluoride (PVDF) membranes (Hybond-P, Amersham, USA). Non-specific binding sites were blocked by incubating the membranes in PBS-0.1% Tween-20 with 5% skimmed milk (PBS-T) for 2 h at room temperature. The membranes were incubated with primary antibodies overnight at 4 °C, and then washed three times with PBS-T. The membranes were then incubated with an appropriate secondary antibody for 2 h at room temperature and washed three times with PBS-T. We used the primary antibodies: anti-β-actin (1:2000), anti-Bax (1:2000), anti-Bcl-2 (1:2000), anti-Caspase 3 (1:500) and anti-p53 (1:1000). The blots were developed according to the manufacturer's chemiluminescence protocol (Roche, Basel, Switzerland), and analyzed using Scion Image Software.
Statistical analysis
All data are expressed as mean ± standard deviation (SD) for three independent tests. Differences between groups were analyzed using a one-way analysis of variance (ANOVA) followed by LSD's multiple comparison post hoc test. The results were considered statistically significant when p < 0.05, *; p < 0.01, **; p < 0.001, ***.Conflicts of interest
There are no conflicts to declare.Acknowledgements
This work was financially supported by the National Natural Science Foundation of China (Grant No. 21606041, 21776044, 21503035), Fundamental Research Funds for the Central Universities.References
- A. Pouyafar, A. Rezabakhsh, R. Rahbarghazi, M. Z. Heydarabad, E. Shokrollahi, E. Sokullu, M. Khaksar, A. Nourazarian and C. B. Avci, Cell Tissue Res., 2019, 3, 377 CrossRef.
- G. Bhattarai, S. B. Poudel, S. H. Kook and J. C. Lee, Acta Biomater., 2016, 29, 398 CrossRef CAS PubMed.
- L. Chen, S. Yang, E. E. Zumbrun, H. Guan, P. S. Nagarkatti and M. Nagarkatti, Mol. Nutr. Food Res., 2015, 59, 853 CrossRef CAS.
- M. Jang, I. Cai, G. O. Udeani, K. V. Slowing, C. F. Thomas, C. W. Beecher, H. H. Fong, N. R. Farnsworth, A. D. Kinghorn, R. G. Mehta, R. C. Moon and J. M. Pezzuto, Science, 1997, 275, 218 CrossRef CAS.
- C. Buhrmann, P. Shayan, P. Kraehe, B. Popper, A. Goel and M. Shakibaei, Biochem. Pharmacol., 2015, 98, 51 CrossRef CAS.
- J. Luis Espinoza, Y. Kurokawa and A. Takami, Blood Rev., 2019, 33, 43 CrossRef.
- C. H. Cottart, V. Nivet-Antoine and J. L. Beaudeux, Mol. Nutr. Food Res., 2014, 58, 7 CrossRef CAS.
- A. A. Gokbulut, E. Apohan and Y. Baran, Hematology, 2013, 3, 144 CrossRef.
- S. Bae, E. M. Lee, H. J. Cha, K. Kim, Y. Yoon and H. Lee, Mol. Cells, 2011, 3, 243 CrossRef.
- K. P. Bhat, D. Lantvit, K. Christov, R. G. Mehta, R. C. Moon and J. M. Pezzuto, Cancer Res., 2001, 61, 7456 CAS.
- S. Banerjee, C. Bueso-Ramos and B. B. Aggarwal, Cancer Res., 2002, 62, 4945 CAS.
- M. Provinciali, F. Re, A. Donnini, F. Orlando, B. Bartozzi, G. D. Stasio and A. Smorlesi, Int. J. Cancer, 2005, 115, 36 CrossRef CAS.
- C. Bonechi, S. Martini, L. Ciani, S. Lamponi, H. Rebmann, C. Rossi and S. Ristori, PLoS One, 2012, 8, e41438 CrossRef.
- T. Walle, F. Hsieh, M. H. DeLegge, J. E. Oatis and U. K. Walle, Drug Metab. Dispos., 2004, 32, 1377 CrossRef CAS.
- J. Yang, J. Q. Liu, X. T. Liu and S. J. Fei, Chin. J. Cell. Mol. Immunol., 2015, 7, 889 Search PubMed.
- T. Mbimba, P. Awale, D. Bhatia, W. J. Geldenhuys, A. S. Darvesh, R. T. Carroll and A. Bishayee, Curr. Pharm. Biotechnol., 2012, 1, 229 Search PubMed.
- M. J. Mitchell, J. Webster, A. Chung, P. P. Guimaraes, O. F. Khan and R. Langer, Nat. Commun., 2017, 8, 14179 CrossRef CAS.
- Y. C. Kuo, C. L. Chen and R. Rajesh, Acta Biomater., 2019, 87, 207 CrossRef CAS.
- A. Jhaveri, P. Deshpande, B. Pattni and V. Torchilin, J. Controlled Release, 2018, 277, 89 CrossRef CAS.
- H. Y. Li, Q. Liu, B. J. Crielaard, J. W. de Vries, M. Loznik, Z. J. Meng, X. T. Yang, R. Göstl and A. Herrmann, Adv. Healthcare Mater., 2019, 14, 1900389 CrossRef.
- S. Mitragotrl, T. Lammers, Y. H. Bae, S. Schwendeman, S. De Smedt, J.-C. Leroux, D. Peer, I. C. Kwon, H. Harashima, A. Kikuchi, Y.-K. Oh, V. Torchilin, W. Hennink, J. Hanes and K. Park, J. Controlled Release, 2017, 246, 183 CrossRef.
- A. Popat, S. Karmakar, S. Jambhrunkar, C. Xu and C. Z. Yu, Colloids Surf., B, 2014, 117, 520 CrossRef CAS.
- J. Chen, W. L. Lu, W. Gu, S. S. Lu, Z. P. Chen, B. C. Cai and X. X. Yang, Exp. Opin. Drug Delivery, 2014, 11, 565 CrossRef CAS.
- T. T. Zhang, H. H. Feng, L. Liu, J. Peng, H. T. Xiao, T. Yu, Z. Q. Zhou, Y. Li, Y. S. Zhang and X. H. Bai, Int. J. Mol. Med., 2019, 43, 1635 Search PubMed.
- C. B. He, Y. P. Hu, L. C. Yin, C. Tang and C. H. Yin, Biomaterials, 2010, 13, 3657 CrossRef.
- A. K. Deshantri, A. Moreira, V. Ecker and S. N. Mandhane, J. Controlled Release, 2018, 287, 194 CrossRef CAS.
- M. E. Juan, U. Wenzel, H. Daniel and J. M. Planas, J. Agric. Food Chem., 2008, 56, 4813 CrossRef CAS.
- H. Miki, N. Uehara, A. Kimura, T. Sasaki, T. Yuri, K. Yoshizawa and A. Tsubura, Int. J. Oncol., 2012, 40, 1020 CrossRef CAS.
- M. Sheu, H. Jhan, C. Hsieh, C. Wang and H. Ho, Integr. Cancer Ther., 2015, 14, 184 CrossRef CAS.
- M. Seino, M. Okada, K. Shibuya, S. Suzuki, H. Takeda, T. Ohta, H. Kurachi and C. Kitanaka, Anticancer Res., 2015, 35, 85 CAS.
- H. Luo, A. Yang, B. A. Schulte, M. J. Wargovich and G. Y. Wang, PLoS One, 2013, 8, e60065 CrossRef CAS.
- I. K. Lucas and H. Kolodziei, Planta Med., 2015, 81, 1038 CrossRef CAS.
- Q. S. Zhang, I. Marquez-Loza, I. Eaton., A. W. Duncan, D. C. Goldman and P. Anur, Blood, 2010, 116, 5140 CrossRef CAS.
- M. Yousef, I. A. Vlachogiannis and E. Tsian, Nutrients, 2017, 9, 1231 CrossRef.
- T. Miyashita and J. C. Reed, Cell, 1995, 80, 293 CrossRef CAS.
- A. O. Giacomelli, X. P. Yang, R. E. Lintner, J. M. McFarland, M. Duby and J. Kim, Nat. Genet., 2018, 10, 1381 CrossRef PubMed.
- Z. T. Deng, Z. H. Wang, J. W. Jin, Y. Wang, N. R. Bao, Q. Gao and J. N. Zhao, Acta Biomater., 2017, 49, 541 CrossRef CAS PubMed.
- S. He and X. Yan, Curr. Med. Chem., 2013, 20, 1005 CAS.
- Q. B. She, A. M. Bode, W. Y. Ma, N. Y. Chen and Z. Dong, Cancer Res., 2001, 61, 1604 CAS.
- Y. N. Zhao, A. Liu, Y. Y. Du, Y. N. Cao, E. X. Zhang, Q. Zhou, H. Hai, Y. H. Zhen and S. B. Zhang, Acta Biomater., 2018, 72, 278 CrossRef CAS.
- Y. N. Zhao, Y. Z. Piao, C. M. Zhang, Y. M. Jiang, A. Liu, S. H. Cui, D. F. Zhi, Y. H. Zhen and S. B. Zhang, J. Mater. Chem. B, 2017, 39, 7963 RSC.
- X. Gao, X. Zhang, Y. Wang, L. Sun and C. Li, J. Pharm. Pharmacol., 2011, 63, 757 CrossRef CAS PubMed.
- P. Q. Liang, M. H. Wang, S. X. Zhang, J. Y. Wang, C. L. Dai and C. Y. Quan, Adv. Healthcare Mater., 2019, 15, 1900306 CrossRef.
- H. M. Liu, Y. F. Cai, Y. F. Zhang, Y. D. Xie, H. Qiu, L. Hua, X. J. Liu, Y. L. Li, J. Lu, L. Z. Zhang and R. T. Yu, Adv. Healthcare Mater., 2017, 6, 1601377 CrossRef.
Footnote |
| † Electronic supplementary information (ESI) available: The encapsulation efficiency (EE) of PSL@RES; the particle size and zeta potential of PSL@RES and PSL; the Bcl-2/Bax ratio. See DOI: 10.1039/c9tb02051a |
| This journal is © The Royal Society of Chemistry 2020 |