CAPRYDAA, an anthracene dye analog to LAURDAN: a comparative study using cuvette and microscopy†
Vicente
Castro-Castillo
 a,
Javier
Gajardo
a,
Catalina
Sandoval-Altamirano
a,
Enrico
Gratton
a,
Javier
Gajardo
a,
Catalina
Sandoval-Altamirano
a,
Enrico
Gratton
 b,
Susana
Sanchez
 c,
Leonel
Malacrida
 *bd and
German
Gunther
 *a
*a
aUniversidad de Chile, Facultad de Ciencias Químicas y Farmacéuticas, Departamento de Química Orgánica y Fisicoquímica, Casilla 233, Santiago 1, Chile. E-mail: ggunther@ciq.uchile.cl
bLaboratory for Fluorescence Dynamics, Biomedical Engineering Department, University of California at Irvine, Irvine, CA, USA
cUniversidad de Concepción, Facultad de Química, Departamento de Polímeros, Concepción, Chile
dDepartamento de Fisiopatología, Unidad de Microscopia Avanzada y Bifotónica, Hospital de Clínicas, Facultad de Medicina, Universidad de la República, Montevideo, Uruguay. E-mail: lmalacrida@hc.edu.uy
First published on 11th November 2019
Abstract
We synthesized an anthracene derivative with solvatochromic properties to be used as a molecular probe for membrane dynamics and supramolecular organization. A nine carbon atom acyl chain and a dimethylamino substitution were introduced at positions 2 and 6 of the anthracene ring, respectively. This derivative, 2-nonanoyl-6-(dimethylamino)anthracene (termed CAPRYDAA), is a molecular probe designed to mimic the well-known membrane probe LAURDAN's location and response in the lipid membranes. Due to the larger distance between the electron donor and acceptor groups, its absorption and emission bands are red-shifted according to the polarity of the media. The photophysical behavior of CAPRYDAA was measured in homogeneous media, synthetic bilayer and cells, both in a cuvette and in a fluorescence microscope, using one and two-photon excitation. Our results show a comparable physicochemical behavior of CAPRYDAA with LAURDAN, but with the advantage of using visible light (488 nm) as an excitation source. CAPRYDAA was also excitable by two-photon laser sources, making it easy to combine CAPRYDAA with either blue or red emission probes. In GUVs or cells, CAPRYDAA can discriminate the lipid phases and liquid–liquid phase heterogeneity. This new membrane probe shows the bathochromic properties of the PRODAN-based probes designed by Weber, overcoming the need for UV or two-photon excitation and facilitating the studies on the membrane properties using regular confocal microscopes.
1. Introduction
Fluorescent probes are essential tools in a wide range of biological research. In particular, environment-sensitive hydrophobic fluorescent probes are widely used in the study of molecular organization in the membranes.1–3 According to Weber's definition, an environmental probe must contain, in its molecular structure, at least two different substituent groups or organic functionalities, both attached to an aromatic ring, with one of them having an electron acceptor character and the other with an electron donor character.4 Generally, the magnitude of the spectral changes shown by the probe is directly related to the spatial separation between both substituent groups as well as to the basic molecular entity. The structure of the series of polarity sensitive fluorescent probes, designed and synthesized by Weber et al.4 in the late seventies, which undergo intramolecular photoinduced charge transfer, contains a naphthalene aromatic moiety substituted with a dimethylamino group in position 2 (donor group) and an alkyl carbonyl group in position 6 (acceptor group). PRODAN and LAURDAN, among others, belong to this family of probes. LAURDAN has been widely used, both in cuvettes and in microscopes, for the study of the synthetic membranes and live cells.5–17 These studies include the characterization of lipid phases in the membranes, determination of partition coefficients,18 observation of shape changes during the phase transition,19 observation of lipid–protein interactions,20 and discrimination of cholesterol dynamics in living cells.21 The complex photophysics and solvatochromism properties of this family of compounds involve the contribution of solvent dielectric relaxation and intramolecular excited-state reactions. The separation of these two contributions allows a detailed characterization of the processes.22 In fact, the analysis of the spectral data using phasor analysis allows this distinction, making phasor analysis a very useful tool to describe the complex systems.16,17,23 At this point, it is important to acknowledge that several researchers have developed other analogs of the LAURDAN/PRODAN family for imaging lipid organization in cell membranes and model membrane systems. Among them, the fluorine-based push–pull probes24,25 and push–pull pyrene derivatives26 show a large shift in the emission as a function of the lipid order.27The LAURDAN's emission is mainly in the wavelength range between 400 and 530 nm, with maximum excitation at 370 nm. The possibility to shift absorption/emission to longer wavelengths is a major goal since such a red-shift will have advantages for biological imaging, including facilitating light penetration into tissues, reducing auto-fluorescence, and opening a different wavelength window for combination with other biological fluorescent markers. An option to achieve this purpose is to increase the number of aromatic rings in order to enlarge the distance between substituents involved in the intramolecular charge transfer. This methodology has been used to fabricate the anthracene derivative dyes. The excitation wavelengths of these derivatives are red-shifted (near-infrared in two-photon excitation),28 and they show high quantum yields. As an example of this strategy, we can mention the PRODAN (2-propionyl-6-dimethylaminonaphthalene) homologs and Anthradan (6-propionyl-2-(dihexylamino)anthracene), whose excitation and emission wavelengths shift around 100 nm and 80 nm, respectively. Further, the bathochromic displacement of the absorption bands was accomplished when a symmetric diaryl substitution on the positions 9 and 10 of the anthracene moiety was performed. These substituted probes (analogs of Acedan (2-acetyl-6-(dimethylamino)naphthalene)) have been used for two-photon microscopy imaging.29
In this report, we synthesized an anthracene derivative, with an acyl chain of nine carbon atoms and a dimethylamino substitution at positions 2 and 6 of the anthracene ring, respectively. The logic behind this synthetic design was to obtain a molecule with a similar membrane location and response to the environment as that of the LAURDAN probe, but with a bathochromic shift in the absorbance and emission bands.
We report here the synthesis, spectroscopic characterization, and applications of 2-nonanoyl-6-(dimethylamino)anthracene, CAPRYDAA. The photophysical behavior was measured in several media (homogeneous, synthetic bilayers, and cells), with the measurements being carried out both in cuvettes and under the microscope, using one- and two-photon excitation to establish its applicability under different experimental techniques and conditions as well as to compare with the LAURDAN probe. Our results show a comparable behavior of CAPRYDAA with LAURDAN, but with the advantage of using visible light (488 nm) for excitation. Moreover, CAPRYDAA was fully excitable with two-photon laser sources, due to which CAPRYDAA can easily combine with either blue or red emission probes. Further, by using CAPRYDAA, it was possible to discriminate lipid phases in GUVs as well as liquid phase heterogeneity in living cells. Therefore, here, we present a novel probe that extends the possibilities for studying the membrane dynamics using the fluorescent probes for in vitro as well as in vivo experiments and combining the opportunity to work in cuvettes and with imaging. The major advantage of CAPRYDAA is the possibility of working with single-photon excitation, thereby avoiding the need for 2-photon or UV illumination.
2. Experimental
2.1. Materials
All the reagents and solvents were purchased from Sigma-Aldrich (St. Louis, MO, USA) or Merck (Darmstadt, Germany) and used without further purification. Dioleoylphosphatidylcholine (DOPC), dipalmitoylphosphatidylcholine (DPPC), and cholesterol (Chol) were obtained from Avanti Polar Lipids (Alabaster, AL, USA) and used as received. Melting points were determined on a Reichert Galen III hot plate with a DUAL JTEK Dig-Sense thermocouple thermometer and were uncorrected. The 1H and 13C NMR spectra were recorded on Bruker Avance spectrometers at 200 or 400 MHz and 50 or 100 MHz, respectively, using CDCl3 or DMSO-d6 as solvents unless indicated otherwise. The chemical shifts were reported in terms of δ (ppm), downfield from TMS. The coupling constants (J) were given in Hz. The analytical TLC was performed on Merck silica gel 60 F254 foil-backed plates. The solvents used as eluent were specified in each case. The chromatographic purification of all the products was carried out on the silica gel columns, and the solvents used were specified in each case.2.2 Methods
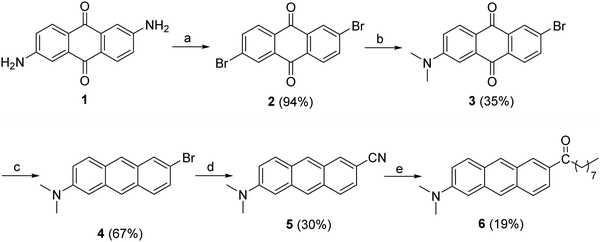
Briefly, the synthesis of 6 was carried out by using a method reported in the literature.28 Compound 2 was synthesized in good yield by the Sandmeyer reaction, using tert-butyl nitrite in dry acetonitrile. The treatment of 2 with CsF in DMSO afforded 2-bromo-6-fluoro-9,10-anthraquinone, which was treated, without purification, with aqueous dimethylamine to afford 2-bromo-6-dimethylamino-9,10-anthraquinone (3). The subsequent sodium borohydride reduction followed by the dehydration of 3 and further subjection to a Rosenmund–von Braun reaction yielded 5. Finally, 6 was prepared by the nucleophilic addition of octylmagnesium bromide to the cyano compound followed by the hydrolysis of the imine intermediate (more details and NMR spectra are given in the ESI†).
Cuvette spectroscopy measurements. The UV-vis spectra were recorded on an Agilent 8453 Diode-Array spectrophotometer (Agilent, USA) in the range of 250–700 nm. The fluorescence emission spectra were obtained by using an ISS PC1 spectrofluorometer (ISS, Champaign IL) or a FluoroMax 4CP (Horiba Jobin Yvon, Japan) at room temperature. Further, the fluorescence lifetime measurements were carried out by using the time-correlated single-photon counting (TCSPC) method on a PicoQuant FluoTime 200 fluorescence lifetime spectrometer (PicoQuant, Germany) equipped with a multichannel scaler, PicoQuant's Timeharp 250 (Pico Quant, Germany). LEDs or lasers of appropriate wavelengths were employed as excitation sources. The fluorescence quantum yields were measured in a FluoroMax 4CP (Horiba Jobin Yvon, Japan) spectrofluorometer equipped with the Quanta-Phi integrating sphere.
Partition constant measurements. The water/dodecane partition for CAPRYDAA was measured by HPLC. The solution was allowed to equilibrate for 48 h and before the measurement, the aqueous and organic phases were centrifuged at 3000 rpm for 10 min (Hermle Z200A) to split the phases properly. The partition constant was obtained from the ratios of the areas of the chromatographic peaks obtained in a Waters 600 HPLC system. The HPLC was equipped with a Waters 996 PDA pump, the column used had a 1.15 μm pore, 100 × 4.6 mm Merck Chromolith RP-18 (Merck KGaA, Darmstadt, Germany), and the mobile phase and chromatographic conditions were: isocratic acetonitrile having a flow rate of 1 mL min−1 with subsequent detection at 315 nm.
One- and two-photon lifetime and hyperspectral microscopy. The samples were incubated with either 1 μM of CAPRYDAA or LAURDAN for 30 min at 37 °C. The fluorescence lifetime imaging (FLIM) and the hyperspectral microscopy were acquired using a Zeiss LSM880 laser scanning microscope (Carl Zeiss, Dublin, CA-USA). The instrument was equipped with a 20 MHz pulsed supercontinuum white laser (A2, SC390, Fianium Inc, USA) for 488 nm excitation and a Ti:Sapphire laser (Spectra-Physics, Newport-CA-USA) with 80 fs pulses and 80 MHz repetition rate for two-photon excitation. The calibration of the lifetime measurements was performed using a 100 nM solution of coumarin 6, having a reference lifetime of 2.5 ns (http://www.iss.com). For FLIM data acquisition, an ISS A320 FastFLIM box (ISS, Champaign, USA) was used to collect the lifetime decay data. The images were acquired using a 40× water immersion objective 1.2 N.A. (Carl Zeiss). CAPRYDAA was excited using either a 488 nm or 900 nm excitation sources. LAURDAN was excited using 780 nm excitation source. For the FLIM measurements, two high-efficiency GaAsP Hybrid Detectors (HPM-100-40, Becker & Hickl GmbH) were used, and before the detector, a filter cube composed of two bandpass filters (440/60 nm, channel-1, and 500/60 nm, channel-2) and a 470 nm dichroic mirror from Semrock was employed. We defined channel-1 and channel-2 as blue and green filters, respectively. For the hyperspectral imaging, the lambda mode configuration of the Zeiss LSM8800 was used. A 32-channel configuration was used with a bandwidth of 9.7 nm, and the total range acquired was between 410 nm and 695 nm. The image acquisitions in both the configurations (FLIM and hyperspectral) were performed with a pixel frame size of 256 × 256 and a pixel dwell time of 16.38 μs per pixel. The hyperspectral and FLIM data were processed using the SimFCS software developed at the Laboratory for Fluorescence Dynamics (http://www.lfd.uci.edu).
GUVs preparation. Giant unilamellar vesicles (GUVs) were prepared by following the electroformation protocol described by Pott et al.30 Briefly, dioleoylphosphatidylcholine (DOPC) or dipalmitoylphosphatidylcholine
![[thin space (1/6-em)]](https://www.rsc.org/images/entities/char_2009.gif) :
:![[thin space (1/6-em)]](https://www.rsc.org/images/entities/char_2009.gif) cholesterol (1
cholesterol (1![[thin space (1/6-em)]](https://www.rsc.org/images/entities/char_2009.gif) :
:![[thin space (1/6-em)]](https://www.rsc.org/images/entities/char_2009.gif) 1 molar, DPPC
1 molar, DPPC![[thin space (1/6-em)]](https://www.rsc.org/images/entities/char_2009.gif) :
:![[thin space (1/6-em)]](https://www.rsc.org/images/entities/char_2009.gif) Chol) was prepared at a final concentration of 0.3 mM in chloroform. CAPRYDAA or LAURDAN at 0.5% molar was added to the lipid mixture in chloroform. Then, 4 μL of the organic mixture was applied to each platinum wire and dried under vacuum overnight. The electroformation chamber was filled with 400 μL of 200 mM sucrose at 50 °C. To keep the temperature constant, we used a water circulating bath. For the GUVs growth, we applied a sinusoidal potential of 2 volts and 10 Hz for 1.5 hours. To detach the GUVs from the wire, the frequency of the sinusoidal potential was reduced to 1 Hz for 10 min, and then, the function generator and circulating bath were turned off. For the measurements, 50 μL of the GUVs dispersion were transferred to an 8-well bottom-glass imaging chamber, containing 300 μL of a 200 mM glucose solution. The imaging chamber was previously coated with 1 mg mL−1 of the bovine serum albumin (BSA) solution (to avoid vesicle burst on settling), and before transferring the GUVs, each well was washed 10 times with 200 mM glucose solution.
Chol) was prepared at a final concentration of 0.3 mM in chloroform. CAPRYDAA or LAURDAN at 0.5% molar was added to the lipid mixture in chloroform. Then, 4 μL of the organic mixture was applied to each platinum wire and dried under vacuum overnight. The electroformation chamber was filled with 400 μL of 200 mM sucrose at 50 °C. To keep the temperature constant, we used a water circulating bath. For the GUVs growth, we applied a sinusoidal potential of 2 volts and 10 Hz for 1.5 hours. To detach the GUVs from the wire, the frequency of the sinusoidal potential was reduced to 1 Hz for 10 min, and then, the function generator and circulating bath were turned off. For the measurements, 50 μL of the GUVs dispersion were transferred to an 8-well bottom-glass imaging chamber, containing 300 μL of a 200 mM glucose solution. The imaging chamber was previously coated with 1 mg mL−1 of the bovine serum albumin (BSA) solution (to avoid vesicle burst on settling), and before transferring the GUVs, each well was washed 10 times with 200 mM glucose solution.
![[thin space (1/6-em)]](https://www.rsc.org/images/entities/char_2009.gif) 000 M−1 cm−1 at 364 nm in methanol. During the imaging, on the Zeiss LSM880 microscope, the cells were kept at 37 °C with 5% CO2 using the Zeiss incubator.
000 M−1 cm−1 at 364 nm in methanol. During the imaging, on the Zeiss LSM880 microscope, the cells were kept at 37 °C with 5% CO2 using the Zeiss incubator.
Fluorescence lifetime imaging and phasor analysis (FLIM phasor plot). The FLIM phasor plot was obtained using eqn (1) and (2), as described previously.22,31 Briefly, the fluorescence decay, I(t), was acquired at each pixel of an image, and then, the G and S coordinates were calculated. The G and S coordinate for each pixel was plotted in a polar plot (referred to as phasor plot or phasor space) as follows:
 | (1) |
 | (2) |
Hyperspectral imaging and phasor analysis (spectral phasor plot). The fluorescence spectrum, at each pixel, in a spectral image was transformed into phasor coordinates, (G(λ)) and (S(λ)), as described in eqn (3) and (4), respectively.16 The G(λ) and S(λ) coordinates are the real and imaginary components of the Fourier transformation. I(λ) represents the intensity at every wavelength (channel in our case), n is the number of the harmonic, and λi the initial wavelength. The x and y coordinates were plotted in the spectral phasor plot, as previously shown by Malacrida et al.16
 | (3) |
 | (4) |
The position for every pixel in the spectral phasor plot can be defined by the phase angle and the modulus (M), given the coordinates G and S (for both spectral or lifetime), in the following way:
| θ = arctan(S/G) | (5) |
 | (6) |
3. Results and discussion
Cuvette spectroscopic characterization
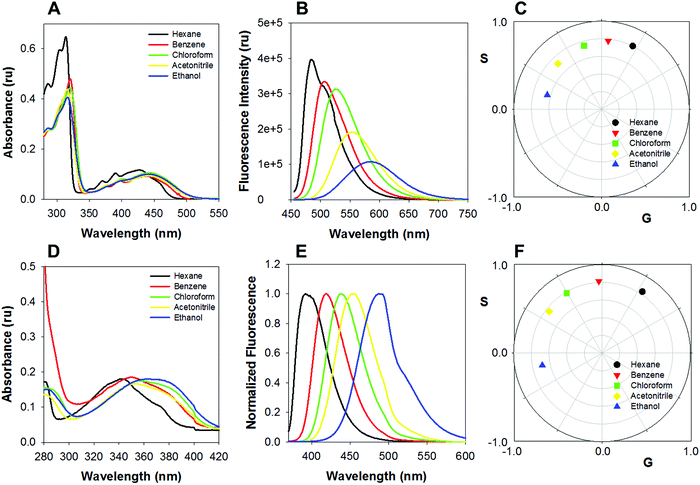
The absorption and emission spectra of CAPRYDAA and LAURDAN in solvents with increasing polarity were compared. The absorption spectrum of CAPRYDAA (Fig. 2A) was found to undergo a shift of around 100 nm towards the red region as compared with the LAURDAN probe (Fig. 2D). In homogeneous media, the absorption spectra and molar absorptivity at maxima absorption wavelengths, for both CAPRYDAA and LAURDAN, showed a fair dependency on the solvent polarity. For the LAURDAN probe, the molar absorptivity, at the absorption maxima at a longer wavelength (around 20![[thin space (1/6-em)]](https://www.rsc.org/images/entities/char_2009.gif) 000 M−1 cm−1), was twice to that of CAPRYDAA's molar absorptivity, which was determined to be around 9000 M−1 cm−1 (Fig. 2A and D).
000 M−1 cm−1), was twice to that of CAPRYDAA's molar absorptivity, which was determined to be around 9000 M−1 cm−1 (Fig. 2A and D).
Further, clear bathochromic shifts were observed for CAPRYDAA (Fig. 2B and C) and LAURDAN (Fig. 2E and F). To compare the spectral shift (Stokes shift) for CAPRYDAA and LAURDAN, the Lippert–Mataga equation was used:33,34
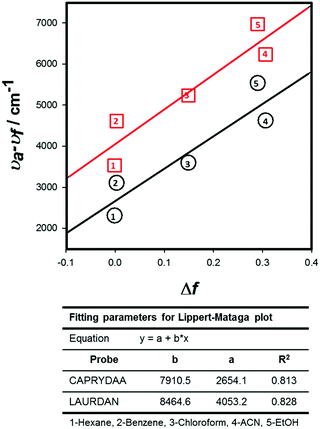 | ||
| Fig. 3 The Lippert–Mataga plot for CAPRYDAA (red squares) and LAURDAN (black circles) as a function of solvent polarity. | ||
Additionally, it must be stated that both absorption and emission properties as well as their dependency on the solvent for CAPRYDAA were found to be similar to that reported for Anthradan by Lu et al.28
Several CAPRYDAA photophysical parameters related to the first singlet excited state in homogeneous media were measured (Table 1). The singlet state emission decay of CAPRYDAA, in homogenous media with different polarities, can be fitted to the monoexponential decays, with lifetime values (τ) between 5 and 12 ns (Table 1). Further, the lifetime values for LAURDAN, i.e., between 2.5 and 5.5 ns, were found to be similar to the values reported in the literature.35 However, the fluorescence quantum yield (ΦF) for CAPRYDAA decreased as the polarity of the solvent medium increased (Table 1).
| Solvent | Φ F | τ/ns | λ abs/nm | λ em/nm | ε/M−1 cm−1 |
|---|---|---|---|---|---|
| Φ F = fluorescence quantum yield. τ = fluorescence lifetime. λabs = absorbance wavelength. λem = emission fluorescence wavelength. ε = extinction coefficient (value and absorbance wavelength). | |||||
| Hexane | 0.44 | 6.46 | 314–428 | 475 | 52![[thin space (1/6-em)]](https://www.rsc.org/images/entities/char_2009.gif) 589 (314) 589 (314) |
| 9437 (428) | |||||
| Benzene | 0.51 | 7.84 | 320–438 | 507 | 50![[thin space (1/6-em)]](https://www.rsc.org/images/entities/char_2009.gif) 566 (320) 566 (320) |
| 9816 (438) | |||||
| CHCl3 | 0.44 | 7.68 | 321–443 | 527 | 42![[thin space (1/6-em)]](https://www.rsc.org/images/entities/char_2009.gif) 469 (321) 469 (321) |
10![[thin space (1/6-em)]](https://www.rsc.org/images/entities/char_2009.gif) 113 (443) 113 (443) |
|||||
| ACN | 0.29 | 7.56 | 316–441 | 554 | 46![[thin space (1/6-em)]](https://www.rsc.org/images/entities/char_2009.gif) 148 (316) 148 (316) |
| 9924 (441) | |||||
| EtOH | 0.10 (MEOH) | 5.29 | 316–443 | 587 | 42![[thin space (1/6-em)]](https://www.rsc.org/images/entities/char_2009.gif) 841 (316) 841 (316) |
10![[thin space (1/6-em)]](https://www.rsc.org/images/entities/char_2009.gif) 552 (443) 552 (443) |
|||||
Additionally, the effect of temperature in the CAPRYDAA emission from DPPC SUVs is shown in the ESI† (Fig. S9).
Microscope intensity measurements
Fluorescence lifetime characterization (FLIM-phasor analysis)
The second comparison was the dye response to the physical order of the lipid bilayer. The CAPRYDAA partition in water was estimated by the partition constant measurements in a water/dodecane mixture. A log p > 4 was experimentally obtained, and hence, it can be considered that there is no partition of CAPRYDAA in the solvent. Further, the fluorescence lifetime measurements in MLVs (multilamellar vesicles) of lipids in different phases were used to evaluate the performance of CAPRYDAA (Fig. 5). Three different sets of MLVs were prepared for this comparison, and the measurements were carried out at 37 °C: MLVs of DPPC (gel phase), DOPC (fluid phase), and DPPC![[thin space (1/6-em)]](https://www.rsc.org/images/entities/char_2009.gif) :
:![[thin space (1/6-em)]](https://www.rsc.org/images/entities/char_2009.gif) cholesterol (1
cholesterol (1![[thin space (1/6-em)]](https://www.rsc.org/images/entities/char_2009.gif) :
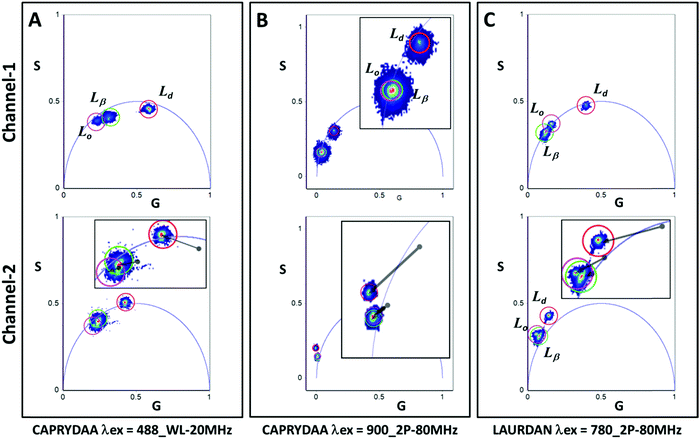
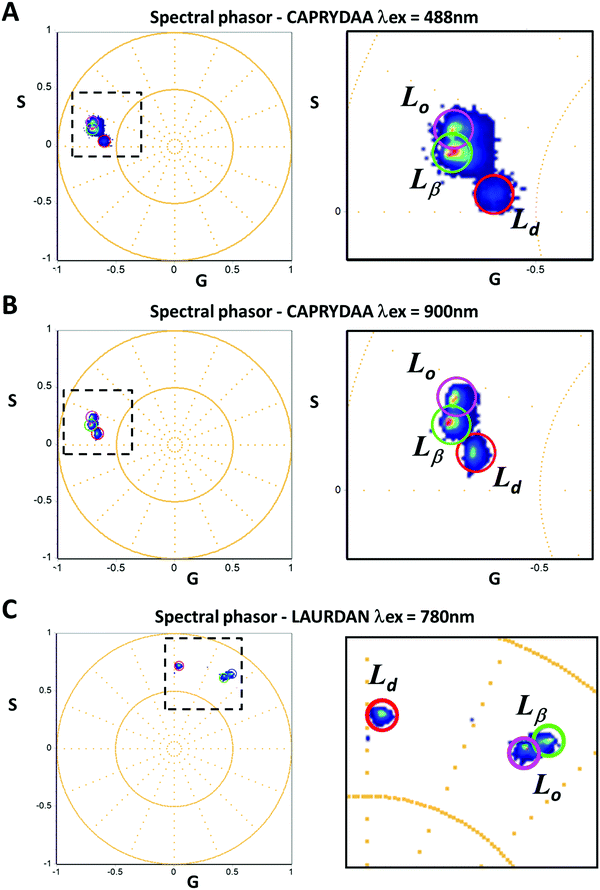
:![[thin space (1/6-em)]](https://www.rsc.org/images/entities/char_2009.gif) 1, molar) were used as a liquid order model. The vesicles were labeled with either CAPRYDAA or LAURDAN, and the lifetime measurements were performed by collecting the emission in two different channels: blue (channel-1) and green (channel-2) wavelength range of the dyes. Using this strategy, it was possible to isolate the polarity (blue region) from the dipolar relaxation effect of the dye in the excited state (green region).22 Additionally, the fluorescence lifetime measurements were carried out in a microscope, using two-photon excitation at 780 nm for LAURDAN, and 900 nm for CAPRYDAA. For CAPRYDAA, one-photon excitation was also used since no significant photobleaching was observed.
1, molar) were used as a liquid order model. The vesicles were labeled with either CAPRYDAA or LAURDAN, and the lifetime measurements were performed by collecting the emission in two different channels: blue (channel-1) and green (channel-2) wavelength range of the dyes. Using this strategy, it was possible to isolate the polarity (blue region) from the dipolar relaxation effect of the dye in the excited state (green region).22 Additionally, the fluorescence lifetime measurements were carried out in a microscope, using two-photon excitation at 780 nm for LAURDAN, and 900 nm for CAPRYDAA. For CAPRYDAA, one-photon excitation was also used since no significant photobleaching was observed.
Channel-1 (Fig. 5) gives information about the polarity of the media surrounding the dye molecule, and therefore the physical state of the membrane. As expected, the Ld phase showed a shorter lifetime (indicated by the red cursor in Fig. 5A–C, corresponding to channel-1). This result was consistent for both the dyes using one and/or 2-photon excitation. However, for Lβ and Lo phases, the FLIM-phasor analysis showed some differences between CAPRYDAA and LAURDAN. The CAPRYDAA probe showed differences in the lifetime values when one or two-photon excitation was used (Fig. 5A and B). When one photon excitation was used, the lifetime values of CAPRYDAA were different, namely being shorter in the Lβ phase than in the Lo phase (Fig. 5A); however, the two-photon excitation cannot differentiate between these two phases (Fig. 5B, channel-1). On the other hand, for LAURDAN the Lβ phase shows the longer lifetime in regards to the other membrane models when two-photon excitation was used (Fig. 5C).
The lifetime data acquired in channel-2 (Fig. 5A–C; the bottom panel) gives information regarding the dipolar relaxation, and in the phasor representation shown in Fig. 5, this phenomenon is illustrated by the position of the phasors outside the universal circle. Generally, a position outside the universal circle is associated with a reaction in the excited state, and in this case, it is due to the dipolar relaxation of the water molecules around the probe. The solvent dipolar relaxation takes time, and this duration is responsible for the increase in the phase angle, and hence, the position outside the phasor plot is observed. For CAPRYDAA, the dipolar relaxation was smaller for one-photon as compared with the two-photon excitation. In Table 2, the lifetime for CAPRYDAA and LAURDAN using phase and demodulation analysis is shown. The difference between the tau phase (τP) and tau modulation (τM) values in channel-1 is indicative of a complex decay. On the other hand, the larger values for the tau phase over the tau modulation in channel-2 were found to be related to the occurrence of a reaction in the excited state. For instance, delays in the phase were present when the dipolar relaxation of the solvent molecules occurred around the probe in the excited state.
| Lipid mixture | Channel-1 | Channel-2 | ||
|---|---|---|---|---|
| τ P | τ M | τ P | τ M | |
| τ P, tau phase. τM, tau modulation. n = 3 for each sample.a Phase larger than 90 degree. | ||||
| CAPRYDAA 900 nm | ||||
| DPPC | 7.07 ± 0.05 | 11.33 ± 0.05 | 34.00 ± 2.405 | 13.67 ± 0.05 |
| DOPC | 4.37 ± 0.12 | 5.50 ± 0.00 | —a | 9.50 ± 0.08 |
DPPC![[thin space (1/6-em)]](https://www.rsc.org/images/entities/char_2009.gif) : :![[thin space (1/6-em)]](https://www.rsc.org/images/entities/char_2009.gif) Chol (1 Chol (1![[thin space (1/6-em)]](https://www.rsc.org/images/entities/char_2009.gif) : :![[thin space (1/6-em)]](https://www.rsc.org/images/entities/char_2009.gif) 1) 1) |
9.60 ± 0.05 | 11.73 ± 0.17 | 29.37 ± 4.84 | 13.33 ± 0.12 |
| LAURDAN 780 nm | ||||
| DPPC | 5.27 ± 0.05 | 5.37 ± 0.05 | 8.10 ± 0.22 | 5.93 ± 0.12 |
| DOPC | 2.37 ± 0.05 | 2.47 ± 0.05 | 5.93 ± 0.05 | 3.87 ± 0.05 |
DPPC![[thin space (1/6-em)]](https://www.rsc.org/images/entities/char_2009.gif) : :![[thin space (1/6-em)]](https://www.rsc.org/images/entities/char_2009.gif) Chol (1 Chol (1![[thin space (1/6-em)]](https://www.rsc.org/images/entities/char_2009.gif) : :![[thin space (1/6-em)]](https://www.rsc.org/images/entities/char_2009.gif) 1) 1) |
5.23 ± 0.05 | 5.43 ± 0.12 | 8.07 ± 0.17 | 5.93 ± 0.12 |
Spectral shift comparison
The spectral shift of the probes in different lipid environments was analyzed using the spectral phasor approach16,36 (Fig. 6). The emission spectrum of CAPRYDAA was found to be similar, whether one-photon or two-photon excitation was used, as shown in the spectral phasor plots (Fig. 6A and B). The spectral phasors for CAPRYDAA in the Ld phase showed the largest phase and smallest modulation, as evidenced by the more red-shifted spectra and higher emission heterogeneity (broader spectrum) (Fig. 6A and B). Further, the blue-shifted spectra were found for CAPRYDAA in the membranes in the Lo phase. Finally, the gel phase (Lβ) had similar modulation as Lo but with an increased phase angle, indicative of a blue-shifted spectrum. For LAURDAN, a larger spectral shift was obtained, but the most blue-shifted spectrum was identified for DPPC (gel phase, see Fig. 6C). The liquid order membrane showed a slightly increased phase angle, but with a significant decrease in modulation (Fig. 6C).Spatial resolution in model systems
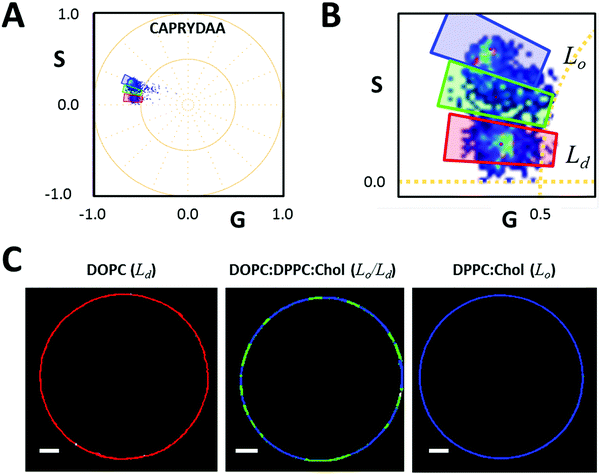
To test the spatial resolution of CAPRYDAA under hyperspectral imaging, i.e., its ability to discriminate between the membrane phases, we prepared giant unilamellar vesicles (GUVs) containing Lo, Ld, or coexistence of the Lo/Ld phases (Fig. 7). Using the cursor selection on the spectral phasor plot (Fig. 7A and B), we were able to segment the liquid order from the liquid disorder membrane either in the single lipid phases or in the coexistence of Lo/Ld phases.Spatial resolution in live cells
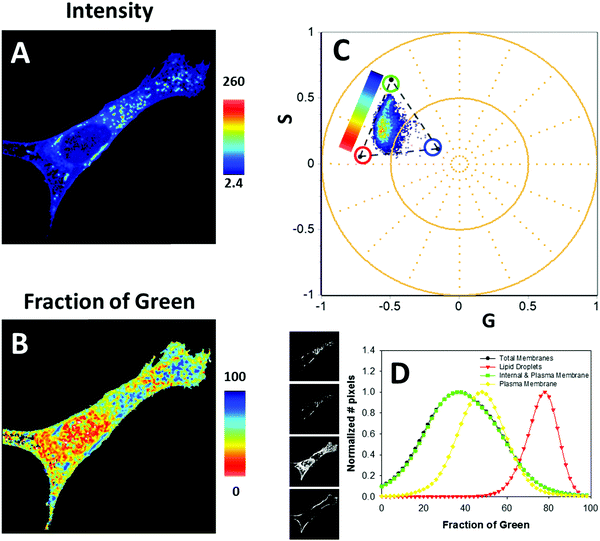
After the GUV experiments, we moved to in vivo cell imaging. We used NIH-3T3 cell, and the CAPRYDAA fluorescence was acquired by using the lifetime and hyperspectral imaging (Fig. 8 and 9, respectively). Using intensity or hand-drawn image segmentation, we explore the dye response in different subcellular environments. The lipid droplets were assigned to the high-intensity pixels due to the accumulation of the dye in the cell interiors and significant increment in the quantum yield (Fig. 8A and B). The spectral shift was color coded using the three-cursor selection as described previously by Ranjit et al.37 (Fig. 8E and H). Then, the interior plus plasma membrane or the plasma membranes, isolated by the hand-drawn masks, were analyzed (Fig. 8C, G, D and H). The histogram of the spectral shift was plotted as a fraction of the green cursor, representing the fraction of the Lo membrane (Fig. 8J). Using this approach, we can quantitatively evaluate the differences within the cellular membranes, since the lipid droplets correspond to the bluer environment. At this point, it is important to mention the biochemical and structural differences between the membrane and the lipid droplets. Further, concerning the solvent polarity, the dye present in the membrane senses the polarity at the phospholipid/water interphase, but in the lipid droplet, the dye will report from the homogenous apolar environment of the core. This capability to sense the two environments has also been demonstrated in other dyes, like push–pull fluorenes25 and pyrenes.27 CAPRYDAA efficiently discriminates between the plasma membrane and the intracellular membranes. In Fig. S10 in the ESI,† we present the “classical” generalized polarization5 (GP = Ch1 − Ch2/Ch1 + Ch2) from the hyperspectral images using the two bands centered at 536 nm (channel-1) and 614 nm (channel-2).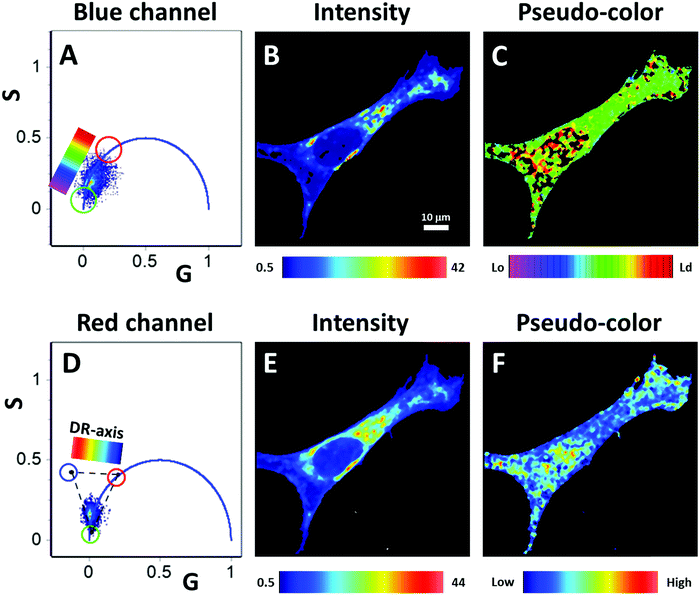 | ||
| Fig. 9 FLIM characterization of CAPRYDAA fluorescence in cells: (A, B and D) the FLIM-phasor analysis of CAPRYDAA using a blue filter. The blue filter is used to characterize the polar part of the CAPRYDAA emission. Using the color scale shown in (A) we generated (C). Red and green cursor represent the “pure” fluid and ordered phases, respectively. In between it is possible to see the cloud of pixels with different fraction of the two components. (D–F) The FLIM-phasor analysis of CAPRYDAA fluorescence using a red filter. The red filter is used to identify the occurrence of dipolar relaxation. The dipolar relaxation is a reaction in the excited-state and for instance should produce a delay in the phase, which pull out the universal circle the pixels that undergoes to dipolar relaxation, see (D). To monitor the change in the dipolar relaxation, we use a three cursor analysis as previously described by Malacrida et al.23 And the dipolar relaxation axis, the DR-axis was colored using the color scale shown in (D). In the dipolar relaxation (F) red means higher dipolar relaxation. It is important to notice that almost all the pixels are outside the universal circle. | ||
Using the two FLIM channels, we can independently study the polarity and the dipolar relaxation of CAPRYDAA (Fig. 9). Additionally, the “classical” FLIM image generated by the tau phase histogram is shown in Fig. S11 of the ESI.† In the blue channel, we can see a trajectory associated with different fractions of Lo and Ld membranes in the cell (Fig. 9A–C). The dipolar relaxation of water around the dye at the membrane interphase was assessed using the green FLIM channel (Fig. 9D–F). An increased dipolar relaxation was found at the intracellular interior, while the plasma membrane presented lower dipolar relaxation when compared with the intracellular membranes (Fig. 9F).
4. Final remarks
Biological membranes are a supramolecular assembly, classically associated with the subcellular compartmentalization; however, membranes are sensitive to the thermodynamic considerations, and thus, their physical order and dynamics can be modified. An important methodology to study the membrane dynamics and organization is the combination of fluorescent dyes with microscopy. In this study, environment-sensitive probes were designed with the final goal of understanding the macromolecular fluctuations and conformation. LAURDAN has been widely described as a probe located at the membrane interphase and due to the charge transfer upon excitation, the increase in the dipole moment was used to test the environment. Weber has originally described the fundamentals between the polarity and the dipolar relaxation. The polarity was modified due to the apparent dielectric constant at the membrane interphase, while the dipolar relaxation was found to be related to the re-orientation of the solvent dipoles around the dye during the excited-state lifetime. LAURDAN is perhaps one of the most widely used membrane dyes in the literature, and up until now, it is the probe with the best-understood photophysics behavior. An important limitation of the use of LAURDAN is the need for two-photon excitation with microscopy in addition to the restriction to the blue spectral emission. Even upon using one-photon excitation of 405 nm, it is important to consider that such red excitation selects a subpopulation of LAURDAN's ground state, and thus the UV illumination may be detrimental to live cells. Therefore, novel probes with more red-shifted excitation spectra and capabilities for either one- or two-photon excitation will prove to be very useful in overcoming some of these drawbacks.CAPRYDAA was designed based on the LAURDAN logic and considering the availability of new spectroscopy and image analysis tools. The rationale for the design of CAPRYDAA was related to the spectral-shifted absorption of anthracene with respect to naphthalene, but keeping the electron donor and acceptor groups as a key point in the photophysics of the dye.
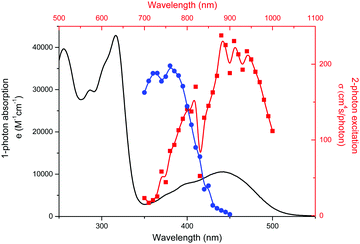
This new probe demonstrated spectral shifts similar to LAURDAN with increasing solvent polarity but was found to undergo red-shift, making it easier to excite by the single-photon methods. This point must be emphasized, considering the limitation on the use of 405 nm for the LAURDAN excitation. Nowadays, some variants of LAURDAN, like C-LAURDAN or M-LAURDAN, claim better photostability than LAURDAN under UV excitation. Nevertheless, the major limitation of this kind of excitation is the deleterious effect on cells and the preferential ground state selection due to the red-edge excitation. CAPRYDAA was also excitable by two-photon excitation at 900 nm, which facilitates the combination with other fluorophores showing blue or red excitation spectra. This characteristic can be very useful when exploiting the linear combination properties of the phasor plots since the dye can be used in combination with the red fluorescent proteins to track particular subcellular structures.
CAPRYDAA was also sensitive to the dipolar relaxation; this property of LAURDAN is unique and is related to the delay in the emission due to the reorganization of the water molecules around the dye in the excited state. Water has a rotational time of the order of the probe lifetime, and for instance, any change in the number of water molecules or their dynamics can be sensed as a dipolar relaxation. The physical state of the membrane is responsible for the final number of water molecules, and thus, the dipolar relaxation can also be related to the membrane dynamics and organization. Interestingly, CAPRYDAA can be studied either by spectral or lifetime shifts, showing a tight correlation between both. The use of the phasor plots (for lifetime or spectra) enhances the bathochromic properties of CAPRYDAA in the synthetic lipid vesicles. In GUVs, it was possible to identify the liquid/liquid phase separation and the characteristic domain formation in a ternary lipid mixture, which is the representative of lipid rafts. Finally, when CAPRYDAA was tested in vivo with live cells, it was possible to isolate the organization of the subcellular membrane by the spectral phasor analysis and image segmentation. This spectral shift is very useful in addressing the membrane dynamics in the in vivo experiments, as well as the dynamic range showed by the phasor plot can be applied to different kinds of experiments. With the FLIM data, a map of the polarity or the dipolar relaxation in the cell can be generated, which is valuable to understand the supramolecular heterogeneity of live cells. These two properties (polarity and dipolar relaxation) provide complementary information, in which the first one was related to the apparent dielectric constant at the membrane interphase and the second one to the relaxation of water molecules around the probe during its excited-state lifetime. It is interesting to discuss the difference in the dipolar relaxation observed by LAURDAN and CAPRYDAA, namely, it seems that LAURDAN has a larger dipolar relaxation shift than CAPRYDAA. However, it is important to consider the difference of the laser sources (one or two-photon), and another important point is the actual position of each dye in the membrane. It is known that LAURDAN is located right behind the carbonyl group at the membrane interphase. On the other hand, it looks as if CAPRYDAA was positioned a little deeper in the bilayer, which can also be explained by the smaller phase-shift observed in the green channel. An important aspect of the probe to highlight is its lack of distribution to the water molecules during the water/dodecane experiment, which besides its low emission from the water, is fundamental for studying the membranes avoiding an emission component from the bulk phase. This characteristic is shared with LAURDAN and is an important advantage of the probe over other soluble LAURDAN versions, which always present a water component.
Finally, CAPRYDAA shows excellent labeling in the in vivo experiments, where a hundred percent of the cells were strongly stained after 30 minutes of incubation, with the staining being homogeneous from cell to cell and inside the cell (data not shown). This point is an important property of CAPRYDAA to highlight, considering there is no preferential affinity for different regions in the cell that improves their uses for full-cell experiments. Besides, considering one of the main applications for CAPRYDAA in the in cellulo and in vivo experiments, easy labeling is one of the fundamental use.
To summarize, we introduced a new molecular probe for membrane dynamics and supramolecular organization with an excellent performance, which was comparable with the “gold standard” in the field, i.e., LAURDAN.
Author contribution
JG and VCC synthetized the probe; GG, LM and SS designed the experiments; CSA, GG, SS and LM performed the experiments; CSA, SS, GG and LM analyzed the data; SS, GG and LM wrote the manuscript; EG, SS, GG and LM revised and discussed the manuscript.Conflicts of interest
The authors declare no competing interests.Acknowledgements
We would like to dedicate this paper to the memory of Dr Vicente Castro-Castillo who passed away during the revision stage of this manuscript. Vicente was fundamental to the development of CAPRYDAA and he was a wonderful scientist and person. He will be greatly missed by all who knew him. The authors would like to thanks to MilkaStakic for the cells preparation and Prof. David Jameson for his valuable suggestion during the manuscript preparation. This work was partially supported by grants Grants NIH P41-GM103540 and NIH P50-GM076516. LM is supported for the Universidad de la República-Uruguay as a full time professor.References
- H. Bouvrais, T. Pott, L. A. Bagatolli, J. H. Ipsen and P. Meleard, Biochim. Biophys. Acta, Biomembr., 2010, 1798, 1333–1337 CrossRef CAS.
- E. Sezgin, I. Levental, S. Mayor and C. Eggeling, Nat. Rev. Mol. Cell Biol., 2017, 18, 361–374 CrossRef CAS PubMed.
- L. A. Sklar, B. S. Hudson and R. D. Simoni, Biochemistry, 1977, 16, 819–828 CrossRef CAS PubMed.
- G. Weber and F. J. Farris, Biochemistry, 1979, 18, 3075–3078 CrossRef CAS PubMed.
- T. Parasassi, G. De Stasio, G. Ravagnan, R. M. Rusch and E. Gratton, Biophys. J., 1991, 60, 179–189 CrossRef CAS.
- T. Parasassi and E. Gratton, J. Fluoresc., 1995, 5, 59–69 CrossRef CAS.
- L. A. Bagatolli, B. Maggio, F. Aguilar, C. P. Sotomayor and G. D. Fidelio, Biochim. Biophys. Acta, Biomembr., 1997, 1325, 80–90 CrossRef CAS.
- L. A. Bagatolli, E. Gratton and G. D. Fidelio, Biophys. J., 1998, 75, 331–341 CrossRef CAS.
- E. A. Lissi, E. B. Abuin, M. A. Rubio and A. Ceron, Langmuir, 2000, 16, 178–181 CrossRef CAS.
- F. M. Harris, S. K. Smith and J. D. Bell, J. Biol. Chem., 2001, 276, 22722–22731 CrossRef CAS.
- M. Viard, J. Gallay, M. Vincent and M. Paternostre, Biophys. J., 2001, 80, 347–359 CrossRef CAS.
- S. A. Sanchez, L. A. Bagatolli, E. Gratton and T. L. Hazlett, Biophys. J., 2002, 82, 2232–2243 CrossRef CAS.
- M. A. Tricerri, J. D. Toledo, S. A. Sanchez, T. L. Hazlett, E. Gratton, A. Jonas and H. A. Garda, J. Lipid Res., 2005, 46, 669–678 CrossRef CAS.
- L. A. Bagatolli, Biochim. Biophys. Acta, Biomembr., 2006, 1758, 1541–1556 CrossRef CAS PubMed.
- C. C. De Vequi-Suplicy, C. R. Benatti and M. T. Lamy, J. Fluoresc., 2006, 16, 431–439 CrossRef.
- L. Malacrida, E. Gratton and D. M. Jameson, Methods Appl. Fluoresc., 2015, 3, 047001 CrossRef.
- L. Malacrida, S. Astrada, A. Briva, M. Bollati-Fogolin, E. Gratton and L. A. Bagatolli, Biochim. Biophys. Acta, Biomembr., 2016, 1858, 2625–2635 CrossRef CAS.
- A. Strohmeier, G. Forst, P. Tauber and R. Schubert, Biophys. J., 2016, 111, 1714–1723 CrossRef CAS.
- L. A. Bagatolli and E. Gratton, Biophys. J., 1999, 77, 2090–2101 CrossRef CAS PubMed.
- S. A. Sanchez, M. A. Tricerri, G. Ossato and E. Gratton, Biochim. Biophys. Acta, Biomembr., 2010, 1798, 1399–1408 CrossRef CAS.
- D. Rodriguez-Agudo, L. Malacrida, G. Kakiyama, T. Sparrer, C. Fortes, M. Maceyka, M. A. Subler, J. J. Windle, E. Gratton, W. M. Pandak and G. Gil, J. Lipid Res., 2019, 60, 1087–1098 CrossRef CAS.
- L. Malacrida, D. M. Jameson and E. Gratton, Sci. Rep., 2017, 7, 9215 CrossRef.
- L. Malacrida and E. Gratton, Free Radical Biol. Med., 2018, 128, 144–156 CrossRef CAS.
- O. A. Kucherak, P. Didier, Y. Mely and A. A. Klymchenko, J. Phys. Chem. Lett., 2010, 1, 616–620 CrossRef CAS.
- J. Shaya, M. Collot, F. Benailly, N. Mahmoud, Y. Mely, B. Y. Michel, A. S. Klymchenko and A. Burger, ACS Chem. Biol., 2017, 12, 3022–3030 CrossRef CAS.
- Y. Niko, S. Kawauchi and G. Konishi, Chem. – Eur. J., 2013, 19, 9760–9765 CrossRef CAS.
- Y. Niko, P. Didier, Y. Mely, G. Konishi and A. S. Klymchenko, Sci. Rep., 2016, 6, 18870 CrossRef CAS.
- Z. K. Lu, S. J. Lord, H. Wang, W. E. Moerner and R. J. Twieg, J. Org. Chem., 2006, 71, 9651–9657 CrossRef CAS.
- H. Moon, Y. W. Jun, D. Kim, H. G. Ryu, T. Wang, K. H. Kim, Y. Huh, J. Jung and K. H. Ahn, Chem. – Asian J, 2016, 11, 2518–2523 CrossRef CAS.
- T. Pott, H. Bouvrais and P. Meleard, Chem. Phys. Lipids, 2008, 154, 115–119 CrossRef CAS.
- D. M. Jameson, E. Gratton and R. D. Hall, Appl. Spectrosc. Rev., 1984, 20, 55–106 CrossRef CAS.
- S. Ranjit, L. Malacrida, D. M. Jameson and E. Grafton, Nat. Protoc., 2018, 13, 1979–2004 CrossRef CAS.
- E. Lippert, Z. Naturforsch., A: Astrophys., Phys. Phys. Chem., 1955, 10, 541–545 Search PubMed.
- N. Mataga, Y. Kaifu and M. Koizumi, Bull. Chem. Soc. Jpn., 1956, 29, 465–470 CrossRef CAS.
- Y. Ma, A. Benda, J. Kwiatek, D. M. Owen and K. Gaus, Biophys. J., 2018, 115, 1498–1508 CrossRef CAS.
- F. Sena, M. Sotelo-Silveira, S. Astrada, M. A. Botella, L. Malacrida and O. Borsani, Plant Physiol. Biochem., 2017, 119, 224–231 CrossRef CAS.
- S. Ranjit, A. Dvornikov, E. Dobrinskikh, X. X. Wang, Y. H. Luo, M. Levi and E. Gratton, Biomed. Opt. Express, 2017, 8, 3143–3154 CrossRef CAS.
Footnote |
| † Electronic supplementary information (ESI) available. See DOI: 10.1039/c9tb01738k |
| This journal is © The Royal Society of Chemistry 2020 |


