
 Open Access Article
 This Open Access Article is licensed under a
 Creative Commons Attribution 3.0 Unported Licence
A universal pH range and a highly efficient Mo2C-based electrocatalyst for the hydrogen evolution reaction†
Jiajia
Huang
 a,
Jingyi
Wang
a,
Ruikuan
Xie
d,
Zhihong
Tian
*c,
Guoliang
Chai
d,
Yanwu
Zhang
a,
Feili
Lai
e,
Guanjie
He
*bf,
Chuntai
Liu
c,
Tianxi
Liu
c,
Paul R.
Shearing
b and
Dan J. L.
Brett
b
a,
Jingyi
Wang
a,
Ruikuan
Xie
d,
Zhihong
Tian
*c,
Guoliang
Chai
d,
Yanwu
Zhang
a,
Feili
Lai
e,
Guanjie
He
*bf,
Chuntai
Liu
c,
Tianxi
Liu
c,
Paul R.
Shearing
b and
Dan J. L.
Brett
b
aSchool of Chemical Engineering, Zhengzhou University, Zhengzhou 450001, P. R. China
bElectrochemical Innovation Lab, Department of Chemical Engineering, University College London, London WC1E 7JE, UK. E-mail: g.he@ucl.ac.uk
cKey Laboratory of Materials Processing and Mold (Zhengzhou University), Ministry of Education, National Engineering Research Center for Advanced Polymer Processing Technology, Zhengzhou University, Zhengzhou, Henan 450002, China. E-mail: zhihong.tian@zzu.edu.cn
dState Key Laboratory of Structural Chemistry, Fujian Institute of Research on the Structure of Matter, Chinese Academy of Sciences (CAS), Fuzhou, 350002 Fujian, P. R. China
eDepartment of Chemistry, KU Leuven, Celestijnenlaan 200F, Leuven 3001, Belgium
fSchool of Chemistry, University of Lincoln, Joseph Banks Laboratories, Green Lane, Lincoln, LN6 7DL, UK
First published on 31st August 2020
Abstract
Electrochemical water splitting is a promising approach to generate ‘green’ hydrogen. The efficiency of this process relies on the effectiveness of the electrocatalysts used. The electro-kinetics of the hydrogen evolution reaction (HER) is highly pH dependent and conventional catalysts typically are expensive and rare platinum-based materials. The development of low-cost, multi-component electrocatalysts, where each of the components has a synergistic effect, can be an effective approach to improve kinetics. Herein, a series of transition metal (Fe, Mn, Co, and Ni)-modified molybdenum carbides in a nitrogen-doped carbon matrix (TM-Mo2C@NCF) are synthesised to maximise exposed active sites. Among them, Fe-Mo2C@NCF delivers the best-in-class HER performance over a wide range of electrolytes. Tafel slopes of 76, 109 and 110 mV dec−1 and overpotentials of 65, 130 and 129 mV at 10 mA cm−2 were obtained in 1.0 M KOH, 1.0 M phosphate buffer solution (PBS) and 0.5 M H2SO4, respectively. The computational study further indicates that the synergistic electronic modulation co-activated by Fe and N dopants in Fe-Mo2C@NCF can reduce the Gibbs free energy of H adsorption (ΔGH*) and render the Mo–Mo bridge site the most energetically favorable adsorption site for the H* intermediate, which contributes to an increased HER performance.
1. Introduction
Owing to its high energy density and ability to be generated from renewable sources of energy, hydrogen (H2) is a promising alternative to fossil fuels to meet future global energy demands.1–3 Electrochemical water splitting is considered to be one of the most effective means of ‘green’ hydrogen generation.4–7 The production of hydrogen from water is a two-electron process, 2H+ + 2e− = H2, the electro-kinetics of which is highly pH dependent. Industrial production of hydrogen by water electrolysis can take place in acid or alkaline media, each having its relative merits and challenges, with the effect on the kinetics of the complementary oxygen evolution reaction (OER) playing an important role.8,9 Ruthenium (Ru)-based materials for the OER and HER are very promising because of their prominent catalytic activity and universal pH application. Various modification strategies on Ru-based materials have been summarized and the general description about water splitting has been presented to understand the reaction mechanism, and key stability issues for Ru-based materials have been further investigated.10,11 Additionally, it is desirable to achieve effective HER performance in neutral electrolytes for sea-water and microbial electrolysis.12–14 Therefore, to meet practical requirements, an ideal HER electrocatalyst should operate effectively over the entire pH range. Pt-based materials are the benchmark for the HER in acid media owing to their low overpotential and suitable hydrogen adsorption Gibbs free energy; however, their cost and scarcity are a barrier to industrial use.15,16 Therefore, extensive effort has been devoted to the development of hydrogen evolution catalysts based on noble-metal-free and earth-abundant resources.17Mo-based catalysts are regarded as favorable candidates for the HER due to the modification of the d-band structure induced by the formation of a metal–carbon bond.18,19 In the past few decades, various Mo-based materials, such as molybdenum sulphides,20–23 oxides,24 nitrides,25–27 phosphides,28–30 and carbides,31–33 have been emerging as prospective electrocatalysts for hydrogen production.2,34,35 Representatively, molybdenum carbide (Mo2C) has received wide attention and been intensively investigated as an HER catalyst on account of its abundance, low toxicity, similar Fermi level and d-electronic structure to Pt, and high resistance in various electrolytes.36–38 Particularly, β-phase molybdenum carbide (β-Mo2C) has demonstrated the highest activity among different crystalline phases of molybdenum carbides.36 Previous research has shown that Mo2C has a relatively undesirable hydrogen binding energy (ΔGH*) due to Mo atoms with a high density of an empty d-orbital; thus, it is easy to form strong Mo–H bonds on a Mo2C surface which is unfavorable for the desorption of active hydrogen, making the Heyrovsky/Tafel step partially restricted.19,28,39,40 Many modification methods to optimize the activity of molybdenum carbide have been summarized; specific nanostructures and carbon-based hybrids are introduced to increase the active sites and promote mass transfer, and heteroatom doping is encouraged to improve the chemical configurations of active sites towards intrinsically boosted HER kinetics.41,42 Elemental doping has been established to be a reliable method to regulate the electronic structure of materials.43 Recently, the modification of Mo2C-based materials, especially via introducing different elements into the Mo2C lattice, has been widely explored.44,45 This method strongly affected their HER properties by regulating the electron density of such materials. Ma et al. reported porous molybdenum carbide (β-Mo2C) spheres with novel surface engineered structures (coexistence of Co doping and Mo vacancies) to enhance the HER performance over the β-Mo2C-based catalyst surface and tested their hydrogen evolution activity in acidic media.46 Wan et al. reported a wide range of magnetic iron-doped molybdenum carbide (Mo2−xFexC) nanomaterials synthesised by the decomposition of a novel amine-metal oxide composite. They evaluated their hydrogen evolution activity in an acid environment, which required a ∼300 mV overpotential to achieve a current density of 10 mA cm−2.47 Li et al. reported a two-dimensional coupled hybrid of molybdenum carbide and reduced graphene oxide with a ternary polyoxometalate-polypyrrole/reduced graphene oxide nanocomposite as a precursor and tested its hydrogen evolution activity in acidic media.48 Xiong et al. reported Ni-doped Mo2C nanowires directly grown on Ni foam via a hydrothermal reaction combined with a carbonization process and tested their hydrogen evolution activity in alkaline media.49 Furthermore, Mo2+ sites have been proven to be important for promoting catalytic hydrogen evolution,50,51 but their abundance among the Mo2C structures is difficult to control. Even though great effort has been made to the improvement of Mo2C-based catalyst performance, tuning of properties for effective operation in neutral electrolytes, and further expanding the range of applications, is seldom achieved. Thus, a strategy to optimise the structure and electronic properties of Mo2C-based materials is urgently required to implement these materials as an efficient noble metal-free ‘pH-universal’ HER catalyst.
Herein, we develop a facile annealing strategy to synthesise a series of transition metal (TM)-doped molybdenum carbide modified within porous nitrogen-doped carbon frameworks (TM-Mo2C@NCF). Among them, iron-doped molybdenum carbide (Fe-Mo2C) showing the most abundant Mo2+ active species exhibits the highest catalytic HER activity and long-term stability for the HER under all media, thus making it easy to couple with any suitable OER catalysts in different electrolytes. This is ascribed to the merits of high intrinsic activity from the combination of Fe2+ and Mo2+ in Mo2C, which exposes more Mo–Mo bridge active sites, as well as the stabilising effect of the nitrogen-doped carbon frameworks. Density functional theory (DFT) calculations are also applied to elucidate the underlying mechanism behind the distinct performance by comparing the electronic structure, hydrogen chemisorption process and Gibbs free energy of pure Mo2C and Fe-Mo2C@NCF.
2. Experimental
2.1 Synthesis of TM-Mo2C@NCF
The preparation of the various TM-Mo2C@NCF materials all followed a similar procedure. The amount of C2H2O4·2H2O and melamine remained unchanged with a molar ratio of 2![[thin space (1/6-em)]](https://www.rsc.org/images/entities/char_2009.gif) :1. Typically, Fe-Mo2C@NCF was synthesised as follows. Firstly, 2.48 g (2 mmol) of (NH4)6Mo7O24·4H2O and 2.52 g (0.02 mol) of C2H2O4·2H2O were dissolved in 40 mL of deionized water. 1.26 g (0.01 mol) of melamine was added to the above clear solution, and then the mixture was kept at 70 °C for 6 h under magnetic stirring. Then, 5 mL of Fe2(SO4)3 solution (0.07 mmol of Fe3+) was added into the above mixed solution, stirring at 70 °C for 12 h progressively. After filtration, the precipitate was washed with deionized water and ethanol, then dried under vacuum at 60 °C. During this process, a composite containing Fe salts, oxalate and molybdate was formed, which was used as the precursor. Subsequently, the precursor was calcined at 800 °C for 3 h with a heating rate of 5 °C min−1 under a continuous N2 flow. To investigate the effects of different doped metals (Mn/Fe/Co/Ni) on the hydrogen evolution performance, Mn/Co/Ni-doped materials were prepared according to Table S1 in the ESI.† The obtained products were denoted as sample xTM-Mo2C@NCF, where x is the molar ratio of TM:Mo, respectively.
:1. Typically, Fe-Mo2C@NCF was synthesised as follows. Firstly, 2.48 g (2 mmol) of (NH4)6Mo7O24·4H2O and 2.52 g (0.02 mol) of C2H2O4·2H2O were dissolved in 40 mL of deionized water. 1.26 g (0.01 mol) of melamine was added to the above clear solution, and then the mixture was kept at 70 °C for 6 h under magnetic stirring. Then, 5 mL of Fe2(SO4)3 solution (0.07 mmol of Fe3+) was added into the above mixed solution, stirring at 70 °C for 12 h progressively. After filtration, the precipitate was washed with deionized water and ethanol, then dried under vacuum at 60 °C. During this process, a composite containing Fe salts, oxalate and molybdate was formed, which was used as the precursor. Subsequently, the precursor was calcined at 800 °C for 3 h with a heating rate of 5 °C min−1 under a continuous N2 flow. To investigate the effects of different doped metals (Mn/Fe/Co/Ni) on the hydrogen evolution performance, Mn/Co/Ni-doped materials were prepared according to Table S1 in the ESI.† The obtained products were denoted as sample xTM-Mo2C@NCF, where x is the molar ratio of TM:Mo, respectively.
2.2 Electrocatalytic HER
The electrochemical measurements are carried out at room temperature using a CHI 660E potentiostat. Ag/AgCl (3 M KCl) and a graphite rod are used as a reference electrode (RE) and a counter electrode (CE) respectively. According to the formula E (RHE) = E (Ag/AgCl) + 0.0591 × pH + 0.2 V, all potentials can be converted to the reversible hydrogen electrode (RHE). The catalyst ink can be prepared by mixing a solution containing 190 μL of distilled water, 50 μL of ethanol, 5 wt% Nafion solution (10 μL) and the catalyst (2.0 mg) after an hour of sonication in an ice water bath. Thereafter, the surface of carbon paper (coated area: 0.5 × 1 cm2) is loaded with 100 μL of the prepared catalyst ink, wherein 1.6 mg cm−2 is calculated to be the loading amount. To compare the properties of the as-prepared catalysts, linear sweep voltammetry (LSV) is conducted at a scan rate of 5 mV s−1. A commercial 20 wt% Pt/C catalyst is used as the reference material for comparison of performance. The polarization curves were plotted as overpotential (η) versus log current (logJ) to get Tafel plots for evaluating the HER kinetics. The Tafel slope (b) as an intrinsic property of the catalyst was obtained by fitting the linear portion of Tafel plots according to the Tafel equation (η = blog(J) + a) that can describe the rate-determining step of the HER process. Regarding the evaluation of the electrochemically active surface areas (ECSAs) of the catalysts, CV tests were performed by measuring the electrical double-layer capacitances (Cdl) with different scan rates (10, 20, 30, 40, 50, 60, 70, 80, 90 and 100 mV s−1). The chronoamperometry measurements of 0.5% Fe-Mo2C@NCF are conducted at an overpotential of 105 mV and negligible degradation can be observed after a 12 h process. In addition, after continuous CV scans at a scan rate of 100 mV s−1, the overpotential differences of the polarization curves before and after the 1000 CV cycles between −0.1 and 0.1 V (vs. Ag/AgCl) were compared. Note that all the as-measured current densities were corrected to reduce the effect of ohmic resistance.
2.3 Characterization
XRD patterns were recorded using a Bruker D8 Advance X-ray diffractometer with a Cu Kα source. The 2θ angular region of the XRD pattern between 20° and 80° was studied at a scan rate of 0.1 s−1 with each step of 0.02°. The microstructures and compositions of samples were analyzed using scanning electron microscopy (SEM, Zeiss/Auriga Focused ion beam SEM), transmission electron microscopy and high-resolution transmission electron microscopy (TEM and HRTEM, FEI TalosF200S). X-ray photoelectron spectroscopy (XPS) measurements were performed on an ESCALAB 250 instrument (Thermo Electron) with Al Kα radiation. Raman spectra were collected using a LabRAM HR Evolution Laser Raman Spectrometer with a 532 nm laser diode as the excitation source. Brunauer–Emmett–Teller (BET) surface area measurements were obtained using a Micromeritics ASAP2460 with nitrogen adsorption at 77k. The amount of doped metal (Mn, Fe, Co, and Ni) in the samples was determined by ICPAES (ICPE-9820, SHIMADZU).3. Results and discussion
Fe-Mo2C@NCF nanostructures were synthesised by the solid-state thermolysis of a melamine-related composite of oxalate, Mo sources and Fe precursors. As for a typical synthesis, 0.5% Fe-Mo2C@NCF was produced from annealing the precursor containing Fe salts, oxalate and molybdate. The crystalline phases of xFe-Mo2C@NCF characterised via XRD are shown in Fig. 1a, and the XRD patterns of xM-Mo2C-@NCF (M = Mn/Co/Ni) are shown in Fig. S1.† The peaks located at 2θ of 34.4°, 37.9°, 39.4°, 52.1°, 61.5°, 69.6°, 72.4° and 74.6° are assigned to (100), (002), (101), (102), (110), (103), (200) and (112) planes of the hexagonal β-Mo2C (PDF no. #35-0787); the phase is consistent with other reported electrocatalysts that presented the highest HER activities;52–54 similar distribution of peaks indicates that they are all β-Mo2C phase.55 No other diffraction peaks of impurities were detected and the as-prepared catalysts all display a high crystallinity. However, the patterns of β-Mo2C in the 0.5% Fe-Mo2C@NCF catalyst shows a slight shift to a higher diffraction region, in comparison with pure Mo2C (Fig. S2, ESI†). This shift of the diffraction peaks is attributed to the shrinkage of the Mo2C unit cell because the radius of iron is smaller than that of molybdenum. The absolute values of lattice parameters and unit cell volumes for undoped and Fe modified samples are listed in Table S2.† Both lattice parameters (a/b and c) and unit cell volume follow similar trends, decreasing with the increase of Fe doping amount from 0 to 0.31%, and the replacement of some Mo atoms with smaller Fe in the lattice contributes to the shrinking of the Mo2C unit cell. The Mn/Fe/Co/Ni doping amount of all the as-prepared catalysts is determined by inductively coupled plasma atomic emission spectroscopy (ICPAES) (Table S3, ESI†). Moreover, the BET surface area of 0.5% Fe-Mo2C@NCF (29.5 m2 g−1) is higher than that of undoped Mo2C (23.9 m2 g−1), which could increase the active sites.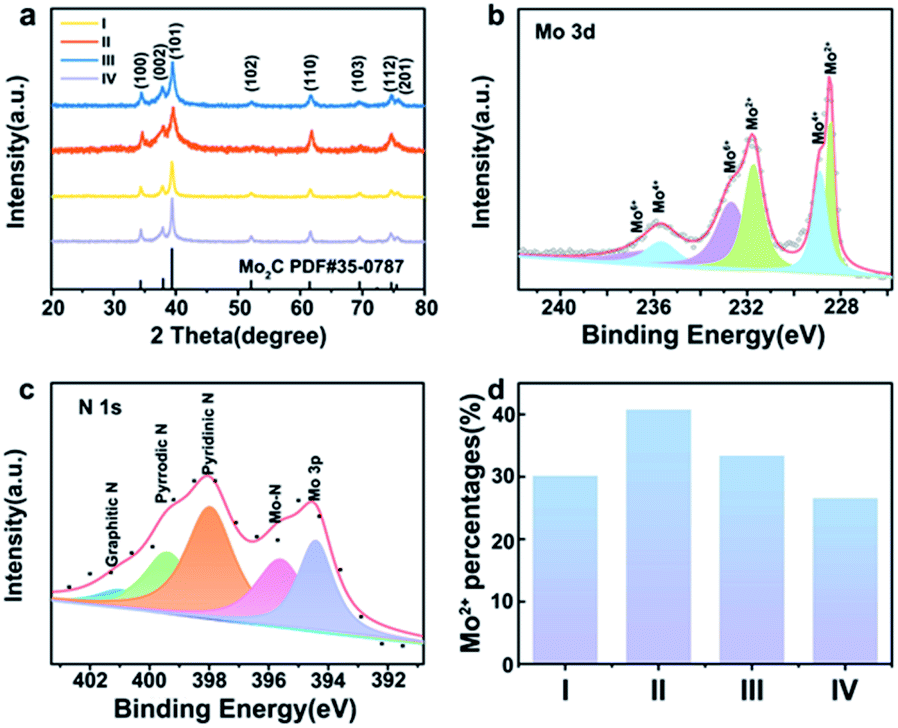 | ||
| Fig. 1 Powder XRD patterns of Fe-doped materials, in which I/II/III/IV represent 0.2% Fe-Mo2C@NCF, 0.5% Fe-Mo2C@NCF, 1% Fe-Mo2C@NCF and undoped Mo2C@NCF, respectively. XPS spectrum of (a) Mo 3d (b)and N 1s (c) in 0.5% Fe-Mo2C@NCF, and its surface Mo2+ percentages (d) compared with other materials, in which I/II/III/IV represent 0.2% Fe-Mo2C@NCF, 0.5% Fe-Mo2C@NCF, 1% Fe-Mo2C@NCF and undoped Mo2C, respectively. | ||
To identify the chemical environment of xFe-Mo2C@NCF on the surface, XPS analysis was conducted. Fig. S3† shows the full XPS profiles of 0.5% Mn-Mo2C@NCF, 0.5% Fe-Mo2C@NCF, 0.5% Co-Mo2C@NCF and 0.5% Ni-Mo2C@NCF. From the XPS survey analysis shown in Fig. S3b,† the surface of 0.5% Fe-Mo2C@NCF is composed of Mo, N, C and O. There is no obvious Fe peak because the doping content of Fe is relatively low. The peak fitting of Mo 3d verifies the existence of Mo2C (Mo2+ at 228.5 and 231.7 eV). Moreover, Mo4+ at 228.9 and 235.6 eV and Mo6+ at 232.7 and 236.1 eV originate from surface oxidation (Fig. 1b). The presence of higher oxidation states from XPS is acceptable owing to the unavoidable surface oxidation layers of carbide materials, particularly for the nanosized ones, which are easily oxidized on the surface.56 Similarly, Mo 3d spectra of 0.5% Mn-Mo2C@NCF, 0.5% Co-Mo2C@NCF and 0.5% Ni-Mo2C@NCF are displayed in Fig. S4.† As can be seen from Fig. 1c, the N 1s XPS spectrum is deconvoluted into five peaks at 394.57, 396.21, 398.23, 399.84 and 401.49 eV, which correspond to Mo 3p, Mo–N, pyridinic-N, pyrrolic-N, and graphitic-N, respectively, implying N-doping in the carbon matrix and the joint binding of Mo with the carbon skeleton.35,57,58 In particular, pyridinic-N exhibits the highest peak from the spectrum and it was verified as advantageous for enhancing the catalytic performance of water splitting.59 The increase of the Mo2+ content should be attributed to the addition of transition metals, which is proved to be beneficial for the HER.60 By comparing the peak area of Mo2+ in materials with different molar ratios of Fe/Mo (Fig. 1d) and different types of TM doping (Fig. S4d, ESI†), it is obvious that Mo2+ species are the most abundant when the molar ratio of Fe to Mo is 0.5:100, according to the XPS analysis, which indicates that doped iron is combined tightly with Mo atoms that leads to an increase of the Mo2+ content in the molybdenum carbide catalysts. The increased Mo2+ species further enrich the active sites on the surface of the materials, and also improve the electron density, which has a positive effect on the hydrogen evolution catalytic properties.
Fig. S5 and S6† show scanning electron microscope (SEM) and TEM images of 0.5% Mn-Mo2C@NCF, 0.5% Fe-Mo2C@NCF, 0.5% Co-Mo2C@NCF and 0.5% Ni-Mo2C@NCF, respectively. It can be seen that the morphology of these materials has negligible differences because all materials were synthesised under the same conditions, except using different TM precursors. In particular, 0.5% Fe-Mo2C@NCF has a rougher surface, which consists of nanoparticles with several pits and is beneficial to exposing more active species. TEM images of both pure β-Mo2C (Fig. 2a) and 0.5% Fe-Mo2C@NCF (Fig. 2d) show the analogous nanoparticle shape with the particle size of about 15 nm. The d-spacing (2.3 Å, Fig. 2b) and SAED (Fig. 2c) pattern are consistent with the (101) plane of β-Mo2C. In Fig. 2e, β-Mo2C nanoparticles are wrapped by amorphous carbon. The existence of graphitic carbon has also been confirmed by the XRD patterns in Fig. 1a. The presence of a graphitic carbon support is another crucial factor to improve catalytic properties for the entire system.60–62 Raman spectroscopy was performed to reveal the carbon structure of the catalysts by the ratio of ID/IG. The Raman spectra (Fig. S6, ESI†) exhibit double peaks at around 1347 cm−1 and 1593 cm−1, where the D-band (1347 cm−1) was associated with sp2 nanocrystalline carbon while the G-band (1593 cm−1) corresponded to sp2 amorphous carbon materials, the large ID/IG implying that more defects formed on the NCF, thus favoring the accessibility of more active sites and enhancing the catalytic properties. EDS mapping via HRTEM in Fig. 2g–i proves that Mo, Fe and N are uniformly distributed and overlapped in the particles.
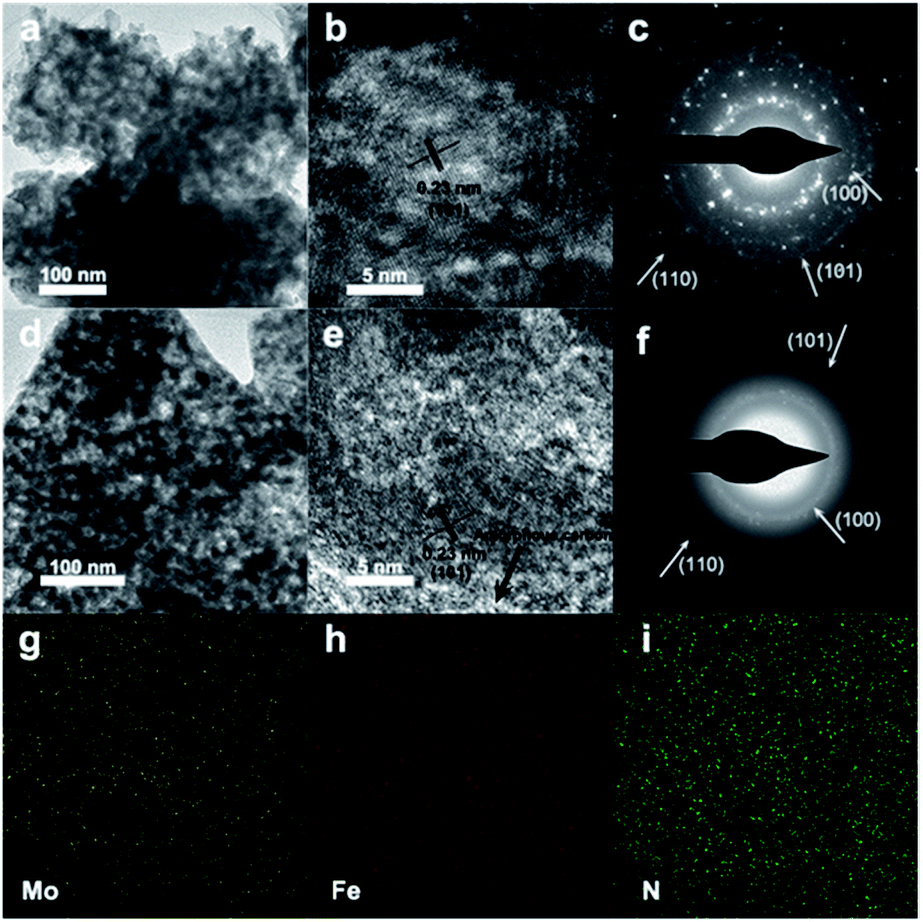 | ||
| Fig. 2 (a) TEM image, (b) HRTEM image, and (c) SAED pattern of pure β-Mo2C. (d) TEM image, (e) HRTEM image, and (f) SAED pattern of 0.5% Fe-Mo2C@NCF. The corresponding EDS mapping images of (g) Mo, (h) Fe and (i) N for 0.5% Fe-Mo2C@NCF. | ||
As for the development of electrocatalytic technology, catalysts that are only suitable for acidic environments limit the range of practical applicability.63–66 For example, microbial electrolysis and alkaline electrolysis need catalysts to be efficient in neutral and alkaline media, respectively.64,65 Therefore, more electrocatalysts with high activity and stability in alkaline or neutral media need to be developed.67 To get a more comprehensive evaluation of the electrocatalytic HER activity, the performance was measured in alkaline solution (1.0 M KOH, pH = 13.9), 1.0 M phosphate buffer solution (pH = 7) and acid solution (0.5 M H2SO4, pH = 0.1) with a fixed mass loading of 1.6 mg cm−2 on the carbon paper. For a comparative study, Pt/C (20 wt%) was also examined for HER activity.
To obtain further insight into the HER activities of the electrocatalysts, the kinetic parameters evaluating the performance are summarised in Table S2 and Fig. S7.† The electrocatalytic activity of the materials was primarily investigated in alkaline media. In alkaline electrolyte, the 0.5% Fe-Mo2C@NCF afforded a relatively low η of 65 mV to reach the current density of 10 mA cm−2 and 172 mV for 100 mA cm−2 (Fig. 3a), which is 16 and 244 mV less than that for undoped Mo2C, respectively. For highly active catalysts, the cathode current rises rapidly when a more negative potential is applied. Comparatively, 0.2% Fe-Mo2C@NCF, 1% Fe-Mo2C@NCF and undoped Mo2C show higher overpotentials of 199, 235 and 416 mV at a current density of 100 mA cm−2, respectively; indicating that 0.5% Fe-Mo2C@NCF exhibits the highest activity in alkaline environments. Consistent with the XPS results, the 0.5% Fe doping content results in the most abundant Mo2+ species on the surface of Mo2C, which exposes more active sites, and reaches the peak of the Fe–N–Mo cooperative coordination and shows the best HER activity.68 For the integral HER process, the reaction step is the combination of the Volmer reaction and the Heyrovsky or Tafel reaction to generate H2, and generally referred to as the Volmer–Heyrovsky or Volmer–Tafel process. By plotting overpotential (η) against log current (logJ), the Tafel slope was obtained and kinetic parameters for the HER were calculated. The linear part of the Tafel plots (Fig. 3b) reveals Tafel slopes of ∼80, ∼76, ∼141 and ∼178 mV dec−1 for 0.2% Fe-Mo2C@NCF, 0.5% Fe-Mo2C@NCF, 1% Fe-Mo2C@NCF and undoped Mo2C, respectively. This illustrates that hydrogen evolution on 0.5% Fe-Mo2C@NCF proceeds via the Volmer–Heyrovsky mechanism and that the electrochemical desorption step is rate-limiting. Compared with other electrocatalysts, except Pt/C, the exchange current density of 0.5% Fe-Mo2C@NCF is the highest (∼1.02 mA cm−2). It is logical to ascribe the increased activity to the larger electrochemically active surface area (ECSA). One method to estimate the ECSA is to measure the double-layer capacitance (Cdl).69,70 Based on the cyclic voltammograms (CVs) at different scan rates (Fig. S8, ESI†) in the region of +0.81 and +0.86 V (vs. Ag/AgCl), where the current response is due to the charging of the double-layer capacitance (non-faradaic current region), the capacitances of 0.2% Fe-Mo2C@NCF, 0.5% Fe-Mo2C@NCF, 1% Fe-Mo2C@NCF and undoped Mo2C are calculated to be 15.9, 21.4, 13.8 and 8.1 mF cm−2, respectively. This reveals the highest ECSA, and consequently the greatest number of catalytic active sites, for 0.5% Fe-Mo2C@NCF (Fig. 3c). As a potentially effective candidate for the HER, the stability of a catalyst is also a key index. The durability of the 0.5% Fe-Mo2C@NCF electrode was tested by conducting continuous cyclic voltammetry (CV) scanning between −0.1 V and 0 V vs. RHE at a scan rate of 10 mV s−1 in 1.0 M KOH. After 1000 cycles, the 0.5% Fe-Mo2C@NCF still performs efficiently with negligible loss of cathodic current density (Fig. 3d). Moreover, the chronoamperometric test of this electrode by electrolysis at a fixed overpotential of 105 mV also suggests its good durability (Fig. 3d).
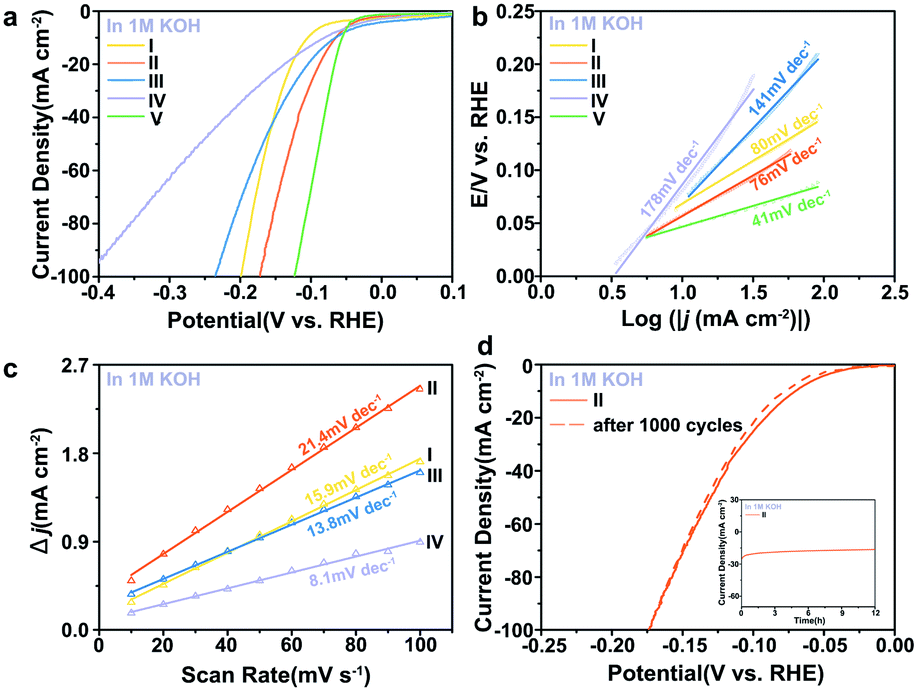 | ||
| Fig. 3 (a) The iR-corrected polarization curves at a scan rate of 5 mV s−1 and (b) the Tafel slopes of (I) 0.2% Fe-Mo2C@NCF, (II) 0.5% Fe-Mo2C@NCF, (III) 1% Fe-Mo2C@NCF, (IV) undoped Mo2C, and (V) Pt/C (20%) electrocatalyst in 1.0 M KOH. (c) Estimation of Cdl through plotting the difference of current densities against the scan rates to fit a linear regression of I, II, III and IV. (d) Polarization curves of 0.5% Fe-Mo2C@NCF (II) before and after 1000 cycles. Chronoamperometry curves at η = −105 mV (vs. RHE) shown in the inset (in 1.0 M KOH). | ||
It is of importance to mention that the 0.5% Fe-Mo2C@NCF electrode also performs well in 1.0 M PBS for the HER. It is clear that pure Mo2C has poor catalytic activity towards the HER. The polarization curves of 0.5% Fe-Mo2C@NCF in 1.0 M PBS are shown in Fig. 4a, which demonstrate an overpotential of 130 mV vs. RHE to reach a current density of 10 mA cm−2 and relatively low overpotential of 275 mV to reach 100 mA cm−2. In contrast, 0.2% Fe-Mo2C@NCF, 1% Fe-Mo2C@NCF and undoped Mo2C, showed higher overpotentials of 406, 378 and 484 mV, respectively, at a current density of 100 mA cm−2 in buffer solution. Fig. 4b shows the Tafel plots of 0.2% Fe-Mo2C@NCF, 0.5% Fe-Mo2C@NCF, 1% Fe-Mo2C@NCF and undoped Mo2C, which are consistent with LSV test results that 0.5% Fe-Mo2C@NCF provided the smallest Tafel slope (109 mV dec−1) compared to other electrodes. It is noted that the 0.5% Fe-Mo2C@NCF electrode maintains long-term durability for the HER in 1.0 M PBS (Fig. 4g); the polarization curves of 0.5% Fe-Mo2C@NCF exhibit a subtle decay after 1000 cycles of continuous cyclic voltammograms, illustrating the stability of the prepared catalysts and the resistance to accelerated degradation. The HER performances for the above catalysts were also tested in 0.5 M H2SO4. For 0.5% Fe-Mo2C@NCF, it requires an overpotential of 129 mV to drive 10 mA cm−2 and 242 mV for 100 mA cm−2 (Fig. 4d), which is much smaller than that of undoped Mo2C at 10 mA cm−2 (162 mV). 0.5% Fe-Mo2C@NCF shows a lower Tafel slope (110 mV dec−1) than pure Mo2C (131 mV dec−1), as shown in Fig. 4e. Its stability in acid media was also evaluated. As observed, there is negligible loss in current density after 1000 continuous CV cycles (Fig. 4h), and its activity can be maintained for at least 12 h in both neutral and acidic media (Fig. 4i).
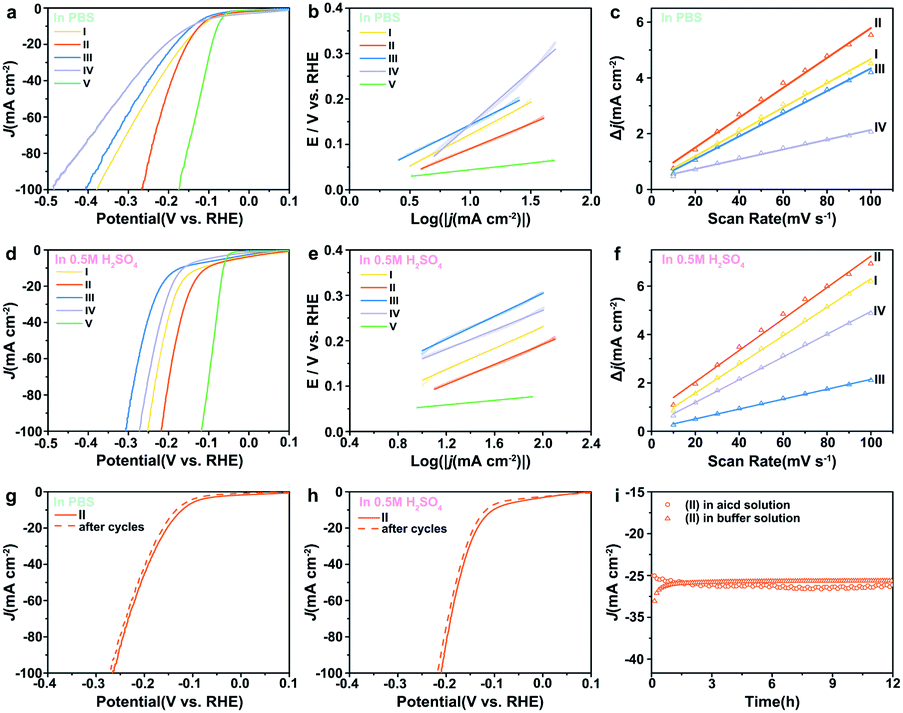 | ||
| Fig. 4 The iR-corrected polarization curves at a scan rate of 5 mV s−1 and the corresponding Tafel slopes of (I) 0.2% Fe-Mo2C@NCF, (II) 0.5% Fe-Mo2C@NCF, (III) 1% Fe-Mo2C@NCF, (IV) undoped Mo2C, and (V) Pt/C (20%) electrocatalysts in 1.0 M PBS (a and b) and in 0.5 M H2SO4(d and e); Cdl of I, II, III and IV in 1.0 M PBS (c) and in 0.5 M H2SO4 (f); polarization curves of 0.5% Fe-Mo2C@NCF before and after 1000 cycles in 1.0 M PBS (g) and 0.5 M H2SO4 (h); chronoamperometry curves at η = −160 mV (vs. RHE) in 1.0 M PBS and 0.5 M H2SO4 (i). | ||
The hydrogen evolution properties of three groups of materials doped with manganese, cobalt, and nickel atoms in different proportions were also tested in acidic, neutral, and alkaline media (Fig. S9–S11 and Tables S6–S8, ESI†). Comparing the performance of the most active materials in the other three groups (0.5% Mn-Mo2C@NCF, 0.5% Co-Mo2C@NCF, and 0.5% Ni-Mo2C@NCF) with 0.5% Fe-Mo2C@NCF, as shown in Fig. 5, it can be seen that the performance of 0.5% Fe-Mo2C@NCF in three different pH media is still the best and attributed to the more abundant Mo2+ active sites. As further compared with the current noble-metal-free catalysts (Tables S9 and S10, ESI†), the 0.5% Fe-Mo2C@NCF material shows the best-in-class performance.
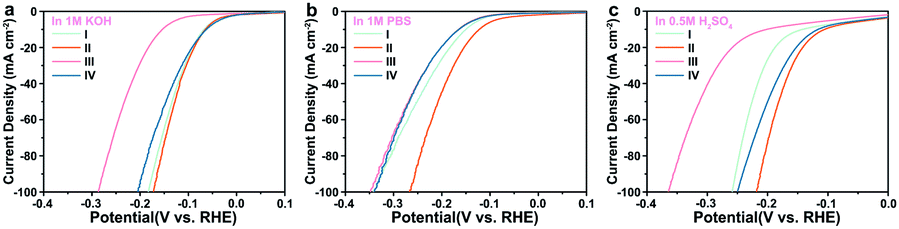 | ||
| Fig. 5 The iR-corrected polarization curves at a scan rate of 5 mV s−1 of (I) 0.5% Mn-Mo2C@NCF, (II) 0.5% Fe-Mo2C@NCF, (III) 0.5% Co-Mo2C@NCF, and (IV) 0.5% Ni-Mo2C@NCF electrocatalysts in 1.0 M KOH (a), 1.0 M PBS (b), and 0.5 M H2SO4 (c). | ||
To gain further insight into the high electrocatalytic activity of the 0.5% Fe-Mo2C@NCF electrocatalyst, DFT calculations were performed by constructing correlative theoretical models (Fig. S12–S19†). The adsorption free energy of H (ΔGH*) can serve as an accepted measure for the activity of a catalytic material for the HER, for which a catalyst that gives ΔGH* close to 0 is considered a good candidate for the HER. The calculations of ΔGH* for 0.5% Fe-Mo2C@NCF are described in Fig. 6. For comparison, a similar calculation was performed on pristine Mo2C and 1% Fe-Mo2C@NCF. The influence of Fe dopants is investigated by replacing Mo atoms by Fe atoms. Four different doping sites for single Fe dopants are considered (Fig. S13†) to simulate the 0.5% Fe-Mo2C@NCF material. The structure with the lowest formation energy is used for the following HER study (Fig. S13d and S14†). Eight different initial H* adsorption sites are considered and five different adsorption models were obtained after relaxation, as shown in Fig. S15.† The site with the strongest binding between H* is shown in Fig. S15c and S16.† The limiting potential of the HER on 0.5% Fe-Mo2C@NCF is 0.39 V (Fig. 6a), which shows a better HER catalytic activity than pristine Mo2C, and the HER catalytic activity decreases with a higher Fe concentration (two Fe dopants, 0.46 V). This is in agreement with the experimental results discussed above. In fact, the Mo–Mo bridge site in Fig. S13d† was found to be the most energetically favorable adsorption site for the H* intermediate in 0.5% Fe-Mo2C@NCF (shown in the ESI†). To reveal the mechanism of how Fe dopants enhance the HER activity on Mo2C, the electronic properties of the atoms on the adsorption sites have been studied. As shown in Fig. 6b, the d-band center of Mo in pristine Mo2C is 0.45 eV closer to the Fermi level than that of Mo2C:1Fe. Thus, Mo in Mo2C:1Fe will bind with H* weaker than that in pristine Mo2C and have a better HER catalytic activity. Besides *H adsorption strength, water dissociation is also an important step for HER activity under alkaline conditions. Our computational results indicate that the water dissociation step is an exothermic reaction for both Mo2C and Mo2C:1Fe, while they are more energetically favorable on Mo2C:1Fe as shown in Fig. S21.† Considering *H adsorption and water dissociation, we can conclude that Fe doping is an effective approach to enhance the HER activity under alkaline conditions. This result reinforces the presence of the synergy between Mo2C and Fe dopants, providing outstanding catalytic activity to the Mo–Mo bridge site in Mo2C and making 0.5% Fe-Mo2C@NCF a highly efficient HER catalyst.
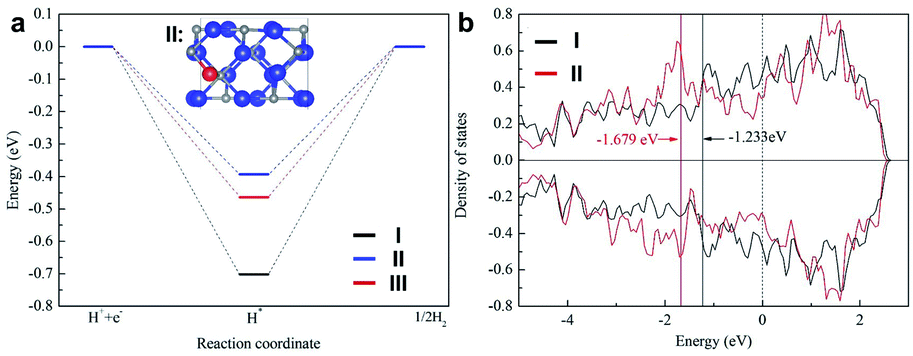 | ||
| Fig. 6 (a) Free energy diagrams of the HER on pristine Mo2C (I), 0.5% Fe-Mo2C (II) and 1% Fe-Mo2C (III). (b) Partial density of states of the Mo-3d states at the adsorption sites on pristine Mo2C (I) and 0.5% Fe-Mo2C (II). The d-band center of each material is labelled with corresponding values. | ||
4. Conclusions
In conclusion, Fe-doped molybdenum carbide on a nitrogen-doped carbon substrate (Fe-Mo2C@NCF) with a loosely linked and channel-rich structure was prepared and proven to be a highly efficient electrocatalyst for the hydrogen evolution reaction over a wide pH range. Benefitting from the exposure of abundant active sites and excellent structural stability, the Fe-Mo2C@NCF exhibits enhanced activity for the HER, such as a low η10 of 65, 130 and 129 mV as well as η100 of 172, 275 and 242 mV dec−1 in 1.0 M KOH, 1.0 M PBS and 0.5 M H2SO4, respectively. In addition, the synergistic catalytic effects between the N-doped carbon substrate and Fe-doped Mo2C nanoparticles were realised, which can boost the continuous electron transport between metal dopants and transition metal carbide, optimise active species and enhance the corrosion resistance and stability of the catalyst.Conflicts of interest
There is no conflicts of interest.Acknowledgements
This work was supported the National Natural Science Foundation of China (No. 51873198, 51503184 and 21703248), the Strategic Priority Research Program of the Chinese Academy of Sciences (Grant No. XDB20000000), the Engineering and Physical Sciences Research Council (EPSRC, EP/R023581/1) and the STFC Batteries Network (ST/R006873/1).References
- H. B. Wu, B. Y. Xia, L. Yu, X. Y. Yu and X. W. Lou, Nat. Commun., 2015, 6, 6512 CrossRef CAS.
- J. Zhang, T. Wang, P. Liu, Z. Liao, S. Liu, X. Zhuang, M. Chen, E. Zschech and X. Feng, Nat. Commun., 2017, 8, 15437 CrossRef CAS.
- M. Hou, X. Teng, J. Wang, Y. Liu, L. Guo, L. Ji, C. Cheng and Z. Chen, Nanoscale, 2018, 10, 14594–14599 RSC.
- Y. Li, H. Wang, L. Xie, Y. Liang, G. Hong and H. Dai, J. Am. Chem. Soc., 2011, 133, 7296–7299 CrossRef CAS.
- D. Voiry, H. Yamaguchi, J. Li, R. Silva, D. C. Alves, T. Fujita, M. Chen, T. Asefa, V. B. Shenoy, G. Eda and M. Chhowalla, Nat. Mater., 2013, 12, 850–855 CrossRef CAS.
- E. J. Popczun, J. R. McKone, C. G. Read, A. J. Biacchi, A. M. Wiltrout, N. S. Lewis and R. E. Schaak, J. Am. Chem. Soc., 2013, 135, 9267–9270 CrossRef CAS.
- D. Voiry, H. S. Shin, K. P. Loh and M. Chhowalla, Nat. Rev. Chem., 2018, 2, 0105 CrossRef CAS.
- M. Y. Zu, P. F. Liu, C. Wang, Y. Wang, L. R. Zheng, B. Zhang, H. Zhao and H. G. Yang, ACS Energy Lett., 2017, 3, 78–84 CrossRef.
- G. Zhao, K. Rui, S. X. Dou and W. Sun, Adv. Funct. Mater., 2018, 28, 1803291 CrossRef.
- J. Yu, Q. He, G. Yang, W. Zhou, Z. Shao and M. Ni, ACS Catal., 2019, 9, 9973–10011 CrossRef CAS.
- S.-Y. Bae, J. Mahmood, I.-Y. Jeon and J.-B. Baek, Nanoscale Horiz., 2020, 5, 43–56 RSC.
- J. Tian, Q. Liu, A. M. Asiri and X. Sun, J. Am. Chem. Soc., 2014, 136, 7587–7590 CrossRef CAS.
- Y. Zheng, Y. Jiao, M. Jaroniec and S. Z. Qiao, Angew. Chem., Int. Ed., 2015, 127, 52–66 CrossRef.
- Z. Pu, M. Wang, Z. Kou, I. S. Amiinu and S. Mu, Chem. Commun., 2016, 52, 12753–12756 RSC.
- S. Wang, L. Pan, J. J. Song, W. Mi, J. J. Zou, L. Wang and X. Zhang, J. Am. Chem. Soc., 2015, 137, 2975–2983 CrossRef CAS.
- Y. Huang, H. Lu, H. Gu, J. Fu, S. Mo, C. Wei, Y. E. Miao and T. Liu, Nanoscale, 2015, 7, 18595–18602 RSC.
- W.-F. Chen, S. Iyer, S. Iyer, K. Sasaki, C.-H. Wang, Y. Zhu, J. T. Muckerman and E. Fujita, Energy Environ. Sci., 2013, 6, 1818 RSC.
- J. G. Chen, Chem. Rev., 1996, 96, 1477–1498 CrossRef CAS.
- R. Michalsky, Y.-J. Zhang and A. A. Peterson, ACS Catal., 2014, 4, 1274–1278 CrossRef CAS.
- S. Park, J. Park, H. Abroshan, L. Zhang, J. K. Kim, J. Zhang, J. Guo, S. Siahrostami and X. Zheng, ACS Energy Lett., 2018, 3, 2685–2693 CrossRef CAS.
- J. Deng, H. Li, S. Wang, D. Ding, M. Chen, C. Liu, Z. Tian, K. S. Novoselov, C. Ma, D. Deng and X. Bao, Nat. Commun., 2017, 8, 14430 CrossRef CAS.
- K. Ojha, S. Saha, S. Banerjee and A. K. Ganguli, ACS Appl. Mater. Interfaces, 2017, 9, 19455–19461 CrossRef CAS.
- H. Wang, L. Ouyang, G. Zou, C. Sun, J. Hu, X. Xiao and L. Gao, ACS Catal., 2018, 8, 9529–9536 CrossRef CAS.
- S. Zhao, J. Berry-Gair, W. Li, G. Guan, M. Yang, J. Li, F. Lai, F. Corà, K. Holt, D. J. L. Brett, G. He and I. P. Parkin, Adv. Sci., 2020, 1903674 CrossRef.
- H. Yan, Y. Xie, Y. Jiao, A. Wu, C. Tian, X. Zhang, L. Wang and H. Fu, Adv. Mater., 2018, 30, 1704156 CrossRef.
- R. Kumar, R. Rai, S. Gautam, A. De Sarkar, N. Tiwari, S. N. Jha, D. Bhattacharyya, A. K. Ganguli and V. Bagchi, J. Mater. Chem. A, 2017, 5, 7764–7768 RSC.
- W. F. Chen, K. Sasaki, C. Ma, A. I. Frenkel, N. Marinkovic, J. T. Muckerman, Y. Zhu and R. R. Adzic, Angew. Chem., Int. Ed., 2012, 51, 6131–6135 CrossRef CAS.
- J. Yang, F. Zhang, X. Wang, D. He, G. Wu, Q. Yang, X. Hong, Y. Wu and Y. Li, Angew. Chem., Int. Ed., 2016, 55, 12854–12858 CrossRef CAS.
- T. Wang, K. Du, W. Liu, Z. Zhu, Y. Shao and M. Li, J. Mater. Chem. A, 2015, 3, 4368–4373 RSC.
- L. Yu, I. K. Mishra, Y. Xie, H. Zhou, J. Sun, J. Zhou, Y. Ni, D. Luo, F. Yu, Y. Yu, S. Chen and Z. Ren, Nano Energy, 2018, 53, 492–500 CrossRef CAS.
- Y. Huang, Q. Gong, X. Song, K. Feng, K. Nie, F. Zhao, Y. Wang, M. Zeng, J. Zhong and Y. Li, ACS Nano, 2016, 10, 11337–11343 CrossRef CAS.
- J. Xiong, J. Li, J. Shi, X. Zhang, N.-T. Suen, Z. Liu, Y. Huang, G. Xu, W. Cai, X. Lei, L. Feng, Z. Yang, L. Huang and H. Cheng, ACS Energy Lett., 2018, 3, 341–348 CrossRef CAS.
- J. Wan, J. Wu, X. Gao, T. Li, Z. Hu, H. Yu and L. Huang, Adv. Funct. Mater., 2017, 27, 1703933 CrossRef.
- H. Sun, Y. Lian, C. Yang, L. Xiong, P. Qi, Q. Mu, X. Zhao, J. Guo, Z. Deng and Y. Peng, Energy Environ. Sci., 2018, 11, 2363–2371 RSC.
- Y. Zhang, B. Ouyang, J. Xu, S. Chen, R. S. Rawat and H. J. Fan, Adv. Energy Mater., 2016, 6, 1600221 CrossRef.
- H. Vrubel and X. Hu, Angew. Chem., Int. Ed., 2012, 51, 12703–12706 CrossRef CAS.
- P. Xiao, X. Ge, H. Wang, Z. Liu, A. Fisher and X. Wang, Adv. Funct. Mater., 2015, 25, 1520–1526 CrossRef CAS.
- W. F. Chen, C. H. Wang, K. Sasaki, N. Marinkovic, W. Xu, J. T. Muckerman, Y. Zhu and R. R. Adzic, Energy Environ. Sci., 2013, 6, 943 RSC.
- Y. Shi and B. Zhang, Chem. Soc. Rev., 2016, 45, 1781 RSC.
- J. Greeley, T. F. Jaramillo, J. Bonde, I. B. Chorkendorff and J. K. Norskov, Nat. Mater., 2006, 5, 909–913 CrossRef CAS.
- Q. Gao, W. Zhang, Z. Shi, L. Yang and Y. Tang, Adv. Mater., 2019, 31, e1802880 CrossRef.
- Y. Ma, G. Guan, X. Hao, J. Cao and A. Abudula, Renewable Sustainable Energy Rev., 2017, 75, 1101–1129 CrossRef CAS.
- J. Yin, Q. Fan, Y. Li, F. Cheng, P. Zhou, P. Xi and S. Sun, J. Am. Chem. Soc., 2016, 138, 14546–14549 CrossRef CAS.
- S. Jing, L. Zhang, L. Luo, J. Lu, S. Yin, P. K. Shen and P. Tsiakaras, Appl. Catal., B, 2018, 224, 533–540 CrossRef CAS.
- K. Lan, L. Gong, M. Yang, X. Huang, P. Jiang, K. Wang, L. Ma and R. Li, J. Colloid Interface Sci., 2019, 553, 148–155 CrossRef CAS.
- Y. Ma, M. Chen, H. Geng, H. Dong, P. Wu, X. Li, G. Guan and T. Wang, Adv. Funct. Mater., 2020, 30, 2000561 CrossRef CAS.
- C. Wan and B. M. Leonard, Chem. Mater., 2015, 27, 4281–4288 CrossRef CAS.
- J. S. Li, Y. Wang, C. H. Liu, S. L. Li, Y. G. Wang, L. Z. Dong, Z. H. Dai, Y. F. Li and Y. Q. Lan, Nat. Commun., 2016, 7, 11204 CrossRef CAS.
- K. Xiong, L. Li, L. Zhang, W. Ding, L. Peng, Y. Wang, S. Chen, S. Tan and Z. Wei, J. Mater. Chem. A, 2015, 3, 1863–1867 RSC.
- H. Lin, Z. Shi, S. He, X. Yu, S. Wang, Q. Gao and Y. Tang, Chem. Sci., 2016, 7, 3399–3405 RSC.
- H. Lin, N. Liu, Z. Shi, Y. Guo, Y. Tang and Q. Gao, Adv. Funct. Mater., 2016, 26, 5590–5598 CrossRef CAS.
- Z.-Y. Wu, B.-C. Hu, P. Wu, H.-W. Liang, Z.-L. Yu, Y. Lin, Y.-R. Zheng, Z. Li and S.-H. Yu, NPG Asia Mater., 2016, 8, e288 CrossRef CAS.
- H. Ang, H. Wang, B. Li, Y. Zong, X. Wang and Q. Yan, Small, 2016, 12, 2859–2865 CrossRef CAS.
- Y. Liu, G. Yu, G. D. Li, Y. Sun, T. Asefa, W. Chen and X. Zou, Angew. Chem., Int. Ed., 2015, 54, 10752–10757 CrossRef CAS.
- C. Wan, Y. N. Regmi and B. M. Leonard, Angew. Chem., Int. Ed., 2014, 53, 6407–6410 CrossRef CAS.
- R. Ma, Y. Zhou, Y. Chen, P. Li, Q. Liu and J. Wang, Angew. Chem., Int. Ed., 2015, 54, 14723–14727 CrossRef CAS.
- W. F. Chen, K. Sasaki, C. Ma, A. I. Frenkel, N. Marinkovic, J. T. Muckerman, Y. Zhu and R. R. Adzic, Angew. Chem., Int. Ed., 2012, 51, 6131–6135 CrossRef CAS.
- J. Duan, S. Chen, M. Jaroniec and S. Z. Qiao, ACS Nano, 2015, 9, 931–940 CrossRef CAS.
- L. Lai, J. R. Potts, D. Zhan, L. Wang, C. K. Poh, C. Tang, H. Gong, Z. Shen, J. Lin and R. S. Ruoff, Energy Environ. Sci., 2012, 5, 7936 RSC.
- Q. Liu, J. Tian, W. Cui, P. Jiang, N. Cheng, A. M. Asiri and X. Sun, Angew. Chem., Int. Ed., 2014, 53, 6710–6714 CrossRef CAS.
- C. He and J. Tao, Chem. Commun., 2015, 51, 8323–8325 RSC.
- B. Hinnemann, P. G. Moses, J. Bonde, K. P. Jørgensen, J. H. Nielsen, S. Horch, I. Chorkendorff and J. K. Nørskov, J. Am. Chem. Soc., 2005, 127, 5308–5309 CrossRef CAS.
- A. Le Goff, V. Artero, B. Jousselme, P. D. Tran, N. Guillet, R. Métayé, A. Fihri, S. Palacin and M. Fontecave, Science, 2009, 326, 1384–1387 CrossRef CAS.
- A. Kundu, J. N. Sahu, G. Redzwan and M. Hashim, Int. J. Hydrogen Energy, 2013, 38, 1745–1757 CrossRef CAS.
- R. LeRoy, Int. J. Hydrogen Energy, 1983, 8, 401–417 CrossRef CAS.
- S. T. Oyama, T. Gott, H. Zhao and Y.-K. Lee, Catal. Today, 2009, 143, 94–107 CrossRef CAS.
- S. Carenco, D. Portehault, C. Boissiere, N. Mezailles and C. Sanchez, Chem. Rev., 2013, 113, 7981–8065 CrossRef CAS.
- H. Lin, N. Liu, Z. Shi, Y. Guo, Y. Tang and Q. Gao, Adv. Funct. Mater., 2016, 26, 5590–5598 CrossRef CAS.
- J. Tian, Q. Liu, N. Cheng, A. M. Asiri and X. Sun, Angew. Chem., Int. Ed., 2014, 53, 9577–9581 CrossRef CAS.
- Z. Lu, L. Qian, Y. Tian, Y. Li, X. Sun and X. Duan, Chem. Commun., 2016, 52, 908–911 RSC.
Footnote |
| † Electronic supplementary information (ESI) available. See DOI: 10.1039/d0ta07091b |
| This journal is © The Royal Society of Chemistry 2020 |