 Open Access Article
Creative Commons Attribution 3.0 Unported Licence
Real and virtual polymorphism of titanium selenide with robust interatomic potentials†
David
Mora-Fonz
 *a,
J. Christian
Schön
b,
Janett
Prehl
 c,
Scott M.
Woodley
 d,
C. Richard A.
Catlow
 de,
Alexander L.
Shluger
 a and
Alexey A.
Sokol
 *d
*d
aDepartment of Physics and Astronomy, University College London, Gower Street, London, WC1E 6BT, UK. E-mail: david.fonz.11@ucl.ac.uk
bMax Planck Institute for Solid State Research, Heisenbergstr. 1, 70569 Stuttgart, Germany
cFakultät für Naturwissenschaften, Technische Universität Chemnitz, D-09107 Chemnitz, Germany
dDepartment of Chemistry, University College London, Gower Street, London, WC1E 6BT, UK. E-mail: a.sokol@ucl.ac.uk
eSchool of Chemistry, Cardiff University, Park Place, Cardiff, CF10 3AT, UK
First published on 12th June 2020
Abstract
The first successful pairwise potential for a layered material, TiSe2, has been parameterised to fit the experimental data, using a genetic algorithm as the optimisation tool for the parameters of the interatomic potential. This potential has been tested on a wide range of hypothetical isomorphous AX2 metastable phases using ab initio derived data. From the initial survey, the ground state 1T–TiSe2 structure remains the lowest enthalpy phase in a wide range of pressures (0 to 25![[thin space (1/6-em)]](https://www.rsc.org/images/entities/char_2009.gif) GPa), which leaves open questions about the nature of a reported unknown high-pressure phase.
GPa), which leaves open questions about the nature of a reported unknown high-pressure phase.
1 Introduction
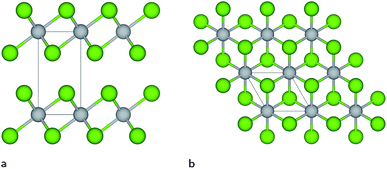
Titanium diselenide belongs to a class of highly topical transition metal dichalcogenide materials with exciting physical properties and a wide range of applications in advanced electronics and catalysis. Even though research focusing on TiSe2 goes back many decades,1–7 there has been a recent growing scientific interest in this material fuelled by an observed charge density wave (CDW) transition8 and superconducting properties achieved upon copper intercalation,9 when applying pressure10 or under electrical gating.11 Under ambient conditions, the thermodynamically most stable TiSe2 structure exhibits Se–Ti–Se layers repeated along the c-axis (see Fig. 1), which are bonded together with weak van der Waals (vdW) forces between Se ions of adjacent layers, similar to the CdI2 structure. This layered compound undergoes a CDW transition at a critical temperature of Tc ≈ 200 K, below which the structure adopts a 2 × 2 × 2 periodicity with a weak lattice distortion.12,13The novel physical properties shown by TiSe2 and other layered quasi-two-dimensional (quasi-2D) materials, e.g. graphene, MoS2, and hexagonal boron nitride (h-BN), have stimulated considerable interest in modelling and improving their properties. Modelling at the ab initio level provides a very accurate description of the atomic and electronic structure, but is unfeasible when dealing with large systems and long time-scale simulations. This limitation implies serious compromises when comparing with experiment. However, accurate force fields can provide a very good description of the structure and crystal properties of a material, including, e.g., thermal transport, mechanical deformation, defect formation energies, among others. Recently, for example, long time-scale molecular dynamics (MD) simulations using hundreds of thousands of atoms have been used to study a wide range of phenomena/materials, such as nucleation and microstructure evolution,14 self-assembly in complex fluids,15 radiation damage,16 and amorphisation of oxides.17,18
There is, therefore, a strong need for the development of reliable interatomic potentials for layered quasi-2D materials, which would allow us to explore scenarios that are computationally too expensive at the ab initio level, including exploration of the materials' potential energy landscapes, prediction of new structures, structure evolution on time scales of nanoseconds, global optimisation calculations, and atomic structures on the nano/micrometer scale. So far, force fields reported for quasi-2D materials have been based on many-body potentials for covalent materials, see e.g., MoS2,19–21 black phosphorus20 and others.22 The potential models for covalent materials include valence-force field models and potentials of the Stillinger–Weber,23 Tersoff24,25 and Brenner26 type. The computational cost of these models might, however, be much higher than the one of two-body interatomic potentials, while not providing a more accurate physical description of the interactions in the system.
In this paper, we use TiSe2 as an example to demonstrate that interatomic interactions in layered materials can, indeed, be described with a polarisable shell model (PSM) two-body interatomic potential (PSM IP). This PSM IP can describe the, at ambient conditions, thermodynamically most stable TiSe2 crystal structure and its elastic and phonon properties with good accuracy and, to our knowledge, it is the first successful pairwise potential for a layered material. Moreover, the PSM IP proved to be effective in our exploration of the potential energy landscape of TiSe2, where we find a good agreement with ab initio results for the energies and possible hierarchy of local minima of TiSe2 bulk polymorphs and clusters. The quality of the TiSe2 PSM IP presented here opens up the possibility of studying this material's properties in situations where ab initio calculations are not feasible.
We describe the physical properties and atomic structure of TiSe2 by a polarisable shell model using pairwise parameter-dependent analytical functions in the form of combined Buckingham, Morse and Lennard-Jones terms — see Table 1. Unusually, the model includes short-range interactions between shells and cores of different anions, which allows us to account for strongly non-linear polarisation effects in electron-rich Se species (a local dipole dependence of the short-range interaction). Moreover, the softness of Se results in strong overlap/penetration effects between nearest-neighbour Ti and Se ions, which could not be described by a single simple potential form. A combination of the Morse and Buckingham forms allows for a more thorough search through the functional space when fitting parameters of the PSM IP, but also it helps to separate explicitly the short- and long-range attraction and repulsion effects. The rapid increase in the Morse potential for shorter distances effectively alleviates the Buckingham catastrophe for the sensitive range of bonding distances in different coordination environments. We note that our PSM IP has not been fitted to any explicit data about the vdW interactions in this system; we have relied on the fitting to experimentally observed structure and physical properties. The dielectric properties and phonon dispersion have been key to fix the spring constants in our fitted set. We have also included repulsive Lennard-Jones terms to avoid spurious short interatomic distances caused by the divergence of the Cr−6 Buckingham term.‡ The fitting procedure includes the TiSe2 crystal structure, its elastic constants and phonon frequencies (shown in Table 2) as given in ref. 12 and 13. In total, our PSM IP uses 14 parameters, which were fitted to a set of experimental data as summarised in Table 1.
| Morse potentials | Range (Å) | D e (eV) | a (Å−1) | r 0 (Å) |
|---|---|---|---|---|
| Ti shell–Se shell | 0–25 | 0.090068974 | 3.4453 | 2.46725 |
| Se shell–Se shell | 0–25 | 0.026832692 | 2.2547 | 3.77684 |
| Buckingham potentials | Range (Å) | A (eV) | ρ (Å) | C (eV Å6) |
|---|---|---|---|---|
| Se shell–Se shell | 0–25 | 65![[thin space (1/6-em)]](https://www.rsc.org/images/entities/char_2009.gif) 401.82 401.82 |
0.230864 | 7.485809 |
| Lennard-Jones potentials | Range (Å) | A (eV Å12) | B (eV Å6) |
|---|---|---|---|
| Ti shell–Se shell | 0–25 | 100 | 0 |
| Se shell–Se core | 0.8–25 | 100 | 0 |
| Ti shell–Ti core | 0.8–25 | 100 | 0 |
| Spring potentials | Range (Å) | k 2 (eV Å−2) |
|---|---|---|
| Se core–Se shell | 0–0.8 | 21.36361 |
| Ti core–Ti shell | 0–0.8 | 6389.55 |
| Species | Atomic charges (e) |
|---|---|
| Ti core | 2.186108 |
| Se core | 1.633706 |
| Ti shell | −1.186108 |
| Se shell | −2.133706 |
| TiSe2 | Experiment | This work |
|---|---|---|
| a (Å) | 3.536 | 3.532 |
| c (Å) | 6.004 | 5.965 |
| C11 (GPa) | 120 | 124.3 |
| C33 (GPa) | 39 | 48.2 |
| C12 (GPa) | 42 | 41.2 |
| C44 (GPa) | 14.3 | 9.2 |
| ω at the Γ point (cm−1) | 0 | 0 |
| 0 | 0 | |
| 0 | 0 | |
| 137 | 109.8 | |
| 137 | 109.8 | |
| 148 | 146.3 | |
| 148 | 169.6 | |
| 162 | 174.4 | |
| 204 | 197.7 |
2 Computational methods
2.1 Fitting procedure
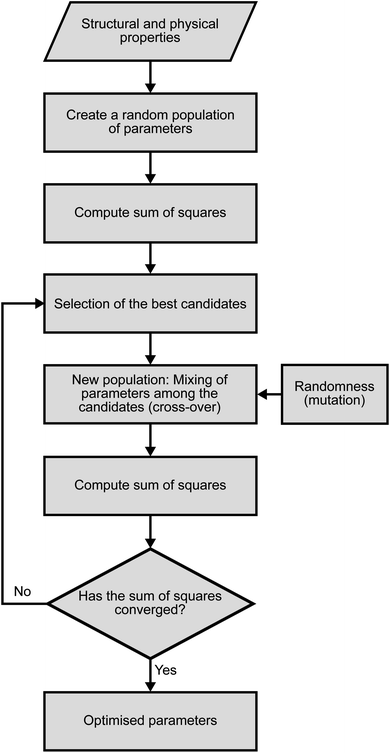
The fitting of the TiSe2 force field was performed in three steps using a novel procedure. First, we used a genetic algorithm (GA) as implemented in the GULP code as a global optimisation tool.27,28 500 parallel GA runs were performed in this way, with 1000 generations and 10![[thin space (1/6-em)]](https://www.rsc.org/images/entities/char_2009.gif) 000 configurations in the parametric space for each generation. The flowchart for each GA run is shown in Fig. 2. The tournament and crossover probabilities were optimised in trial runs and fixed at 0.8 and 0.4, respectively. Each GA run had a different random number seed to make sure that the starting point for each run was different. Next, the parameters obtained from the GA were optimised to their closest local minimum in the parametric space using the simplex algorithm29 and least squares techniques as implemented in GULP. The resulting best set of parameters is presented in Table 1, whereas Table 2 shows the comparison between the observed crystal structure properties and those calculated with the optimised PSM IP. The total energy is calculated as the sum of Coulomb interactions and every force-field term.
000 configurations in the parametric space for each generation. The flowchart for each GA run is shown in Fig. 2. The tournament and crossover probabilities were optimised in trial runs and fixed at 0.8 and 0.4, respectively. Each GA run had a different random number seed to make sure that the starting point for each run was different. Next, the parameters obtained from the GA were optimised to their closest local minimum in the parametric space using the simplex algorithm29 and least squares techniques as implemented in GULP. The resulting best set of parameters is presented in Table 1, whereas Table 2 shows the comparison between the observed crystal structure properties and those calculated with the optimised PSM IP. The total energy is calculated as the sum of Coulomb interactions and every force-field term.
We note that the TiSe2 material has a relatively low polarity; therefore, we have tested models with different degrees of ionicity and found the best fit to result from the Ti and Se charges of 1/4 of the formal ionic charge: +1.0e and −0.5e, respectively. We also note that, within the force constant formalism, Takaoka and Motizuki12 have calculated the TiSe2 phonon dispersion curves using a PSM with a similar Ti charge of 0.75e.
2.2 Monte Carlo search
Monte Carlo routines, as implemented in our in-house knowledge led master code (KLMC),30–32 have been used to identify the lowest energy structures at ambient and high pressure. In these simulations, we used an orthorhombic extension of the hexagonal TiSe2 primitive cell, which is commensurate with other hypothetical TiSe2 phases (including the C2/m phase that has been proposed based on high pressure Raman data, see below). Inside of this unit cell, a grid of lattice positions was evenly distributed with a separation of 1.3![[thin space (1/6-em)]](https://www.rsc.org/images/entities/char_2009.gif) Å between points, thus, creating a total of 891 lattice positions of which 18 were randomly occupied. For each run, 10
Å between points, thus, creating a total of 891 lattice positions of which 18 were randomly occupied. For each run, 10![[thin space (1/6-em)]](https://www.rsc.org/images/entities/char_2009.gif) 000 structures were created by KLMC and locally optimised with GULP using our new PSM IP. A good convergence of the energy distribution is already achieved when 2000 structures were used (see Fig. 3). We note that due to the restriction imposed by our settings (1.3
000 structures were created by KLMC and locally optimised with GULP using our new PSM IP. A good convergence of the energy distribution is already achieved when 2000 structures were used (see Fig. 3). We note that due to the restriction imposed by our settings (1.3![[thin space (1/6-em)]](https://www.rsc.org/images/entities/char_2009.gif) Å between points) and to help optimisation, structures were first optimised using a rigid ion model and then fully optimised with the shells included. Similar two-step processes are widely used in materials modelling, e.g. to filter low-energy candidates for a subsequent DFT refinement.33–35 We report the results of KLMC MC runs at 0 and 25
Å between points) and to help optimisation, structures were first optimised using a rigid ion model and then fully optimised with the shells included. Similar two-step processes are widely used in materials modelling, e.g. to filter low-energy candidates for a subsequent DFT refinement.33–35 We report the results of KLMC MC runs at 0 and 25![[thin space (1/6-em)]](https://www.rsc.org/images/entities/char_2009.gif) GPa, with two independent runs for each pressure. Additionally, the effect of the initial volume was evaluated with a larger unit cell, totalling 60
GPa, with two independent runs for each pressure. Additionally, the effect of the initial volume was evaluated with a larger unit cell, totalling 60![[thin space (1/6-em)]](https://www.rsc.org/images/entities/char_2009.gif) 000 KLMC-generated and GULP-optimised structures.
000 KLMC-generated and GULP-optimised structures.
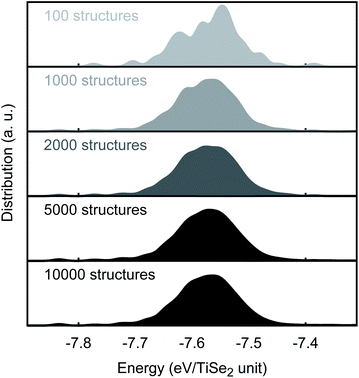 | ||
| Fig. 3 MC convergence. PSM IP total energy distribution as a function of the number of MC-generated structures. | ||
2.3 Ab initio calculations
The reoptimisation of the PSM IP AX2 structures was carried out by the periodic plane-wave DFT code VASP. Exchange and correlation were included using the generalized gradient approximation (GGA) PBEsol36 functional with interactions between cores and valence electrons being described by the projector-augmented wave (PAW)37,38 method. A good total energy convergence to 1 meV was achieved at an energy cutoff of 500 eV and a k-point spacing of 0.3 Å−1. The PBEsol functional was used for the hybrid calculations.3 Results and discussion
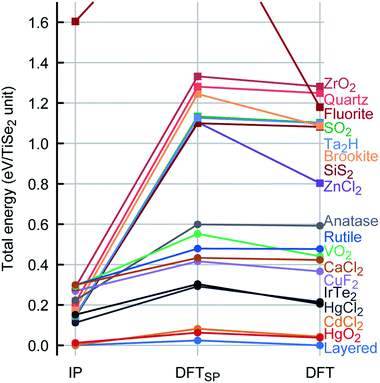
In general, there is an excellent agreement for the calculated TiSe2 lattice parameters when compared with experiment: the lattice parameters a and c are reproduced within ca. 0.1% and 0.6%, respectively. There is also a good overall agreement with experiment for the calculated elastic constants and vibrational spectra (see Table 2). We note that the TiSe2 PSM IP that we have developed are robust and can be used for MD calculations and exploration of the energy landscape, for example, using MC methods. This is achieved by including repulsive Lennard-Jones terms that heavily penalise spurious short distances between species that may result from high velocities or large displacements in various problems e.g. radiation damage or structure prediction, and ionic terms needed to establish the long-range ordering of the ions and their local coordination spheres, yielding a globally robust description of the energy landscape as we show below.To check the robustness and transferability of our PSM IP we have investigated the TiSe2 global energy landscape by modelling the geometry and energetics of the thermodynamically most stable TiSe2 structure and other hypothetical sixteen AX2 polymorphs, which were taken from well-known crystal structures with an AX2 stoichiometry. Every structure was then fully reoptimised (including both lattice parameters and internal atomic coordinates) with the periodic plane-wave DFT code VASP (Vienna Ab initio Simulation Package)39–42 keeping symmetry constraints. The energy ranking (relative energies per TiSe2 formula unit) and comparison between the PSM IP and DFT potential energy landscapes are shown in Fig. 4.
As we have noted above, the PSM IP calculations and experiment show good agreement for the ground state structure (Table 2). We also observe a very similar ranking of the local minima for PSM IP and DFT energies (Fig. 4). Moreover, during global searches in the low-energy region of the potential energy landscape with the threshold algorithm43,44 as implemented in the G42+ code package45 no structure with lower energy was observed, indicating that the PSM IP yields an accurate representation of the potential energy landscape; an exhaustive exploration of the TiSe2 potential energy landscape is currently in progress. Fig. 4 shows that there are many similarities between the PSM IP and DFT energy landscapes around known thermodynamically metastable phases of isomorphous AX2 crystalline compounds as described above. We note that the PSM IP energy differences are, however, lower than those at the DFT level. Similar high energy differences from a DFT approach have been observed in other systems, e.g., Cu/ZnO,33 Ti clusters,34 or Cu4Ag4 clusters.46 Structurally, the optimised PSM IP structures are close to the corresponding DFT minima. The reliability of our new set of PSM IP is such that any observed structural differences between PSM IP and DFT calculations disappear on optimisation after just a few small atomic displacements, pointing to the structural (geometric) similarity between the two landscapes. We observe in the absolute majority of cases that the optimised IP structures are very close to their DFT local minima. We have calculated the energy difference per TiSe2 unit between the initial (DFTSP) and final structures obtained from the DFT optimisation process: for more than 70% of the structures this difference is less than 0.05 eV and in some cases (more than 17%) is less than 0.01 eV. This structural similarity is also reflected in the small number of ionic steps needed to achieve convergence, which is fewer than 15 in about half of the cases. We note that, conversely, when the DFT AX2 structures are re-optimised with the PSM IP, these structures (except ZnCl2) revert to the ones shown in the PSM IP column in Fig. 4, indicating a close similarity of the shape of the PSM IP and the DFT landscape in the neighbourhood of the local minima. Only ZnCl2 optimises to a higher energy configuration instead. On a closer inspection of the four thermodynamically accessible, lowest energy structures, we note that the mismatch between PSM IP and DFT for the lattice parameters is below 5%, with an average of 2.5%. As shown by the data markers (Fig. 4), the lowest energy structures have an octahedral environment.
Remarkably, the lowest energy configuration and the CdCl2-like structures are very close structurally and energetically on the PSM IP landscape. However, DFT enhances this small structural difference with an energetic difference per TiSe2 unit of 0.014 eV between the two structures compared to the 2 × 10⁻⁴ eV calculated with the PSM IP. The three lowest energy structures are layered, whereas the fourth one is a distortion of the HgCl2-like phase, which retains its structure on DFT optimisation. Higher energy structures are expected to be difficult to access with conventional synthetic methods. Moreover, the new PSM IP predict that the thermodynamically accessible polymorphs are stable for a wide range of pressures with no phase transition (see Fig. 5 where the evolution of lattice enthalpy with pressure is shown for all lowest energy compounds investigated in the range of 0 to 25![[thin space (1/6-em)]](https://www.rsc.org/images/entities/char_2009.gif) GPa).§
GPa).§
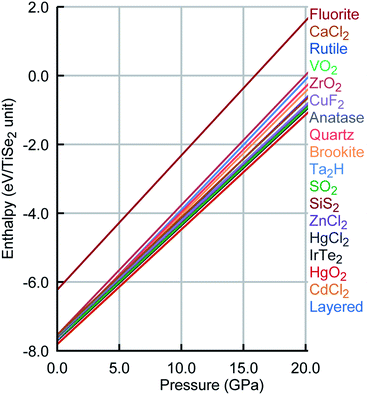 | ||
| Fig. 5 Pressure phase diagram for TiSe2. Colour scheme was kept as Fig. 4. | ||
Therefore, we conclude that there is a clear agreement between the new PSM IP and DFT, for different AX2 crystal structures, at least as far as the stability and the local neighbourhood near the various minima, and the overall robustness far away from the minima, are concerned. The robustness of this PSM IP is in strong contrast with essentially all other (simple) interatomic potentials, which have been employed for the description of layered quasi-2D compounds in the past and have encountered serious problems when applied to regions of the energy landscape away from the atomic configurations to which they had been fitted (e.g.Ref. 21).
The success of this approach in developing and parameterising interatomic potentials rests, we suggest, on the physically sound choice of a robust and transferable model. In particular, a simple chemical analysis of the bonding in TiSe2 tells us that atoms are linked by simple heteropolar sigma-type bonds. In such systems, one can expect the dominant role of pairwise interactions and the need for an adequate description of Se polarisability. Both of these features are often absent or underestimated in commonly applied many-body potential models.
As a first application, we have also investigated the structure and properties of very small TiSe2 clusters. This exercise is, however, purely illustrative and a brief discussion is given in the ESI,† whereas a more detailed study on TiSe2 clusters will be published soon. In general, there is a good agreement between our PSM IP model and DFT, demonstrating, again, the predictive power of the new PSM IP.
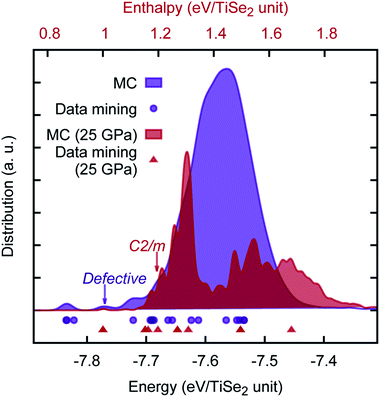
We note a report of a possible pressure driven structural phase transition in the range of ≈15 − 19![[thin space (1/6-em)]](https://www.rsc.org/images/entities/char_2009.gif) GPa (ref. 47) as shown by the evolution of the characteristic Raman signatures of fundamental optical phonon modes in TiSe2. It is proposed that as with 1T–TiTe2 and IrTe2,48,49 the TiSe2 undergoes a transition to a non-layered monoclinic C2/m phase structure. We have checked this hypothesis using both our newly developed PSM IP and ab initio calculations in the range of relevant pressures. Both methods showed an excellent agreement with each other, but curiously no sign of a phase transition was found. The energy offset (in eV per TiSe2 formula unit) between the two structures has been calculated to be 0.15 (0.17), 0.25 (0.39), 0.32 (0.48) for PSM IP, standard DFT and hybrid DFT, respectively at 0 GPa (25 GPa). Furthermore, we have performed an unbiased MC search for lowest enthalpy structures — at 0 and 25 GPa — using orthorhombic supercells of the TiSe2 structure (which is hexagonal in the primitive setting), commensurate with C2/m phase. Results of our search, which sampled over 60, 000 local minima, are illustrated in Fig. 6, where we observed that the layered TiSe2 structure remains the ground state across the full range of pressures investigated; the main data mined AX2 structures are rediscovered by the unbiased search; and a new type of metastable phase is predicted, which can be considered either as a defective layered structure, in which the layering pattern is regularly interrupted with Ti polyhedra displaced into the interlayer space connecting two adjacent layers,¶ or alternatively as “generalization” of the C2/m structure with the polyhedral units extended in one or two dimensions. The hypothetical pressure induced phase transformation may be, therefore, a result of stoichiometry changes and will be affected by impurities present in the experimental material. Our PSM IP model, however, would need to be extended to describe such effects. In this context, we also note the multitude of possible polytypes, which can be generated by different close packings of the Se-atom layers and different distributions of the Ti atoms over the octahedral holes. It is planned to employ the so-called PCAE (Primitive Cell approach for Atom Exchange) method51 to generate such structure candidates and explore their structural and electronic properties. A systematic investigation of the energy landscape of TiSe2 will be reported in the near future, where we hope to be able to answer this experimental challenge.
GPa (ref. 47) as shown by the evolution of the characteristic Raman signatures of fundamental optical phonon modes in TiSe2. It is proposed that as with 1T–TiTe2 and IrTe2,48,49 the TiSe2 undergoes a transition to a non-layered monoclinic C2/m phase structure. We have checked this hypothesis using both our newly developed PSM IP and ab initio calculations in the range of relevant pressures. Both methods showed an excellent agreement with each other, but curiously no sign of a phase transition was found. The energy offset (in eV per TiSe2 formula unit) between the two structures has been calculated to be 0.15 (0.17), 0.25 (0.39), 0.32 (0.48) for PSM IP, standard DFT and hybrid DFT, respectively at 0 GPa (25 GPa). Furthermore, we have performed an unbiased MC search for lowest enthalpy structures — at 0 and 25 GPa — using orthorhombic supercells of the TiSe2 structure (which is hexagonal in the primitive setting), commensurate with C2/m phase. Results of our search, which sampled over 60, 000 local minima, are illustrated in Fig. 6, where we observed that the layered TiSe2 structure remains the ground state across the full range of pressures investigated; the main data mined AX2 structures are rediscovered by the unbiased search; and a new type of metastable phase is predicted, which can be considered either as a defective layered structure, in which the layering pattern is regularly interrupted with Ti polyhedra displaced into the interlayer space connecting two adjacent layers,¶ or alternatively as “generalization” of the C2/m structure with the polyhedral units extended in one or two dimensions. The hypothetical pressure induced phase transformation may be, therefore, a result of stoichiometry changes and will be affected by impurities present in the experimental material. Our PSM IP model, however, would need to be extended to describe such effects. In this context, we also note the multitude of possible polytypes, which can be generated by different close packings of the Se-atom layers and different distributions of the Ti atoms over the octahedral holes. It is planned to employ the so-called PCAE (Primitive Cell approach for Atom Exchange) method51 to generate such structure candidates and explore their structural and electronic properties. A systematic investigation of the energy landscape of TiSe2 will be reported in the near future, where we hope to be able to answer this experimental challenge.
To further check the PSM IP reliability and performance outside of the fitting region, we have taken the lowest 1000 TiSe2 structures from the distribution shown in Fig. 6. This set includes structures with energies as far as 2.5 kT from the global minimum. The energy for the structures was calculated using DFTSP (single point DFT), and the correlation between IP and DFTSP energies is evident from Fig. 7. In general, we see an excellent agreement for structures up to 1.75 kT higher in energy than the global minimum with R2 values close to 0.9. We note that we compare the energies of alike structures instead of the ones fully optimised with each approach. Comparing the latter ones throws up more issues/aspects to consider, which are discussed in detail in, e.g., ref. 33. The greater energy dispersion at higher energies is due to the fact that the TiSe2 structures were randomly generated and have, most likely, no symmetry. They land, however, on parts of the energy landscape far away from the main basin and would be very difficult to access with conventional synthetic methods. Furthermore, the 1000 TiSe2 structures from the previous test have been fully DFT reoptimised and their energies calculated with our PSM IP (IPSP, optimisation of shells; ions and lattice constants are kept fixed). Thus, similar to above, we compare the energies (see Fig. 8) of alike structures, which in this case are the DFT optimised structures. In Fig. 8, we identified the structures with Se–Se distances (dSe–Se) shorter than 3.0![[thin space (1/6-em)]](https://www.rsc.org/images/entities/char_2009.gif) Å. This bonding cutoff criterion (which is also widely used in molecular mechanics modelling) was chosen as 1.2 times the Se covalent radii (1.22 Å), such as dSe–Se = 1.20 × 1.22 Å + 1.20 × 1.22 Å ≈ 3.0 Å. We have excluded those structures because there is a strong indication of Se–Se bonds and, therefore, a change of oxidation states. We emphasise that the current PSM IP model does not perform well for oxidation state changes. Without the “outliers”, there is an excellent agreement for structures up to 2 kT higher in energy than the global minimum with R2 values above 0.9.
Å. This bonding cutoff criterion (which is also widely used in molecular mechanics modelling) was chosen as 1.2 times the Se covalent radii (1.22 Å), such as dSe–Se = 1.20 × 1.22 Å + 1.20 × 1.22 Å ≈ 3.0 Å. We have excluded those structures because there is a strong indication of Se–Se bonds and, therefore, a change of oxidation states. We emphasise that the current PSM IP model does not perform well for oxidation state changes. Without the “outliers”, there is an excellent agreement for structures up to 2 kT higher in energy than the global minimum with R2 values above 0.9.
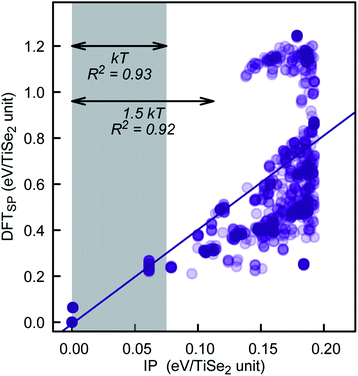 | ||
| Fig. 7 PSM IP and DFTSP energy comparison for the lowest 1000 PSM IP energy structures of our KLMC–MC approach. | ||
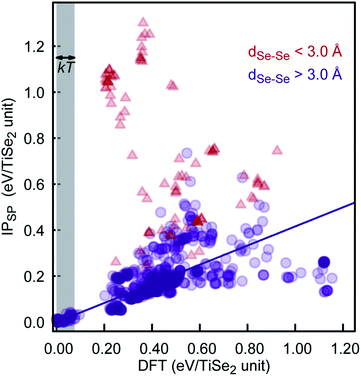 | ||
| Fig. 8 DFT and PSM IPSP energy comparison for the lowest 1000 DFT-optimised energy structures of our KLMC–MC approach. | ||
4 Conclusions
In summary, the new optimised TiSe2 PSM IP, presented in Table 1, performs well in reproducing the physical properties and crystal structure of the thermodynamically most stable polymorph. This new PSM IP is also applicable for other hypothetical polymorphs of TiSe2, showing that it should be capable of identifying low energy structure candidates via a global search or during long MD simulations, for a subsequent refinement on an ab initio level. Thus, this PSM IP constitutes both an accurate and globally applicable representation of the energy landscape of TiSe2, and could serve as a starting point for similar potentials to other layered quasi-2D compounds (e.g. Ti, Zr and Hf chalcogenides).Conflicts of interest
There are no conflicts to declare.Acknowledgements
We acknowledge funding provided by EPSRC under grant EP/P013503/1. Via our membership of the UK's HEC Materials Chemistry Consortium, which is funded by EPSRC (EP/L000202), this work used the UK Materials and Molecular Modelling Hub for computational resources, MMM Hub, which is partially funded by EPSRC (EP/P020194). The authors acknowledge the use of the UCL Grace High Performance Computing Facility (Grace@UCL), and associated support services, in the completion of this work. DMF thanks the Max Planck Institute for Solid State Research in Stuttgart for supporting a collaborative visit and work on the reported project. The authors thank David Bowler for helpful discussions.Notes and references
- A. Zunger and A. J. Freeman, Phys. Rev. B: Solid State, 1978, 17, 1839–1842 CrossRef CAS.
- J. A. Wilson, Phys. Status Solidi A, 1978, 86, 11–36 CrossRef CAS.
- J. A. Wilson, Solid State Commun., 1977, 22, 551–553 CrossRef CAS.
- H. P. Hughes, J. Phys. C: Solid State Phys., 1977, 10, L319–L323 CrossRef CAS.
- R. Z. Bachrach, M. Skibowski and F. C. Brown, Phys. Rev. Lett., 1976, 37, 40–42 CrossRef CAS.
- F. J. Di Salvo, D. E. Moncton and J. V. Waszczak, Phys. Rev. B: Solid State, 1976, 14, 4321–4328 CrossRef CAS.
- H. W. Myron and A. J. Freeman, Phys. Rev. B: Solid State, 1974, 9, 481–486 CrossRef CAS.
- D. L. Duong, M. Burghard and J. C. Schön, Phys. Rev. B: Condens. Matter Mater. Phys., 2015, 92, 245131 CrossRef.
- E. Morosan, H. W. Zandbergen, B. S. Dennis, J. W. G. Bos, Y. Onose, T. Klimczuk, A. P. Ramirez, N. P. Ong and R. J. Cava, Nat. Phys., 2006, 2, 544–550 Search PubMed.
- A. F. Kusmartseva, B. Sipos, H. Berger, L. Forró and E. Tutiš, Phys. Rev. Lett., 2009, 103, 236401 CrossRef CAS PubMed.
- L. J. Li, E. C. T. O'Farrell, K. P. Loh, G. Eda, B. Özyilmaz and A. H. Castro Neto, Nature, 2016, 529, 185–189 CrossRef CAS PubMed.
- Y. Takaoka and K. Motizuki, J. Phys. Soc. Jpn., 1980, 49, 1838–1844 CrossRef CAS.
- S. S. Jaswal, Phys. Rev. B: Solid State, 1979, 20, 5297–5300 CrossRef CAS.
- Y. Shibuta, K. Oguchi, T. Takaki and M. Ohno, Sci. Rep., 2015, 5, 13534 CrossRef CAS PubMed.
- M. L. Klein and W. Shinoda, Science, 2008, 321, 798–800 CrossRef CAS PubMed.
- K. Trachenko, J. Phys.: Condens. Matter, 2004, 16, R1491–R1515 CrossRef CAS.
- D. Mora-Fonz and A. L. Shluger, Phys. Rev. B, 2019, 99, 014202 CrossRef CAS.
- D. Mora-Fonz and A. L. Shluger, Adv. Electron. Mater., 2020, 6, 1900760 CrossRef CAS.
- J.-W. Jiang, H. S. Park and T. Rabczuk, J. Appl. Phys., 2013, 114, 064307 CrossRef.
- J.-W. Jiang, Nanotechnology, 2015, 26, 315706 CrossRef PubMed.
- A. V. Bandura, S. I. Lukyanov and R. A. Evarestov, Russ. J. Gen. Chem., 2018, 88, 2695–2697 CrossRef CAS.
- M. C. Nguyen, J.-H. Choi, X. Zhao, C.-Z. Wang, Z. Zhang and K.-M. Ho, Phys. Rev. Lett., 2013, 111, 165502 CrossRef PubMed.
- F. H. Stillinger and T. A. Weber, Phys. Rev. B: Condens. Matter Mater. Phys., 1985, 31, 5262–5271 CrossRef CAS PubMed.
- J. Tersoff, Phys. Rev. B: Condens. Matter Mater. Phys., 1988, 37, 6991–7000 CrossRef PubMed.
- J. Tersoff, Phys. Rev. B: Condens. Matter Mater. Phys., 1989, 39, 5566–5568 CrossRef PubMed.
- D. W. Brenner, O. A. Shenderova, J. A. Harrison, S. J. Stuart, B. Ni and S. B. Sinnott, J. Phys.: Condens. Matter, 2002, 14, 783–802 CrossRef CAS.
- J. D. Gale and A. L. Rohl, Mol. Simul., 2003, 29, 291–341 CrossRef CAS.
- J. D. Gale, J. Chem. Soc., Faraday Trans., 1997, 93, 629–637 RSC.
- J. A. Nelder and R. Mead, Computer Journal, 1965, 7, 308–313 CrossRef.
- S. M. Woodley, J. Phys. Chem. C, 2013, 117, 24003–24014 CrossRef CAS.
- M. R. Farrow, Y. Chow and S. M. Woodley, Phys. Chem. Chem. Phys., 2014, 16, 21119–21134 RSC.
- T. Lazauskas, A. A. Sokol and S. M. Woodley, Nanoscale, 2017, 9, 3850–3864 RSC.
- D. Mora-Fonz, T. Lazauskas, S. M. Woodley, S. T. Bromley, C. R. A. Catlow and A. A. Sokol, J. Phys. Chem. C, 2017, 121, 16831–16844 CrossRef CAS.
- T. Lazauskas, A. A. Sokol, J. Buckeridge, C. R. A. Catlow, S. G. E. T. Escher, M. R. Farrow, D. Mora-Fonz, V. W. Blum, T. M. Phaahla, H. R. Chauke, P. E. Ngoepe and S. M. Woodley, Phys. Chem. Chem. Phys., 2018, 20, 13962–13973 RSC.
- D. E. E. Deacon-Smith, D. O. Scanlon, C. R. A. Catlow, A. A. Sokol and S. M. Woodley, Adv. Mater., 2014, 26, 7252–7256 CrossRef CAS PubMed.
- J. P. Perdew, A. Ruzsinszky, G. I. Csonka, O. A. Vydrov, G. E. Scuseria, L. A. Constantin, X. Zhou and K. Burke, Phys. Rev. Lett., 2008, 100, 136406 CrossRef PubMed.
- P. E. Blöchl, Phys. Rev. B: Condens. Matter Mater. Phys., 1994, 50, 17953–17979 CrossRef PubMed.
- G. Kresse and D. Joubert, Phys. Rev. B: Condens. Matter Mater. Phys., 1999, 59, 1758–1775 CrossRef CAS.
- G. Kresse and J. Hafner, Phys. Rev. B: Condens. Matter Mater. Phys., 1994, 49, 14251–14269 CrossRef CAS PubMed.
- G. Kresse and J. Furthmüller, Comput. Mater. Sci., 1996, 6, 15–50 CrossRef CAS.
- G. Kresse and J. Hafner, Phys. Rev. B: Condens. Matter Mater. Phys., 1993, 47, 558–561 CrossRef CAS PubMed.
- G. Kresse and J. Furthmüller, Phys. Rev. B: Condens. Matter Mater. Phys., 1996, 54, 11169–11186 CrossRef CAS PubMed.
- J. C. Schön, H. Putz and M. Jansen, J. Phys.: Condens. Matter, 1996, 8, 143–156 CrossRef.
- S. Neelamraju, C. Oligschleger and J. C. Schön, J. Chem. Phys., 2017, 147, 152713 CrossRef PubMed.
- J. C. Schön, Process. Appl. Ceram., 2015, 9, 157–168 CrossRef.
- C. J. Heard, R. L. Johnston and J. C. Schön, ChemPhysChem, 2015, 16, 1461–1469 CrossRef CAS PubMed.
- V. Rajaji, S. Janaky, S. C. Sarma, S. C. Peter and C. Narayana, J. Phys.: Condens. Matter, 2019, 31, 165401 CrossRef CAS PubMed.
- V. Rajaji, U. Dutta, P. C. Sreeparvathy, S. C. Sarma, Y. A. Sorb, B. Joseph, S. Sahoo, S. C. Peter, V. Kanchana and C. Narayana, Phys. Rev. B, 2018, 97, 085107 CrossRef CAS.
- J. Léger, A. Pereira, J. Haines, S. Jobic and R. Brec, J. Phys. Chem. Solids, 2000, 61, 27–34 CrossRef.
- S. Neelamraju, J. C. Schön and M. Jansen, Inorg. Chem., 2015, 54, 782–791 CrossRef CAS PubMed.
- D. Zagorac, J. Zagorac, J. C. Schön, N. Stojanović and B. Matović, Acta Crystallogr., Sect. B: Struct. Sci., Cryst. Eng. Mater., 2018, 74, 628–642 CrossRef CAS.
Footnotes |
| † Electronic supplementary information (ESI) available. See DOI: 10.1039/d0ta03667f |
| ‡ In the case of, e.g. MD and Monte Carlo (MC) simulations, we also anticipate that two ions of the same species can be close to each other, and in that case it is indispensable to counteract the Coulomb attraction of oppositely charged species, i.e. usually the core of one ion and the shell of another. As the short-range potentials are automatically calculated for any pair, we should also exclude the double counting of interactions between the core and the shell of the same ion, which is normally described by a spring potential with a default cutoff of 0.8 Å in GULP. In our PSM IP, this is done by having Lennard-Jones potentials between cores and shells of the same species. For forcefields where both the shell and the core are similarly charged, there is no need to add this potential — such ions will be repelled from each other by the Coulomb interaction. |
| § Note, however, that in this work we avoid investigating topological states driven phase transitions related to the CDW phenomena in TiSe2. |
| ¶ Such structure elements have also been found in simulations of MgF2 film growth.50 |
| This journal is © The Royal Society of Chemistry 2020 |

