Novel MoSi2 catalysts featuring surface activation as highly efficient cathode materials for long-life Li–O2 batteries†
Congcong
Dang
 a,
Yu
Wang
a,
Biao
He
a,
Weibin
Zhang
a,
Feng
Dang
*a,
Hongchao
Wang
a,
Yu
Wang
a,
Biao
He
a,
Weibin
Zhang
a,
Feng
Dang
*a,
Hongchao
Wang
 *b and
Yong
Du
c
aKey Laboratory for Liquid-Solid Structural Evolution and Processing of Materials (Ministry of Education), Shandong University, 17923 Jingshi Road, Jinan 250061, China. E-mail: dangfeng@sdu.edu.cn
bSchool of Physics, State Key Laboratory of Crystal Materials, Shandong University, Jinan 250100, P. R. China. E-mail: wanghc@sdu.edu.cn
cState Key Laboratory of Powder Metallurgy, Central South University, Changsha, 410083, China
First published on 22nd November 2019
Abstract
Searching for highly efficient and low cost electrocatalysts is an urgent challenge to provide high capacity and long cycle life Li–O2 batteries (LOBs). In this work, the highly efficient electrocatalytic properties of MoSi2 were first demonstrated using particles prepared by a solid–state reaction method. The surface was activated, playing a dominant role in the electrocatalytic performance. After acid etching to remove SiO2 impurities arising from the surface oxidation, MoSi2 exhibited excellent bifunctional electrocatalytic properties for LOBs. Mo6+ on the surface contributed to the initial low overpotentials of 0.45 V (3.2 V for the OER and 2.75 V for the ORR) and transformed into Mo4+ for a long cycle life. As a consequence, outstanding rate capabilities of 12![[thin space (1/6-em)]](https://www.rsc.org/images/entities/char_2009.gif) 708 mA h g−1 at 100 mA g−1 and 10
708 mA h g−1 at 100 mA g−1 and 10![[thin space (1/6-em)]](https://www.rsc.org/images/entities/char_2009.gif) 794 mA h g−1 at 800 mA g−1, and excellent cycle durability of 215 and 90 cycles at a limited capacity of 1000 mA h g−1 at 200 and 500 mA g−1, respectively, were obtained for the MoSi2 cathode.
794 mA h g−1 at 800 mA g−1, and excellent cycle durability of 215 and 90 cycles at a limited capacity of 1000 mA h g−1 at 200 and 500 mA g−1, respectively, were obtained for the MoSi2 cathode.
Introduction
Li–O2 batteries (LOBs), because of the potential large energy density of 3500 W h kg−1, make themselves recognized candidates for the next generation of energy storage. Li–O2 batteries mainly rely on the reversible oxygen evolution reaction (OER) and oxygen reduction reaction (ORR) on the cathode to achieve a charge/discharge process. Owing to the sluggish reaction kinetics, the incomplete decomposition of the discharge product Li2O2 and the formation of by-products lead to the increase of overpotentials, depressed round-trip efficiency, side reactions and the decomposition of electrolyte, and are attributed to the degradation of LOBs.1,2 To tackle these problems, intensive efforts have been made to explore catalytic materials possessing outstanding electro–catalytic activity. Carbon materials with a superior electric conductivity and designed functional structure were firstly used to catalyze the electrode reaction and achieved an innovative breakthrough in improving the performance of LOBs.3,4 However, carbon materials are unstable and oxidize in the discharging process. A side reaction occurs above 3.5 V during charging and forms Li2CO3, which causes a reduction in active substances and the production of by-products, reducing the reversibility and cyclic performance of the Li–O2 battery. Moreover, the carbon materials promote the decomposition of the electrolyte (especially the widely used dimethyl sulfoxide (DMSO) and tetraethylene glycol dimethyl ether (TEGDME) electrolytes) during the charging process and produces by-products resulting in an increase of the overpotential decay of the capacity and reduction of the cyclic performance.5,6 It's essential to develop an alternative catalyst for the Li–O2 battery which could improve the OER or ORR process. Many efforts have been made to explore catalytic materials for LOBs, and only limited materials, such as precious metals, metal alloys, metal oxides, and porous metal carbides, exhibit outstanding catalytic capabilities.7–10 Searching for outstanding catalytic materials with low overpotentials and stable cycle durability is still the most important challenge for LOBs.Up to now, no works have reported the catalytic capability of silicide for LOBs, even though they possess a relative narrow band gap, good electric conductivity and high catalytic performance.11,12 In the current contribution, we selected molybdenum disilicide (MoSi2) as the cathode material and demonstrated the outstanding electrocatalytic capability of MoSi2 for LOBs. MoSi2 is a Dalton-type intermetallic compound, and the atomic combination in the crystal structure exhibits the characteristics of the coexistence of metal bonds and covalent bonds,13,14 and has excellent high-temperature essential characteristics. Due to its excellent oxidation and corrosion resistance, MoSi2 has been applied as a structural material, electric heating element and protection coating.15–17 Its high electric conductivity, narrow band gap and chemical stability are thought to be suitable as the catalytic materials for LOBs. Meanwhile, the surface oxidation of MoSi2 (MoSi2 + O2 → MoO3 + SiO2) restricts its electrocatalytic performance in LOBs, in which the SiO2 impurity is inactive for the ORR and OER processes in LOBs. Furthermore, high purity MoSi2 powder is difficult to be prepare as the SiO2 almost exists as an impurity in the synthesized MoSi2 particles.
In this work, high purity MoSi2 is prepared from a solid–state reaction method in a large scale following an acid etching process to delete the impurities. The catalytic characteristics of MoSi2 as a cathode material for LOBs were investigated.
MoSi2, as a bifunctional catalyst, can effectively catalyze both ORR and OER and remain stable during the electrochemical process. The discharge/charge evolution during cycling protected the surface oxidation of MoSi2 for an excellent cycling durability. The low overpotentials in the charge/discharge process is found to be dominated by the surface condition of the Mo ion. As a consequence, the MoSi2 electrode catalyst exhibited a remarkable electrochemical performance in terms of the low overpotentials of 0.45 V (cut-off voltage of 1000 mA h g−1 at 200 mA g−1), outstanding rate capability (12![[thin space (1/6-em)]](https://www.rsc.org/images/entities/char_2009.gif) 708 mA h g−1 at 100 mA g−1 and 10
708 mA h g−1 at 100 mA g−1 and 10![[thin space (1/6-em)]](https://www.rsc.org/images/entities/char_2009.gif) 794 mA h g−1 at 800 mA g−1), and excellent cycle durability (215 cycles at the limited capacity of 1000 mA h g−1 with a current of 200 mA g−1).
794 mA h g−1 at 800 mA g−1), and excellent cycle durability (215 cycles at the limited capacity of 1000 mA h g−1 with a current of 200 mA g−1).
Experimental section
Material preparation
In the typical solid reaction process, 18 g of MoO2 (99% purity, Aladdin Chemistry Co. Ltd.) and 12 g Si of powder (99.9% purity, Sinopharm Chemical Reagent Co. Ltd.) were weighed and put into a mill pot with 1 ml of ethyl alcohol and ZrO2 balls. Of these, ethyl alcohol was used as the solvent while the ZrO2 balls were used as the grinding medium. The ratio of balls and powder was 20![[thin space (1/6-em)]](https://www.rsc.org/images/entities/char_2009.gif) :
:![[thin space (1/6-em)]](https://www.rsc.org/images/entities/char_2009.gif) 1 and the rotating speed was 200 rpm. Ar was filled into the grinding jar as the protecting atmosphere. After mixing and grinding for 8 hours, the mixture was put in the oven for 8 hours at a temperature of 80 °C to remove the solvent. After drying, the powder was filtrated through a 60 mesh sieve to get a fine material. Then, the material was sintered at a heating rate of 10 °C min from room temperature to 1400 °C and kept at 1400 °C for 60 minutes. All the sintering process was conducted under an argon atmosphere. After sintering, the as-prepared MoSi2 was obtained. In order to get purer MoSi2, the powder was etched by hydrofluoric acid for 6 hours to remove the by-product SiO2. And then, the etched MoSi2 was cleaned by deionized water twice and then put in the oven at 80 °C for 12 h to remove the water.
1 and the rotating speed was 200 rpm. Ar was filled into the grinding jar as the protecting atmosphere. After mixing and grinding for 8 hours, the mixture was put in the oven for 8 hours at a temperature of 80 °C to remove the solvent. After drying, the powder was filtrated through a 60 mesh sieve to get a fine material. Then, the material was sintered at a heating rate of 10 °C min from room temperature to 1400 °C and kept at 1400 °C for 60 minutes. All the sintering process was conducted under an argon atmosphere. After sintering, the as-prepared MoSi2 was obtained. In order to get purer MoSi2, the powder was etched by hydrofluoric acid for 6 hours to remove the by-product SiO2. And then, the etched MoSi2 was cleaned by deionized water twice and then put in the oven at 80 °C for 12 h to remove the water.
Material characterization
The morphology of the material was characterized by a field scanning electron microscope (JEOL JSM-7500F) with an X-ray energy dispersive spectrometer (EDS). To observe the shape and microstructure of the material more clearly, TEM and HRTEM images were obtained by a transmission electron microscope (JEOL JEM-2011). The X-ray diffraction pattern (XRD) was tested to determine the phase composition by means of an X-ray diffractometer (Rigaku D/Max-r B) with Cu-Kα (λ = 1.540 Å) radiation with a voltage of 40 kV and a current of 40 mA. Raman spectra were obtained to determine the composition and molecular structure by a Bruker spectrometer with a laser of 532 nm. X-ray photoelectron spectroscopy (XPS, ESCALAB 250XI) was also used to determine the chemical composition of the sample.Electrochemical measurement
First, the as-prepared catalyst accompanied with Ketjenblack and poly(tetrafluoroethylene) were mixed at a mass ratio of 4![[thin space (1/6-em)]](https://www.rsc.org/images/entities/char_2009.gif) :
:![[thin space (1/6-em)]](https://www.rsc.org/images/entities/char_2009.gif) 4
4![[thin space (1/6-em)]](https://www.rsc.org/images/entities/char_2009.gif) :
:![[thin space (1/6-em)]](https://www.rsc.org/images/entities/char_2009.gif) 2, and then 3 ml of isopropanol was added as the solvent. Ultrasonic techniques were used to spread the solution evenly. Then, the solution was distributed into carbon paper evenly. Each time, 10 mg of catalyst, 10 mg of Ketjenblack and 5 mg of poly(tetrafluoroethylene) were weighed, and spread over 10 cathodes uniformly. The average mass of the catalyst in each cathode was about 1 mg. To remove isopropanol, the carbon paper was put into a vacuum oven for 12 hours. The difference in weight of the carbon paper before and after adding the solution was recorded to calculate the mass of the active catalyst. All the batteries were assembled in a glove box which was occupied with Ar (H2O < 0.1 ppm, O2 < 0.1 ppm). An integrated cell contained the Li anode, a glassy fiber separator, electrolyte, and catalyst attached to the cathode. In this work, the electrolyte was 1 M lithium bis(trifluoromethanesulfonyl) in triethylene glycol dimethyl ether (LiTFSI/TEGDME). The electrochemical performance was studied using an electrochemical workstation (PARSTAT MC). All the batteries were sealed in an oxygen filled bottle during each electrochemical measurement.
2, and then 3 ml of isopropanol was added as the solvent. Ultrasonic techniques were used to spread the solution evenly. Then, the solution was distributed into carbon paper evenly. Each time, 10 mg of catalyst, 10 mg of Ketjenblack and 5 mg of poly(tetrafluoroethylene) were weighed, and spread over 10 cathodes uniformly. The average mass of the catalyst in each cathode was about 1 mg. To remove isopropanol, the carbon paper was put into a vacuum oven for 12 hours. The difference in weight of the carbon paper before and after adding the solution was recorded to calculate the mass of the active catalyst. All the batteries were assembled in a glove box which was occupied with Ar (H2O < 0.1 ppm, O2 < 0.1 ppm). An integrated cell contained the Li anode, a glassy fiber separator, electrolyte, and catalyst attached to the cathode. In this work, the electrolyte was 1 M lithium bis(trifluoromethanesulfonyl) in triethylene glycol dimethyl ether (LiTFSI/TEGDME). The electrochemical performance was studied using an electrochemical workstation (PARSTAT MC). All the batteries were sealed in an oxygen filled bottle during each electrochemical measurement.
Result and discussion
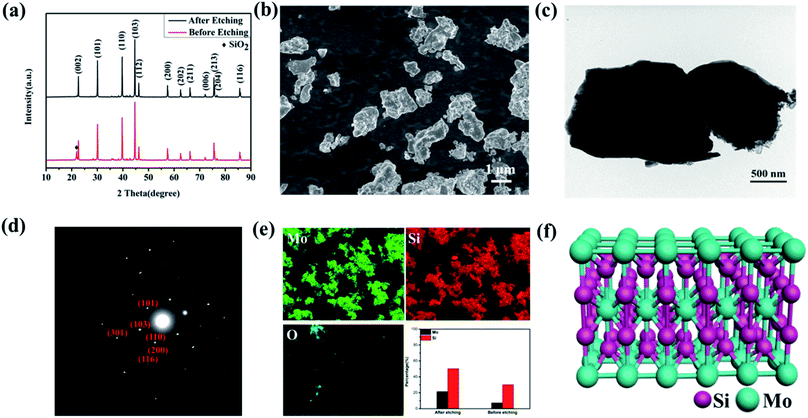
The MoSi2 powder was synthesized through a solid–state reaction method. Si and MoO2 powder were firstly ground for 8 h, and then sintered under an Ar atmosphere for 1 h. To eliminate the SiO2 impurity, the as prepared MoSi2 powder was etched in 1 M HF solution for 6 hours. X-ray diffraction (XRD) was used to investigate the crystalline structure of the MoSi2 particles. Fig. 1a shows the XRD pattern of MoSi2 particles before and after acid etching. The diffraction peaks at 22.65, 30.10, 39.74, 44.68, 75.59° matched well to the (002), (101), (110), (103) and (213) planes of MoSi2 (PDF#41-0612). For the MoSi2 particles before acid etching, a diffraction peak of SiO2 at 21.98° (PDF#39-1425) was detected, which indicated the existence of an SiO2 impurity. The SiO2 impurity will degrade the catalytic performance of MoSi2.A morphological observation was also carried out to identify the shape of MoSi2 particles. As shown in Fig. 1b and c, the MoSi2 particles showed an irregular morphology with a particle size that ranged from 500 nm to 2 μm. The diffraction spots in the selected area electron diffraction (SAED) patterns were identified as the (101), (110), (103), (200), (116) and (301) planes of the MoSi2 particles, consistent with the XRD pattern. The EDS analysis shown in Fig. 1e indicated that the Mo/Si molar ratio was about 1![[thin space (1/6-em)]](https://www.rsc.org/images/entities/char_2009.gif) :
:![[thin space (1/6-em)]](https://www.rsc.org/images/entities/char_2009.gif) 2 in the acid etched MoSi2 particles, meanwhile, the Mo/Si molar ratio was only about 1
2 in the acid etched MoSi2 particles, meanwhile, the Mo/Si molar ratio was only about 1![[thin space (1/6-em)]](https://www.rsc.org/images/entities/char_2009.gif) :
:![[thin space (1/6-em)]](https://www.rsc.org/images/entities/char_2009.gif) 3 for the MoSi2 particles before acid etching, which indicated the existence of SiO2 impurities. The element mapping showed that Mo and Si elements were uniformly distributed in the MoSi2 particles and almost no signal of the O element was detected. The element mapping of MoSi2 without acid etching was also investigated (Fig. S1†). As shown in Fig. 1f, MoSi2 is determined as a body-centered tetragonal phase18,19 (I4/mmm, a = 3.2 Å, b = 3.2 Å, c = 7.8 Å). The bonds between the Si atoms are covalent bonds, Mo–Mo bonds are metal bonds, while Mo–Si bonds are between covalent bonds and metal bonds. Thus, the crystal structure has the common characteristics of metal bonds and covalent bonds, which subsequently makes MoSi2 have the dual characteristics of ceramics and metals.
3 for the MoSi2 particles before acid etching, which indicated the existence of SiO2 impurities. The element mapping showed that Mo and Si elements were uniformly distributed in the MoSi2 particles and almost no signal of the O element was detected. The element mapping of MoSi2 without acid etching was also investigated (Fig. S1†). As shown in Fig. 1f, MoSi2 is determined as a body-centered tetragonal phase18,19 (I4/mmm, a = 3.2 Å, b = 3.2 Å, c = 7.8 Å). The bonds between the Si atoms are covalent bonds, Mo–Mo bonds are metal bonds, while Mo–Si bonds are between covalent bonds and metal bonds. Thus, the crystal structure has the common characteristics of metal bonds and covalent bonds, which subsequently makes MoSi2 have the dual characteristics of ceramics and metals.
To further investigate the crystalline structure and the surface elemental composition, Raman spectra and X-ray photoelectron spectroscopic (XPS) measurements were performed. Raman spectra are shown in Fig. S2.† The vibration peaks located at 324 and 434 cm−1 correspond to the A1g and Eg modes of MoSi2 and no other vibration peaks were detected, which indicates the formation of the pure phase of tetragonal MoSi2.20 Surface composition and the valence state of the MoSi2 particles were identified by XPS analysis and are shown in Fig. 2a–c. The presence of the Mo, Si and O elements is confirmed in Fig. S3.† In the high resolution XPS spectrum of Mo 3d (Fig. 2a), the Mo 2d3/2 and Mo 2d5/2 peaks are located at binding energies of 231 and 227 eV, respectively, representing Mo4+ in the MoSi2 lattice. The binding energy peak of 234.5 eV represents the existence of Mo6+.21–23 In the high resolution XPS spectrum of Si 2p (Fig. 2b), the banding energy peak at 97.5 eV can be attributed to the Mo–Si bond while the other peak at 100 eV is associated with the Si–Si bond, which suggests that SiO2 impurities were totally removed after acid etching.24,25 In the high resolution XPS spectrum of O 1s (Fig. 2c), the fitting peak at 529 eV is assigned to the Mo–O bond, which confirmed the existence of MoO3, and the peak at 531.9 eV is attributed to the existence of physically and chemically bonded water on the surface.26,27 The pore size distribution and specific surface area were measured by BET N2 adsorption/desorption. The N2 adsorption/desorption curves show the typical features of a type IV isotherm with a H3-type hysteresis loop,28–31 and the specific surface area was calculated to be 1.771 m2 g−1. From Fig. 2d, the pore size of the MoSi2 material was concentrated at 2.8 nm. The presence of mesopores is thought to be caused by acid etching, and is beneficial for the transition of oxygen and Li+, but also provides numerous active sites for the formation of discharge products. The pore size distribution and N2 adsorption/desorption curves of MoSi2 before acid etching are shown in Fig. S4.† The surface area of the un-etched MoSi2 was 1.916 m2 g−1, which is similar to that of acid etched MoSi2. On the other hand, the pore size concentrated at 4.6 and 9.8 nm, respectively. After acid etching, the pore size distribution of MoSi2 moved to a smaller size.
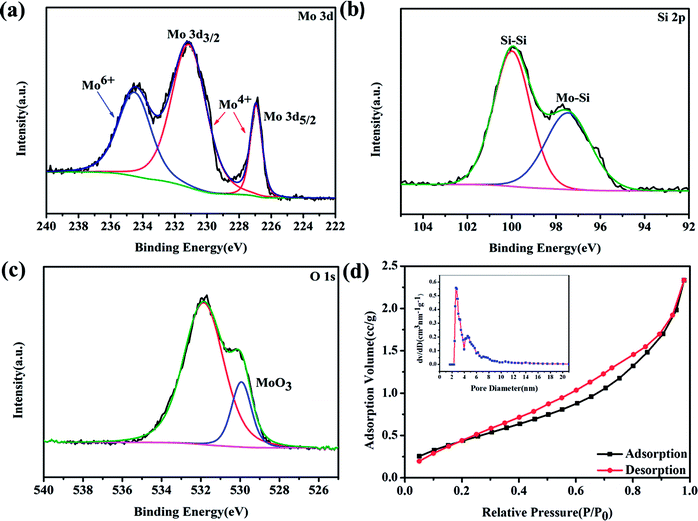 | ||
| Fig. 2 High-resolution XPS spectra of etched MoSi2 particles: (a) Mo 3d, (b) Si 2p, and (c) O 1s. (d) The pore size distribution and N2 adsorption/desorption isotherms of the MoSi2 particles. | ||
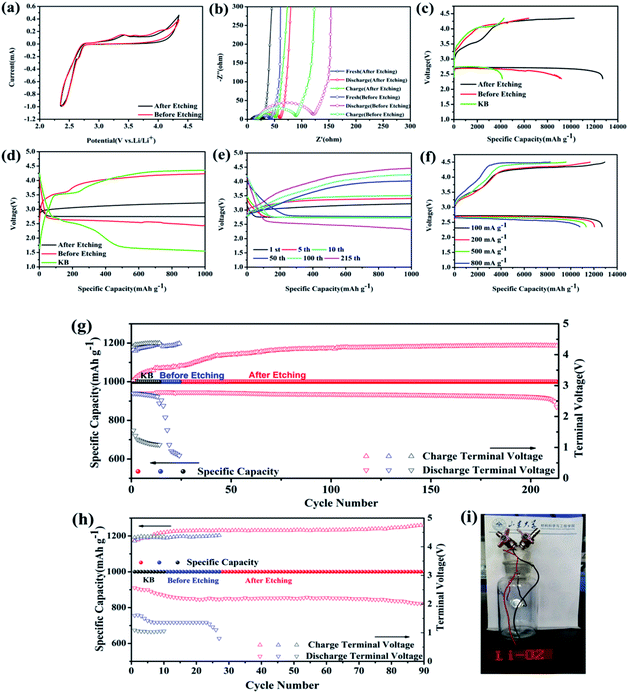
Fig. 3a shows the CV curves of MoSi2 particles before and after acid etching as electrodes between cut-off voltages of 2.35 V to 4.35 V for Li–O2 batteries. For the MoSi2 particles after acid etching, a reduction peak at 2.63 V and one oxidation peak at 3.44 V were observed, which brought out a stable electrochemical reaction platform. For the MoSi2 particles before acid etching, two reduction peaks at 3.4 V and 4.0 V were observed. The MoSi2 electrode exhibited larger cathodic and anodic current values, which indicated that the MoSi2 particles displayed a better catalytic capability in electrode reactions, especially the OER process, after acid etching.32 EIS was also used to measure the catalytic performance of two samples. The charge transfer resistance was evaluated by the diameter of the middle frequency depressed semicircle.33 As shown in Fig. 3b, the charge transfer resistance reduced from 30 Ω to 20 Ω after acid etching. It can be concluded that the conductivity of the MoSi2 particles increased and more MoSi2 active sites were exposed after removing the insulating SiO2 impurities. The EIS of batteries which use MoSi2 as the cathode catalyst were also tested after the discharge and recharge process. The charge-transfer resistance of the two batteries increased significantly after discharging. After recharging, the diameter of the EIS curve of acid etched MoSi2 decreased to 37 Ω, while that of un-etched MoSi2 remained 75 Ω. It can be concluded that the MoSi2 particles conducted a better reversibility after acid etching.
As shown in Fig. 3c, the first discharge capacity of the MoSi2 cathode after acid etching delivered extra-high specific capacities of 12![[thin space (1/6-em)]](https://www.rsc.org/images/entities/char_2009.gif) 708 mA h g−1 with a cut-off voltage window of 2.35 to 4.35 V at 100 mA g−1, calculated based on the mass of MoSi2 on the electrode, which was obviously higher than that of the particles before acid etching and of KB, 9186 and 4136 mA h g−1, respectively. The MoSi2 particles after acid etching showed an enhanced catalytic activity towards OER in LOBs with two charge platforms of 3.5 V and 4.2 V, respectively, at the first galvanostatic discharge/charge cycle, compared with that of KB (overpotential of 1.78 V). These results indicated that the impurity of SiO2 in MoSi2 particles degraded its catalytic performance for LOBs. The first charge/discharge curves, at a fixed capacity of 1000 mA h g−1 and a 200 mA g−1 current, of the MoSi2 particles are also shown in Fig. 3d. The MoSi2 particles after acid etching showed an enhanced activity towards ORR and OER in the LOBs since the charge/discharge potential was only 3.2 V and 2.75 V, respectively, with overpotentials of 0.24 V and 0.21 V at the first charge/discharge cycle, compared with that of KB (overpotentials of 2.72 V) and un-etched MoSi2 electrode (overpotentials of 1.42 V).
708 mA h g−1 with a cut-off voltage window of 2.35 to 4.35 V at 100 mA g−1, calculated based on the mass of MoSi2 on the electrode, which was obviously higher than that of the particles before acid etching and of KB, 9186 and 4136 mA h g−1, respectively. The MoSi2 particles after acid etching showed an enhanced catalytic activity towards OER in LOBs with two charge platforms of 3.5 V and 4.2 V, respectively, at the first galvanostatic discharge/charge cycle, compared with that of KB (overpotential of 1.78 V). These results indicated that the impurity of SiO2 in MoSi2 particles degraded its catalytic performance for LOBs. The first charge/discharge curves, at a fixed capacity of 1000 mA h g−1 and a 200 mA g−1 current, of the MoSi2 particles are also shown in Fig. 3d. The MoSi2 particles after acid etching showed an enhanced activity towards ORR and OER in the LOBs since the charge/discharge potential was only 3.2 V and 2.75 V, respectively, with overpotentials of 0.24 V and 0.21 V at the first charge/discharge cycle, compared with that of KB (overpotentials of 2.72 V) and un-etched MoSi2 electrode (overpotentials of 1.42 V).
The cyclic stability was examined at a current density of 200 mA g−1 with a fixed capacity of 1000 mA h g−1 and is shown in Fig. 3e. It is worth noting that the charge potentials changed largely in the first 5 cycles, in which the charge potentials increased from 3.2 to 3.4 V, and then increased slowly in the following cycle testing. The MoSi2 electrode obtained an excellent cycle stability and maintained the capacity for almost 215 cycles. The terminal discharge/charge voltage (Fig. 3g) remained at 2.56 V and 4.29 V, respectively, which showed an excellent cycle durability and low over potentials after 215 cycles. This result is connected with the surface condition of MoSi2, which is introduced in the following parts. In the same testing condition, the discharge platform of un-etched MoSi2 electrode decreased to just 0.7 V after 24 cycles and that of the KB electrode decreased to 1 V after 14 cycles. When the MoSi2 electrode was measured at a high current density of 500 mA g−1 with a fixed capacity of 1000 mA h g−1, it can still maintain the capacity for 90 cycles with discharge/charge potentials of 2 V and 4.9 V (Fig. 3h). Under a fixed capacity of 600 mA h g−1 at a current of 100 mA g−1, the MoSi2 electrode could maintain the capacity for almost 270 cycles (Fig. S5†). Even after 270 cycles, the overpotential still maintained 2.05 V with a charge voltage of 4.31 V and discharge voltage of 2.26 V. Whereas, the MoSi2 electrode before acid etching could only maintain the discharge voltage above 2.0 V for less than 140 cycles, and for KB, the voltage dropped to 1.5 V at the 15th cycle, suggesting that the acid etched MoSi2 electrode possesses a much better stability and reversibility. Fig. 3i displays a photograph which records a working light-emitting diode powered by a Li–O2 battery utilizing MoSi2 as the electrode. Typical discharge/charge profiles of un-etched MoSi2 and KB electrode under different current densities and cut-off specific capacities is displayed in Fig. S7 and S8,† respectively.
The rate capability was tested for the MoSi2 particles after acid etching with a cut-off voltage window of 2.35-4.5 V at different currents, as shown in Fig. 3f. The discharge capacity decrease accompanied by the charge/discharge polarization at a high current density can be ascribed to the increase of the internal charge transfer resistance of the LOBs. Meanwhile, impressive specific capacities of 12![[thin space (1/6-em)]](https://www.rsc.org/images/entities/char_2009.gif) 048 mA h g−1, 11
048 mA h g−1, 11![[thin space (1/6-em)]](https://www.rsc.org/images/entities/char_2009.gif) 336 mA h g−1, and 10
336 mA h g−1, and 10![[thin space (1/6-em)]](https://www.rsc.org/images/entities/char_2009.gif) 794 mA h g−1 can be still obtained by the MoSi2 electrode at high current densities of 200 mA g−1, 500 mA g−1 and 800 mA g−1, respectively, while the results MoSi2 of without acid etching were not close to those of the MoSi2 electrode, as recorded in Fig. S7d,† indicating the significant advantage of the high rate capability of MoSi2 materials.
794 mA h g−1 can be still obtained by the MoSi2 electrode at high current densities of 200 mA g−1, 500 mA g−1 and 800 mA g−1, respectively, while the results MoSi2 of without acid etching were not close to those of the MoSi2 electrode, as recorded in Fig. S7d,† indicating the significant advantage of the high rate capability of MoSi2 materials.
The charge process of the MoSi2 electrode was further investigated by in situ differential electrochemical mass spectrometry (DEMS) to reveal the evolution of gas species. The cell was performed under a current density of 500 mA g−1 with a fixed capacity of 500 mA h g−1. The gas analysis curves of the O2, H2O and CO2 evolution rates for the charging process are presented along with the galvanostatic charge voltage profile in Fig. 4. The plot of the O2 evolution rate can be divided into three stages and presented a typical M-shape.34–36 In Stage I, the O2 gas was quickly released, and then decreased with the increase of charge voltage at stage II. This process was attributed to the fast decomposition of defective the Li2−xO2 phase at a low charge potential.37 When the charge voltage reached approximately 4.2 V, the O2 evolution rate gradually rose again accompanied with a stable charge voltage platform. This result can be attributed to the crystalline Li2O2 clusters or particles which decomposed at a higher voltage during charging. The DEMS results indicated that the discharge product was a mixture of nonstoichiometric amorphous Li2−xO2 and crystalline Li2O2 phases. It is worth noting that there is no release of H2O during charge process, indicating a brilliant reversibility and cycle performance of the MoSi2 electrode. A small amount of CO2 was observed at the end of charging. This unexpected product may be caused by the inevitable side reaction between carbon and electrochemically unstable electrolyte.38,39
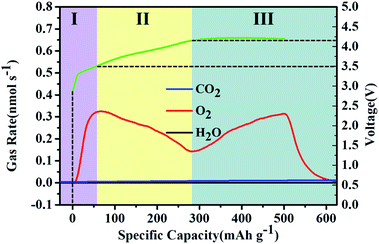 | ||
| Fig. 4 In situ DEMS curves of the MoSi2 catalyst, which were collected during the charging process at a fixed specific capacity of 500 mA h g−1 at a current of 500 mA g−1. | ||
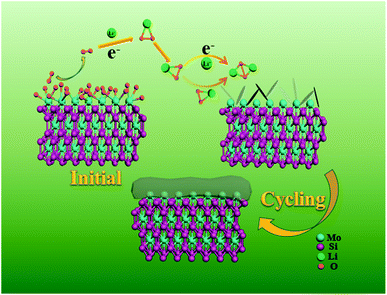
Aiming at exploring the discharge and charge process clearly, the morphology and components of the discharged cathode were also tested. Fig. 5a is the SEM image of the fresh cathode, and only some particles can be observed. But after full discharge, a thick Li2O2 film covers the surface of the particles (Fig. 5b). The initial discharge product was also monitored when discharged at 100 mA h g−1 and shown in Fig. S9.† A sheet-like discharge product was observed on the surface of the MoSi2 particles. The formation of a sheet-like discharge product was beneficial to the mass transition and indicated a solvation-mediated growth mechanism of Li2O2 in the initial discharge stage.40,41 O2 underwent a one-electron reduction to O2− on the surface of the catalyst, and then dissolved into the electrolyte. O2− combined with Li+ in the solution to form the intermediate LiO2 which was partially adsorbed to the surface of the electrode (LiO2sur).42Scheme 1 illustrates the mechanism for the electrocatalytic reactions during the discharge progress. After recharge, the film disappeared and the morphology was similar to that of the fresh cathode (Fig. 5c). Fig. S10† shows the SEM image of the MoSi2 electrode after 40 cycles. No morphology change or non-decomposed discharge product was observed on the surface of the MoSi2 particles, indicating the smooth decomposition of Li2O2 during cycling. The crystalline nature of the discharge products was analyzed using XRD measurements, and Fig. 5d displays the XRD pattern of the three cathodes. It can be seen that the peaks of the fresh cathode are similar to those of the recharged cathode. Compared to them, the discharged cathode has two peaks which are assigned to the (100) and (101) planes of Li2O2, and the results are totally consistent with the SEM test. Furthermore, the XPS test was also conducted to analyze the discharge product. Fig. S11a† manifests that the pattern of Li 1s can be divided into only one peak located at 55.4 eV, and it represent the existence of Li2O2. Besides, the EIS was measured to analyze the electronic transmission capability of the Li–O2 battery. From Fig. S11b,† the electrochemical impedance is quite low, but after a CV test, the impedance improved greatly. This implies that the electrochemical reaction can produce an insulating product which impedes the transition of the electron inside the battery.
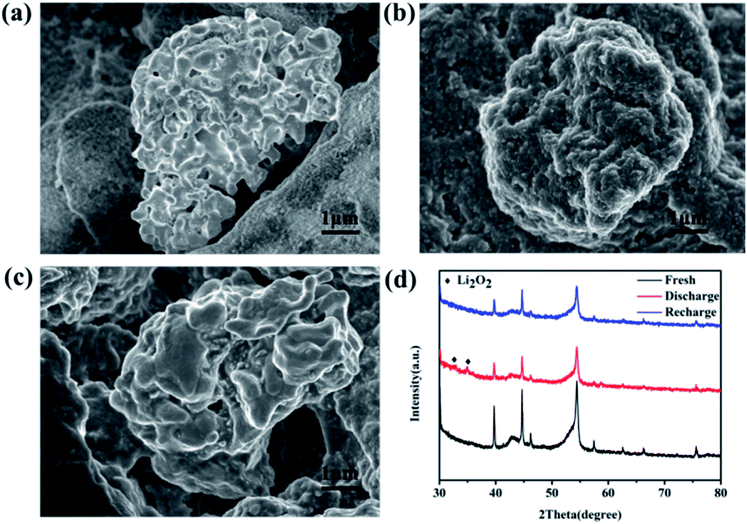 | ||
| Fig. 5 SEM images of (a) a fresh cathode, (b) a discharged cathode, and (c) a recharged cathode. (d) XRD patterns of the MoSi2 cathode: fresh, discharged, and recharged. | ||
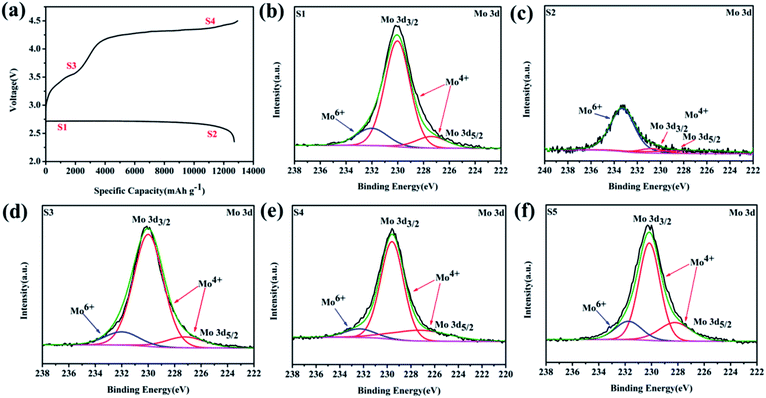
To investigate the reaction mechanism, ex situ XPS was further conducted to explore the detailed surface states of the MoSi2 electrode during a full-charge/discharge progress at a current density of 100 mA g−1, as presented in Fig. 6b–e, in accordance with states 1–4 in Fig. 6a. The Mo 3d XPS spectra can be deconvoluted into three peaks which indicated that the two major peaks of 3d3/2 (231 eV) and 3d5/2 (227 eV) are associated with Mo4+ while the peak at the high energy region (234.5 eV) can be attributed to Mo6+.43–45 Compared to the pristine MoSi2 particles (Fig. 2c), the intensity of Mo6+ decreased largely at the first state (Fig. 6b). Due to the formation of a thick Li2O2 layer, only weak peaks corresponding to Mo6+ and Mo4+ were detected in state 2 (Fig. 6c). In contrast, after recharging to the cut-off voltage of 3.6 V (state 3), the peak intensity of Mo4+ significantly increased, and the XPS of Mo 3d showed approximately the same Mo6+/Mo4+ intensity ratio compared with that in the fresh cathode at the end of fully charge (state 4).
The elevating concentration of Mo4+ during charging was resulted from the constant decomposition of the discharge product on the cathode surface and thus more Mo4+ active sites were released. The high resolution XPS of Mo 3d after 10 cycles (with a fixed specific capacity of 1000 mA h g−1 at a current of 200 mA g−1), which corresponds to the selected state in Fig. S12,† was also investigated (Fig. 6f). It was apparent that the concentration of Mo6+ decreased compared to the initial particles even in the cycle testing.
It has been reported that Mo6+ has good OER catalytic capabilities and could significantly decreased the overpotentials in the ORR/OER process in LOBs.46 These results indicated that Mo4+ was the main valence state for MoSi2 during the charge/discharge process of LOBs. The consumption of Mo6+ in the initial discharge/charge cycle may be the cause of the gradual increase in charge potential during the start of several cycles, as introduced in Fig. 3e. The high resolution XPS spectra of Si 2p was also investigated (Fig. S13†); the peaks show almost no change, which indicated the outstanding stability of MoSi2 catalyst.
Conclusions
In summary, MoSi2 exhibited superior electrocatalytic performance as a cathode material for LOBs with acid etching removing the SiO2 impurities. The acid etched MoSi2 electrode obtained had a large discharge capacity, high rate capability and excellent cycle performance with low overpotentials. It can be concluded that the SiO2 impurities are harmful to the improvement of the electrocatalytic performance of MoSi2. The surface condition of MoSi2 had a large influence on its electrocatalytic performance. A high concentration of Mo6+ decreased the overpotentials of MoSi2; meanwhile, Mo4+ was the main valence state of MoSi2 during cycling. In this work, we firstly demonstrated that silicide-based materials can demonstrate excellent electrocatalytic capabilities for LOBs and provide a practical way to find novel high performance cathode materials for LOBs.Conflicts of interest
There are no conflicts to declare.Acknowledgements
This work was supported by the National Key R&D Program of China of 2017YFE0195200, Open Program of Tsinghua University State Key Laboratory of New Ceramic and Fine Processing (KF201814, KF201805), Open Program of Guangxi Key Laboratory of Information Materials (171002-K) and the China Scholarship Council.Notes and references
- L. Ma, T. Yu, E. Tzoganakis, K. Amine, T. Wu, Z. Chen and J. Lu, Adv. Energy Mater., 2018, 8, 1800348 CrossRef.
- Y. Hou, J. Wang, J. Liu, C. Hou, Z. Xiu, Y. Fan, L. Zhao, Y. Zhai, H. Li, J. Zeng, X. Gao, S. Zhou, D. Li, Y. Li, F. Dang, K. Liang, P. Chen, C. Li, D. Zhao and B. Kong, Adv. Energy Mater., 2019, 1901751, DOI:10.1002/aenm.201901751.
- S. D. Beattie, D. M. Manolescu and S. L. Blair, J. Electrochem. Soc., 2009, 156, A44 CrossRef CAS.
- B. M. Gallant, R. R. Mitchell, D. G. Kwabi, J. Zhou, L. Zuin, C. V. Thompson and Y. Shao-Horn, J. Phys. Chem. C, 2012, 116, 20800–20805 CrossRef CAS.
- M. M. Ottakam Thotiyl, S. A. Freunberger, Z. Peng and P. G. Bruce, J. Am. Chem. Soc., 2013, 135, 494–500 CrossRef CAS PubMed.
- M. Balaish, J.-W. Jung, I.-D. Kim and Y. Ein-Eli, Adv. Funct. Mater., 2019, 1808303, DOI:10.1002/adfm.201808303.
- S. Ma, Y. Wu, J. Wang, Y. Zhang, Y. Zhang, X. Yan, Y. Wei, P. Liu, J. Wang, K. Jiang, S. Fan, Y. Xu and Z. Peng, Nano Lett., 2015, 15, 8084–8090 CrossRef CAS.
- J. Huang, B. Zhang, Y. Y. Xie, W. W. K. Lye, Z.-L. Xu, S. Abouali, M. Akbari Garakani, J.-Q. Huang, T.-Y. Zhang, B. Huang and J.-K. Kim, Carbon, 2016, 100, 329–336 CrossRef CAS.
- Q. Liu, Y. Jiang, J. Xu, D. Xu, Z. Chang, Y. Yin, W. Liu and X. Zhang, Nano Res., 2014, 8, 576–583 CrossRef.
- G. Sun, Q. Zhao, T. Wu, W. Lu, M. Bao, L. Sun, H. Xie and J. Liu, ACS Appl. Mater. Interfaces, 2018, 10, 6327–6335 CrossRef CAS.
- M. Wu, Y.-n. Lin, H. Guo, T. Ma and A. Hagfeldt, J. Power Sources, 2014, 263, 154–157 CrossRef CAS.
- M. Seibt, R. Khalil, V. Kveder and W. Schröter, Appl. Phys. A: Mater. Sci. Process., 2008, 96, 235–253 CrossRef.
- J. J. Petrovic, Mater. Sci. Eng. A, 1995, 192, 31–37 CrossRef.
- R. S. Rastogi, V. D. Vankar and K. L. Chopra, J. Vac. Sci. Technol., A, 1992, 10, 2822–2825 CrossRef CAS.
- T. Murakami, H. Mano, Y. Hibi, K. Matsuzaki and H. Inui, Tribol. Int., 2014, 69, 61–69 CrossRef CAS.
- Y. Zhang, Y. Li and C. Bai, Ceram. Int., 2017, 43, 6250–6256 CrossRef CAS.
- J. Xu, Z. Li, Z.-H. Xie, P. Munroe, X. L. Lu and X. F. Lan, Appl. Surf. Sci., 2013, 270, 418–427 CrossRef CAS.
- O. Andersen, O. Jepsen, V. N. Antonov, V. Antonov, B. Y. Yavorsky, A. Y. Perlov and A. Shpak, Phys. B, 1995, 204, 65–82 CrossRef CAS.
- L. F. Mattheiss, Phys. Rev. B: Condens. Matter Mater. Phys., 1992, 45, 3252–3259 CrossRef CAS PubMed.
- D. Sciti, S. Guicciardi, G. Celotti, M. Deluca and G. Pezzotti, Adv. Eng. Mater., 2007, 9, 393–399 CrossRef CAS.
- C. Hou, J. Wang, W. Du, J. Wang, Y. Du, C. Liu, J. Zhang, H. Hou, F. Dang, L. Zhao and Z. Guo, J. Mater. Chem. A, 2019, 7, 13460–13472 RSC.
- S. Zhang, G. Wang, J. Jin, L. Zhang, Z. Wen and J. Yang, Nano Energy, 2017, 36, 186–196 CrossRef CAS.
- L. Shaw and R. Abbaschian, J. Mater. Sci., 1995, 30, 5272–5280 CrossRef CAS.
- Y. Fu, H. Du, S. Zhang and W. Huang, Mater. Sci. Eng. A, 2005, 403, 25–31 CrossRef.
- T. L. Barr, Appl. Surf. Sci., 1983, 15, 1–35 CrossRef CAS.
- T. Choudhury, S. Saied, J. Sullivan and A. Abbot, J. Phys. D: Appl. Phys., 1989, 22, 1185 CrossRef CAS.
- X.-F. Lu, D.-J. Wu, R.-Z. Li, Q. Li, S.-H. Ye, Y.-X. Tong and G.-R. Li, J. Mater. Chem. A, 2014, 2, 4706–4713 RSC.
- Y.-C. Chiang, P.-C. Chiang and E.-E. Chang, J. Environ. Eng., 2001, 127, 54–62 CrossRef CAS.
- K. S. Sing and R. T. Williams, Adsorpt. Sci. Technol., 2004, 22, 773–782 CrossRef CAS.
- S. Zhu, J. Li, X. Deng, C. He, E. Liu, F. He, C. Shi and N. Zhao, Adv. Funct. Mater., 2017, 27, 1605017 CrossRef.
- K. M. Khalil, J. Colloid Interface Sci., 2007, 307, 172–180 CrossRef CAS PubMed.
- W. Zhao, X. Li, R. Yin, L. Qian, X. Huang, H. Liu, J. Zhang, J. Wang, T. Ding and Z. Guo, Nanoscale, 2018, 11, 50–59 RSC.
- L. Wang, M. Ara, K. Wadumesthrige, S. Salley and K. Y. S. Ng, J. Power Sources, 2013, 234, 8–15 CrossRef CAS.
- Y. Bae, Y. S. Yun, H.-D. Lim, H. Lee, Y.-J. Kim, J. Kim, H. Park, Y. Ko, S. Lee, H. J. Kwon, H. Kim, H.-T. Kim, D. Im and K. Kang, Chem. Mater., 2016, 28, 8160–8169 CrossRef CAS.
- D. Kundu, R. Black, E. J. Berg and L. F. Nazar, Energy Environ. Sci., 2015, 8, 1292–1298 RSC.
- B. D. Adams, R. Black, C. Radtke, Z. Williams, B. L. Mehdi, N. D. Browning and L. F. Nazar, ACS Nano, 2014, 8, 12483–12493 CrossRef CAS.
- Y. Bae, D.-H. Ko, S. Lee, H.-D. Lim, Y.-J. Kim, H.-S. Shim, H. Park, Y. Ko, S. K. Park, H. J. Kwon, H. Kim, H.-T. Kim, Y.-S. Min, D. Im and K. Kang, Adv. Energy Mater., 2018, 8, 1702661 CrossRef.
- E. Nasybulin, W. Xu, M. H. Engelhard, Z. Nie, S. D. Burton, L. Cosimbescu, M. E. Gross and J.-G. Zhang, J. Phys. Chem. C, 2013, 117, 2635–2645 CrossRef CAS.
- B. D. McCloskey, A. Valery, A. C. Luntz, S. R. Gowda, G. M. Wallraff, J. M. Garcia, T. Mori and L. E. Krupp, J. Phys. Chem. Lett., 2013, 4, 2989–2993 CrossRef CAS PubMed.
- X. Cao, X. Zheng, Z. Sun, C. Jin, J. Tian, S. Sun and R. Yang, Appl. Catal., B, 2019, 253, 317–322 CrossRef CAS.
- J. J. Xu, Z. W. Chang, Y. Wang, D. P. Liu, Y. Zhang and X. B. Zhang, Adv. Mater., 2016, 28, 9620–9628 CrossRef CAS PubMed.
- P. Zhang, S. Zhang, M. He, J. Lang, A. Ren, S. Xu and X. Yan, Adv. Sci., 2017, 4, 1700172 CrossRef PubMed.
- L. Peiqing, X. Qunji and L. Weimin, Surf. Coat. Technol., 2001, 135, 118–125 CrossRef CAS.
- Y. Lu, H. Ang, Q. Yan and E. Fong, Chem. Mater., 2016, 28, 5743–5752 CrossRef CAS.
- J. Xu, L. Liu, P. Munroe, Z.-H. Xie and Z.-T. Jiang, J. Mater. Chem. A, 2013, 1, 10281 RSC.
- P. F. Liu, S. Yang, L. R. Zheng, B. Zhang and H. G. Yang, Chem. Sci., 2017, 8, 3484–3488 RSC.
Footnote |
| † Electronic supplementary information (ESI) available: SEM, EDS, Raman, XPS, cycling performance, discharge/charge profile, EIS, rate performance, and TEM data. See DOI: 10.1039/c9ta10713d |
| This journal is © The Royal Society of Chemistry 2020 |

