
Ultrathin two-dimensional π–d conjugated coordination polymer Co3(hexaaminobenzene)2 nanosheets for highly efficient oxygen evolution†
Chun
Li
a,
Lingling
Shi
a,
Lili
Zhang
b,
Peng
Chen
a,
Junwu
Zhu
 a,
Xin
Wang
*a and
Yongsheng
Fu
*a
a,
Xin
Wang
*a and
Yongsheng
Fu
*a
aKey Laboratory for Soft Chemistry and Functional Materials of Ministry of Education, Nanjing University of Science and Technology, Nanjing 210094, China. E-mail: fuyongsheng@njust.edu.cn; fuyongsheng0925@163.com; wangx@njust.edu.cn
bJiangsu Key Laboratory for Chemistry of Low-Dimensional Materials, Huaiyin Normal University, Huai'an, Jiangsu 223300, China
First published on 22nd November 2019
Abstract
Organic two-dimensional (2D) materials with unique optic-electronic properties are attracting great interest for application in functional electronic devices. However, low electronic conductivity and poor stability still are major defects of 2D organic systems. Herein, we demonstrated ultrathin 2D conductive cobalt–hexaaminobenzene metal–organic coordination polymer nanosheets (Co–HAB-NSs) with a thickness of ∼4.5 nm. The as-prepared Co–HAB-NSs exhibit a low overpotential (310 mV @ 10 mA cm−2) and high durability in 1 M KOH. The experimental and computational results show that the high electrocatalytic activity is ascribed to the enhanced electrochemically active surface area as well as the dense and stable catalytic active sites of Co–HAB-NSs.
Introduction
High-aspect-ratio nanomaterials with micrometer-scale lateral dimensions and nanoscale longitudinal dimensions have attracted intensive attention because they exhibit completely different physicochemical properties from their isotropic (bulk) counterparts. Especially, two-dimensional (2D) nanomaterials have attracted great interest in recent years, such as graphene,1–3 graphdiyne,4,5 hexagonal boron nitride (h-BN),6,7 2D metal–organic frameworks,8 nanosheets of metal oxides,9,10 metal hydroxides,11,12 and metal sulfides.13,14 A large specific surface area, excellent optical transparency, strong quantum confinement, superior electrical conductivity and highly exposed active sites make 2D nanomaterials promising candidates for application in photoelectric devices, sensors, energy storage systems and catalysts.15–18 The abundance of building blocks furnishes organic 2D materials with great diversities in topological structures and high tenability compared with inorganic 2D materials, thus promoting their design and implementation of applications. 2D π–d conjugated coordination polymers (CPs), which originate from flexible self-assembly of metal centers and π-conjugated ligands, are of particular interest in electrochemistry due to the electrically conductive network constructed by the π–d conjugation in 2D structures.19It has been demonstrated that the screening of ligands is very important to the electrochemical performance of CPs. The conductivity of CPs can be enhanced via favorable spatial and energetic overlap of orbitals of metal centers and conjugated ligands,20 while the density of catalytically active sites is closely related to the size and structure of ligands.21–23 However, most research of 2D π–d conjugated CPs focuses on large ligands (such as benzenehexathiol, hexahydroxybenzene, and 2,3,6,7,10,11-hexaiminotriphenylene), which limits the theoretical density of catalytically active sites due to low intrinsic density of the backbone,24–26 whereas smaller linkers have been predicted to exhibit more metallic behavior and thus have great potential for electrochemical applications.16 Hexaaminobenzene (HAB), as one of the smallest π-conjugated ligands with extremely high density of redox-active centers, enables facile charge transport between the metal nodes and the conjugated ligands.20,25 HAB is tritopic (hexadentate) with D3h symmetry and can yield a honeycomb 2D lattice when coordinating with Ni(II) or Cu(II) via strong-field ligands such as amino and thiol groups.27–30 Such an assembly with plenty of loosely bound charge carriers and considerable π orbital overlap gives the 2D π–d conjugated CPs relatively high electrical conductivity. In addition, the nitrogen richness endows the 2D π–d conjugated CPs composed of HAB with dense electrocatalytically active sites.31 However, relatively little attention has been paid to the HAB building block for 2D π–d conjugated CPs and the applications in electrocatalysis.32,33
Herein, we report a facile one-step method to construct ultrathin 2D conductive coordination polymer nanosheets by using Co(II) ions as a skeletal node and hexaaminobenzene as an organic connection (Co–HAB-NSs) for the oxygen evolution reaction (OER). The nanoarchitecture and dimensionality of CPs can be effectively controlled by a simple and cost-efficient soft-chemistry procedure: Co–HAB-NSs with a thickness of ∼4.5 nm were synthesized in an aqueous reaction system at room temperature. Benefiting from the unique nanostructure and making full use of the π–d conjugated conductive network, Co–HAB-NSs demonstrate a high electrical conductivity, large electrochemically active surface area (ECSA), and high area-specific activity as well as promoting the electrocatalytic performance of the OER. Moreover, Co–HAB-NSs display a lower overpotential (310 mV) and dynamic favored Tafel slope (56 mV dec−1) compared to the benchmark RuO2, and both experimental and computational results validate the important role of dense active sites in OER catalysis. The superb chemical stability and long term durability broaden the application prospects of Co–HAB-NSs in electrocatalysis.
Results and discussion
Structure and morphology
Co(II) has been seldom used to synthesize 2D π–d conjugated CPs because of its less-preferred D4h coordination compared with Ni(II) and Cu(II). Nevertheless, we selected Co(II) as the metal node to construct an anode catalyst for the OER due to its weaker electron affinity than Ni(II) or Cu(II). The schematic illustration of catalyst synthesis is presented in Fig. 1a. Fig. 1b shows the X-ray diffraction (XRD) patterns of Co–HAB-NSs, Co–HAB-NSs-2, bulk Co–HAB, and Co–HAB–C. For Co–HAB-NSs and Co–HAB-NSs-2, the flat XRD patterns may be ascribed to the amorphous crystal structure and the ultrathin nanosheets, which give rise to a very weak and unobservable diffraction signal.34,35 Furthermore, FTIR spectra of Co–HAB-NSs, Co–HAB-NSs-2, bulk Co–HAB and Co–HAB–C are shown in Fig. 1c. The absorption peaks at 3200–3400 cm−1, 1613 cm−1, 1560 cm−1 and 1410 cm−1 can be assigned to N–H stretching, N–H bending, aromatic C![[double bond, length as m-dash]](https://www.rsc.org/images/entities/char_e001.gif) C stretching and C–N stretching respectively,36,37 matching well with the structure of the produced coordination polymer.
C stretching and C–N stretching respectively,36,37 matching well with the structure of the produced coordination polymer.
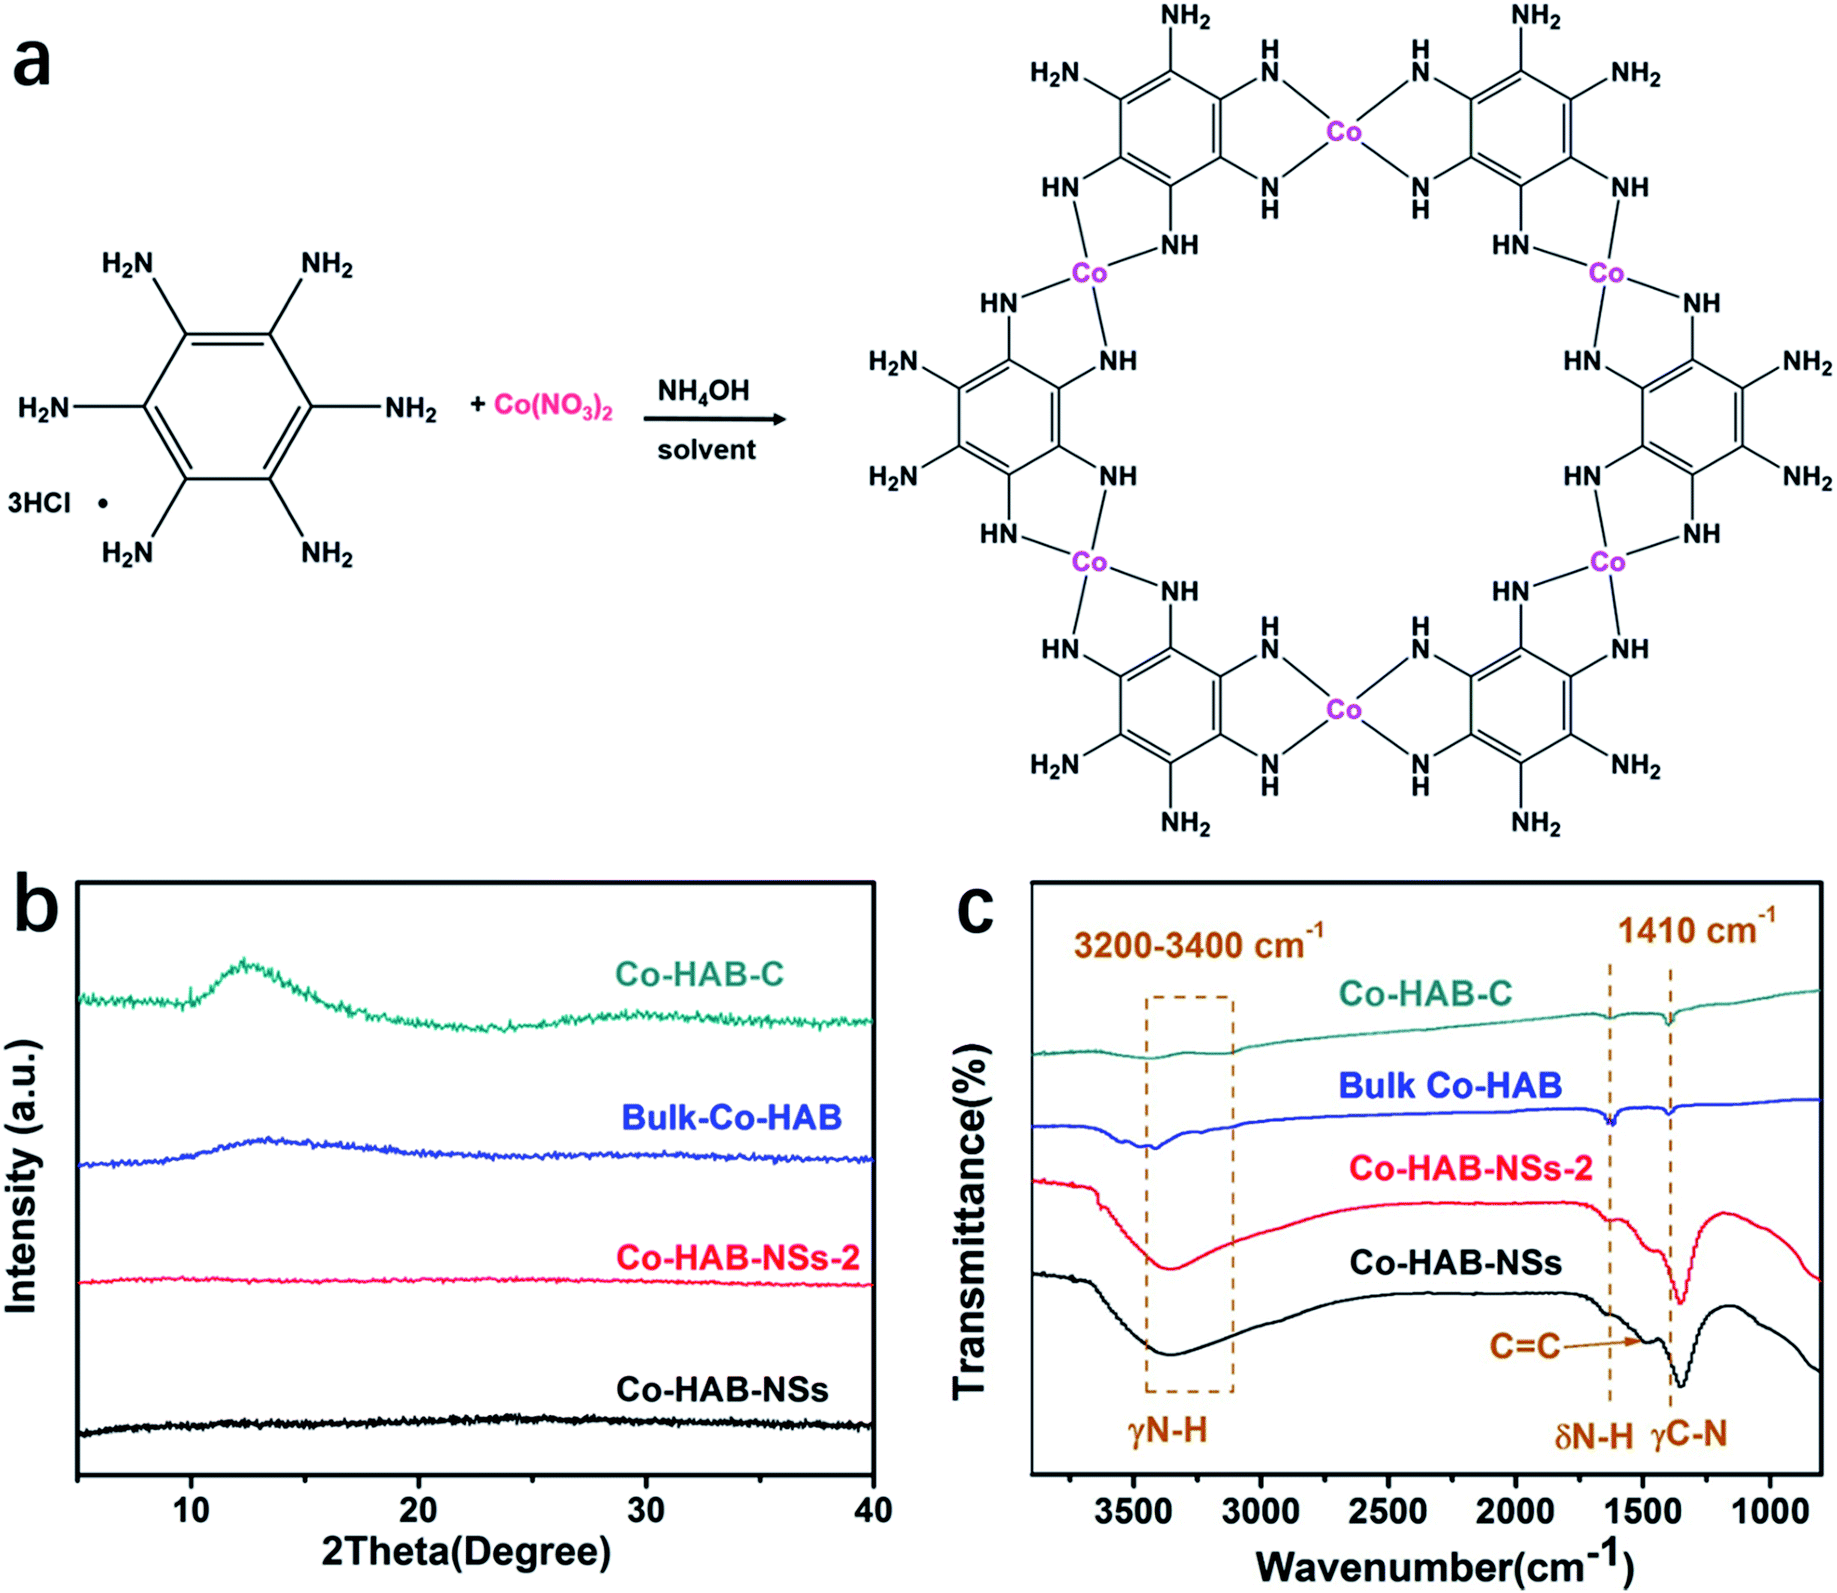 | ||
| Fig. 1 (a) Synthetic scheme of Co–HAB-NSs. (b) XRD patterns and (c) Fourier-transform infrared spectra of Co–HAB-NSs, Co–HAB-NSs-2, bulk Co–HAB and Co–HAB–C. | ||
The morphology of the Co–HAB-NSs is determined by using a scanning electron microscope (SEM), transmission electron microscope (TEM) and atomic force microscope (AFM) (Fig. 2). It can be clearly seen that the Co–HAB-NSs exhibit a uniform flower-like structure with a diameter of ∼500 nm (Fig. 2a and b). TEM images of the Co–HAB-NSs (Fig. 2c) display more clearly a 2D layered structure, and the high resolution TEM images and the selected-area electron diffraction demonstrate the polycrystalline structure of Co–HAB-NSs and Co–HAB-NSs-2 (Fig. 2d and S2†). Such a 2D layered structure endows Co–HAB-NSs with a much higher specific surface area (90.30 m2 g−1) and wider distribution of pore size than that of bulk Co–HAB (43.44 m2 g−1) and Co–HAB-NSs-2 (18.03 m2 g−1) (Fig. S3a†), suggesting the high potential of Co–HAB-NSs to provide more active sites. Since Co–HAB-NSs are ultrathin nanosheets with an average thickness of ∼4.5 nm (Fig. 2e and f) and its real structure might not be a perfect 2D eclipsed structure, its pore size distribution in Fig. S3b† shows not just concentrated micro-pores but few micro-pores and many meso-pores. And the contribution in the meso-pore region can be attributed to the inter-layer packing of the Co–HAB-NSs. Moreover, AFM was employed to detect the thickness of the Co–HAB-NSs. Before the observation, the synthesized Co–HAB-NSs were dispersed in ethanol by ultrasonication for 30 min. The AFM images and height profiles demonstrate the ultrathin feature of Co–HAB-NSs with an average thickness of ∼4.5 nm (Fig. 2e and f). The SEM and SEM-EDS mapping images indicate that Co, C, O and N elements are uniformly distributed on the surface of the nanosheets (Fig. 2g). The X-ray photoelectron spectrum (XPS) of Co–HAB-NSs indicates the presence of only C, O, N and Co(II) (Fig. S4†), which is in line with the EDS mapping.
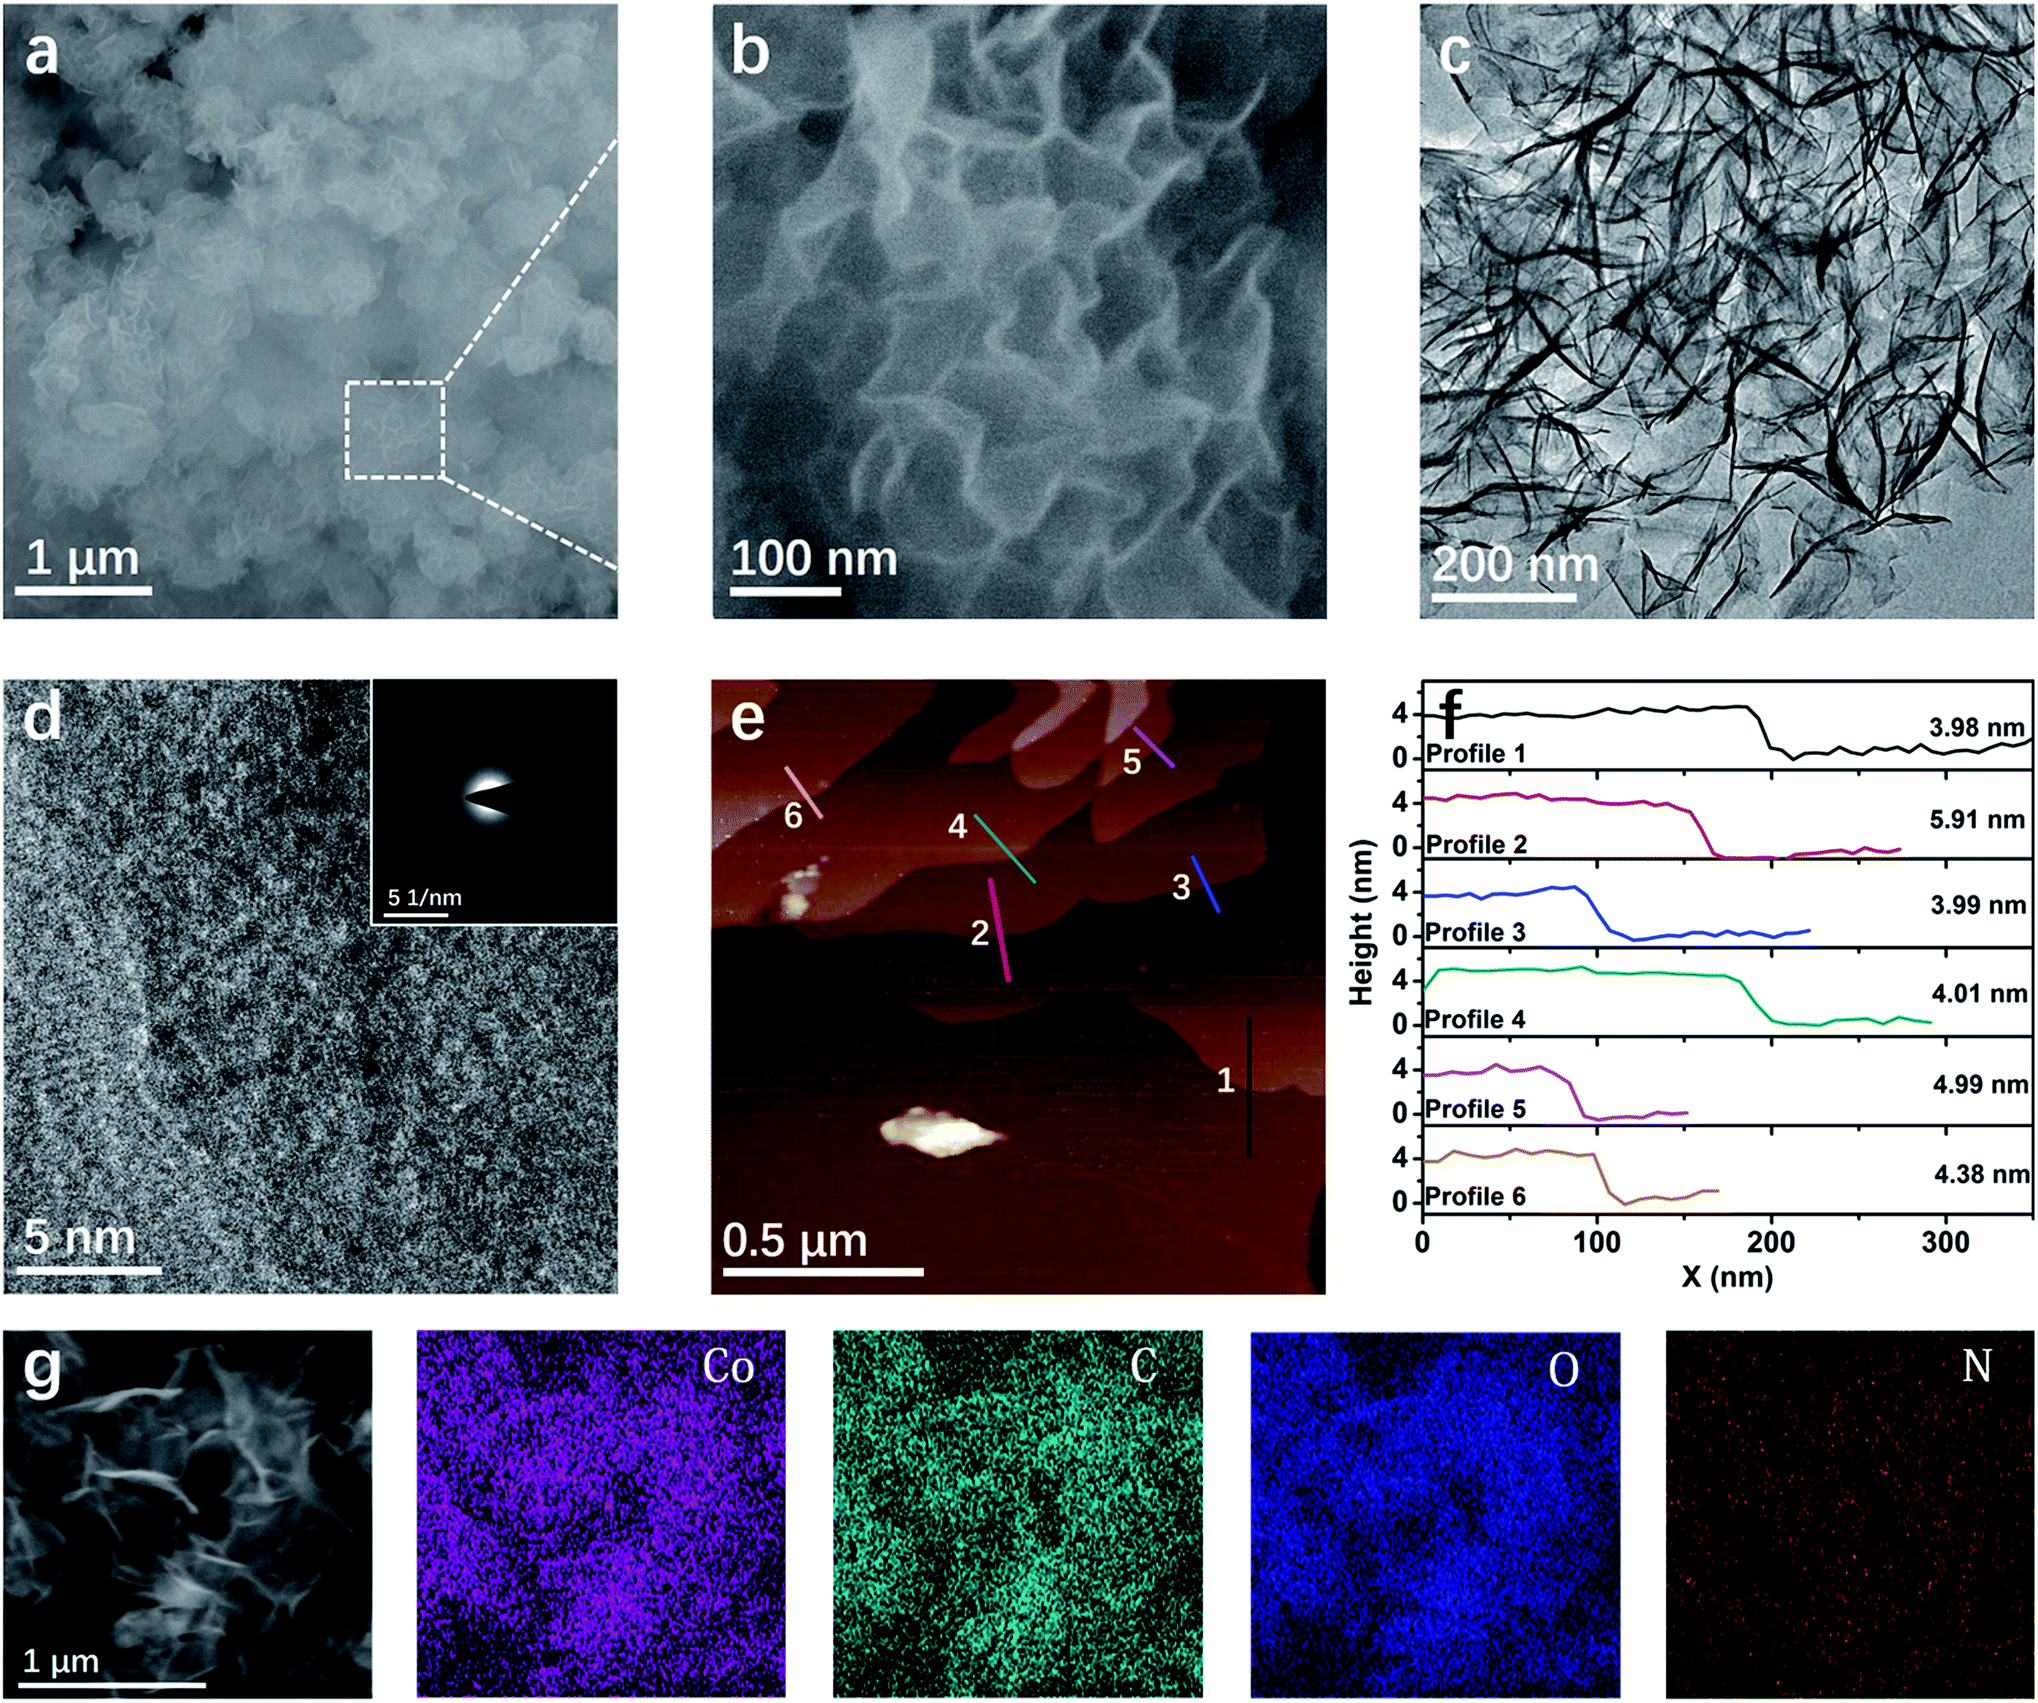 | ||
| Fig. 2 (a and b) SEM images and (c and d) TEM and HRTEM images of Co–HAB-NSs; the inset of (d) shows the selected-area electron diffraction pattern. (e) AFM image and (f) height profiles of the Co–HAB-NSs. The profiles 1, 2, 3, 4, 5 and 6 correspond to the numbered lines in Fig. 2e, respectively. (g) SEM and corresponding Co, C, O and N EDS mapping images. | ||
The high-resolution spectra of C 1s for Co–HAB-NSs, bulk Co–HAB and Co–HAB–C (Fig. 3a) show the occurrence of three peaks corresponding to CC, C–N and CN, respectively,38,39 suggesting the remained bridging of N species with benzene rings. The CN peaks of Co–HAB-NSs (289.0 eV) and bulk Co–HAB (288.6 eV) shifted to higher binding energies compared with Co–HAB–C (287.8 eV) because the large decrease of N atoms caused by the carbonization may reduce the electron density on C atoms, which is favourable for the adsorption of OER intermediates such as negatively charged OH− and a faster reaction rate benefitting from the accelerated electron transfer.40–42 N 1s spectra reveal the presence of redox active N species and the reversible oxidation of benzoid amine to quinoid imine could facilitate charge transfer and thus improve OER performance.25 Co 2p spectra of Co–HAB-NSs, bulk Co–HAB and Co–HAB–C (Fig. 3c) exhibit two peaks of Co 2p3/2 (781.0 eV) and Co 2p1/2 (796.3 eV) of Co2+ with two typical satellite peaks of Co2+ in a square planar geometry.43–45 The Co–HAB-NSs show higher binding energy for Co 2p3/2 (781.6 eV) and Co 2p1/2 (797.4 eV) than those of bulk Co–HAB and Co–HAB–C, indicating a significant delocalization of 3d electrons of Co(II) and strong π–d interaction in the 2D structure, leading to fast electron transfer and high conductivity.
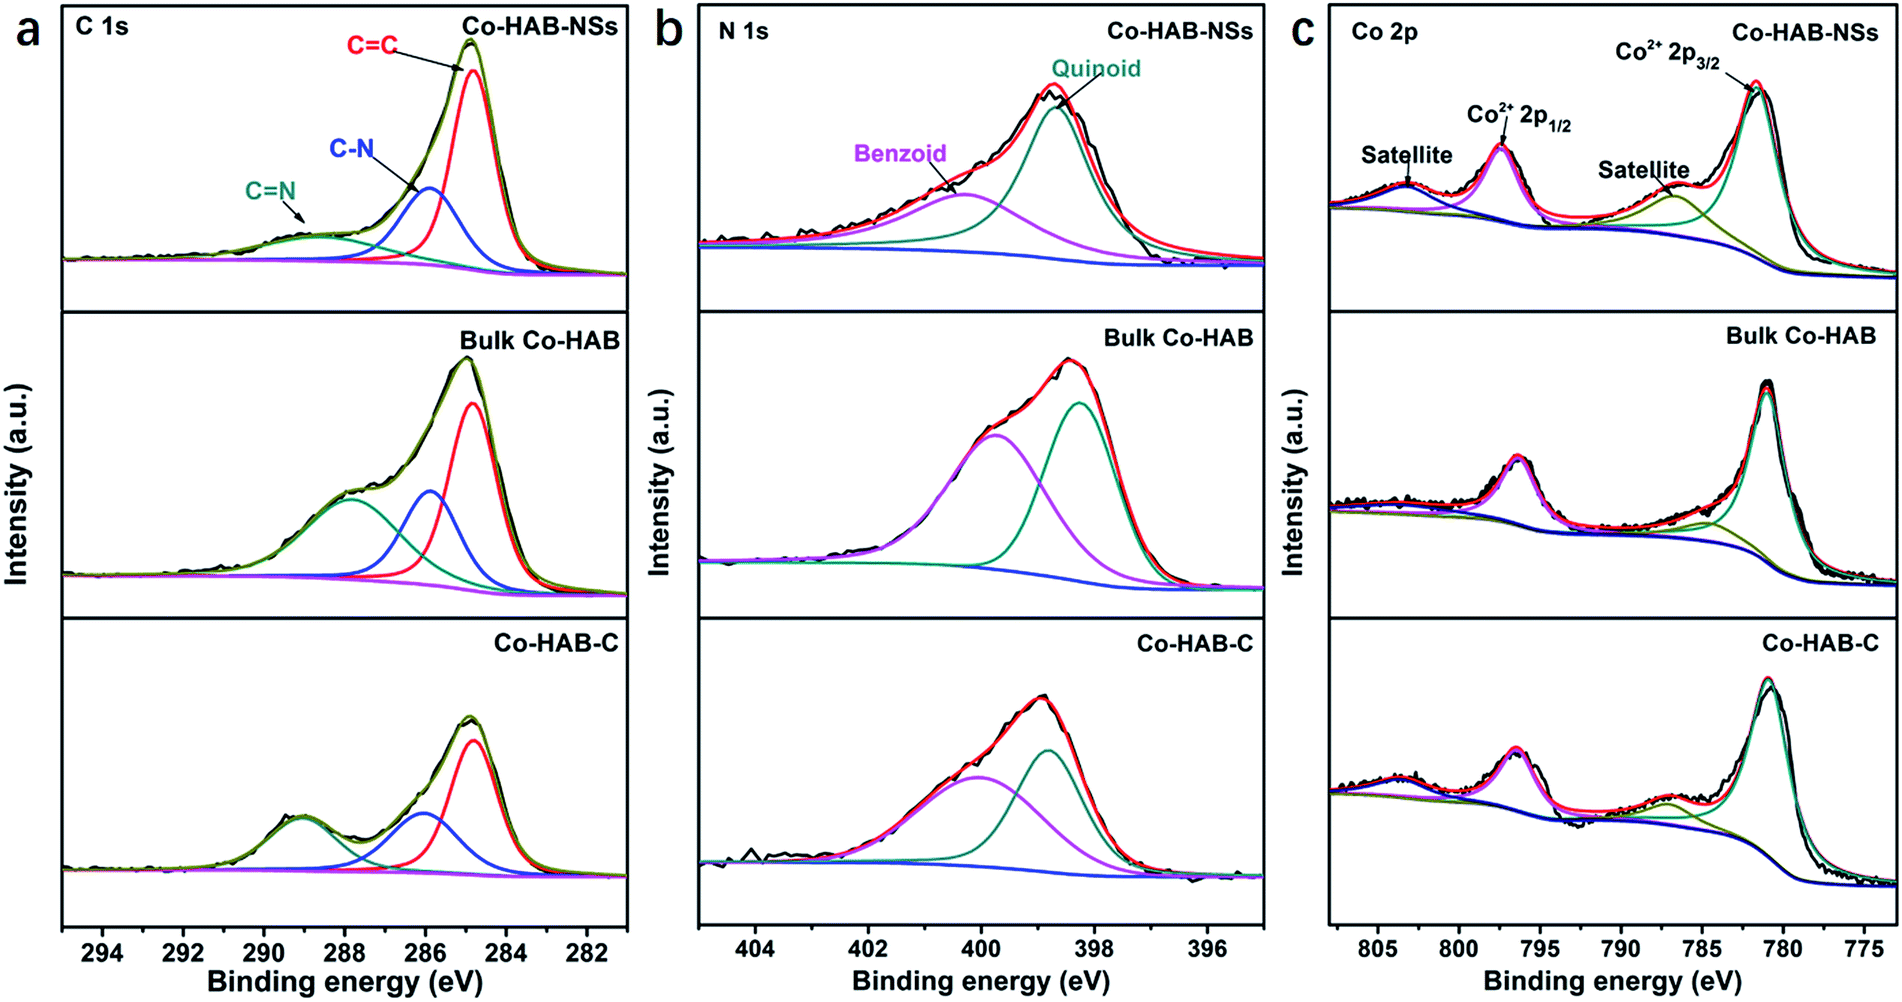 | ||
| Fig. 3 High-resolution XPS spectra of (a) C 1s, (b) N 1s, and (c) Co 2p of Co–HAB-NSs, bulk Co–HAB and Co–HAB–C. | ||
Electrocatalytic performance
Linear sweep voltammetry was carried out to obtain the polarization curves of catalysts and the results are shown in Fig. 4a. An onset potential (defined as the potential at a current density of 1 mA cm−2) of 1.46 V for Co–HAB-NSs can be observed, which is comparable to that of commercial RuO2 (1.43 V) and much lower than that of bulk Co–HAB (1.57 V), demonstrating that Co–HAB-NSs possess high catalytic activity toward the OER. It is noted that the overpotential is also a major evaluation parameter for the catalytic performance of the OER, and here the overpotential is defined as the difference between the electrode potential at a current density of 10 mA cm−2 and the thermodynamic OER potential (H2O/O2 = 1.23 V). The Co–HAB-NSs display a lower overpotential of 310 mV compared with other catalysts (Co–HAB-NSs-2: 350 mV, bulk Co–HAB: 410 mV, Co–HAB–C: 320 mV and RuO2: 325 mV). Tafel plots were obtained to assess the kinetics of the OER as shown in Fig. 4b. Smaller Tafel slopes of Co–HAB-NSs (56 mV dec−1) and Co–HAB–C (60 mV dec−1) imply the fast reaction rates of the OER over Co–HAB-NSs and Co–HAB–C as compared with other catalysts (Co–HAB-NSs-2: 108 mV dec−1, bulk Co–HAB: 88 mV dec−1 and RuO2: 119 mV dec−1).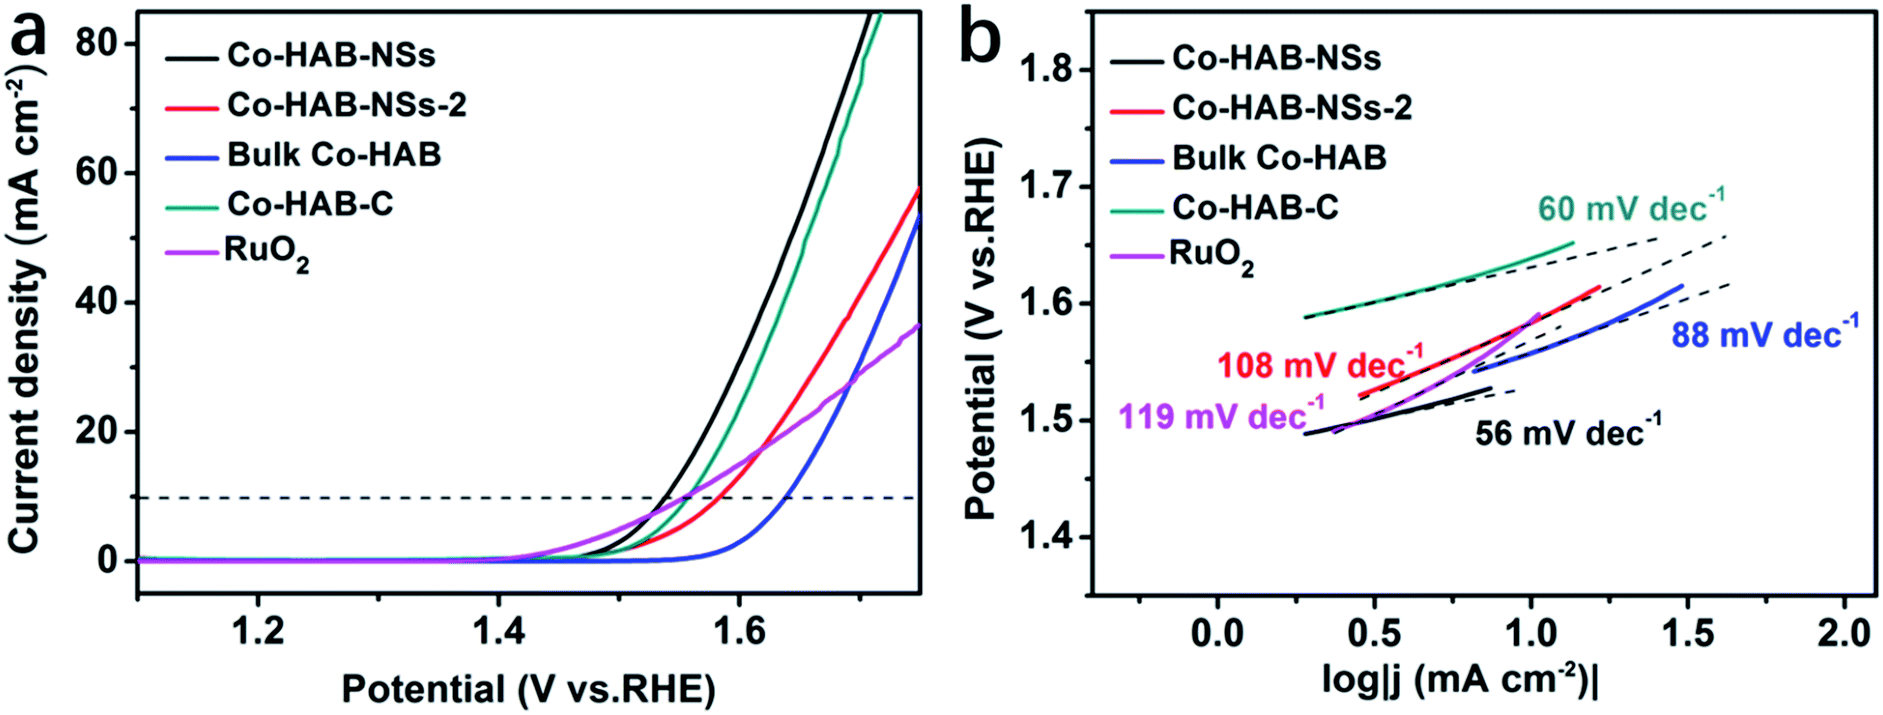 | ||
| Fig. 4 (a) Linear sweep voltammetry curves. (b) Tafel profiles of Co–HAB-NSs, Co–HAB-NSs-2, bulk Co–HAB, Co–HAB–C and RuO2. | ||
Table S1† summarizes a comparative survey of important measurement parameters and the OER performance of state-of-the-art Co-based electrocatalysts. The as-obtained Co–HAB-NSs show excellent OER performance, which can be ascribed to the structural superiority of 2D ultrathin nanosheets of Co–HAB-NSs, high electrical conductivity arising from the strong π–d conjunction and a large electrochemical surface area with dense active sites.
Firstly, to explore the relationship between the catalytic activity and the 2D layered structure, a comparison of the OER catalytic activity performance of Co–HAB with different morphologies is shown in Fig. 5. The nanoparticles, thick sheets and hexagonal nanosheets of Co–HAB display much smaller overpotentials (350 mV, 360 mV, and 330 mV, respectively) than bulk Co–HAB (410 mV), clearly indicating the advantage of the 2D nanoscale layered structure for OER catalytic activity. Tafel slopes of Co–HAB-NP, Co–HAB–S and Co–HAB-HNs are 119 mV dec−1, 133 mV dec−1 and 155 mV dec−1, respectively, much larger than that of Co–HAB-NSs, leading to poorer activities for the OER. This may be ascribed to the agglomeration of nanoparticles, considerable thickness of sheets and poor conductivity of hexagonal nanosheets (2.3 × 10⁻³ S cm−1), which indirectly verifies the significance of the uniform ultrathin nanostructure to facilitate OER kinetics. As shown in Fig. S5,† the XPS spectra of Co 2p for Co–HAB-NP, Co–HAB–S and Co–HAB-HNs display two peaks of Co 2p3/2 and Co 2p1/2 of Co with two typical satellite peaks of Co2+, indicating that Co2+ was coordinated with HAB. The intensive main peaks of Co2+ 2p3/2 for Co–HAB-NP (780.67 eV and 782.40 eV) were slightly shifted to higher binding energies as compared with Co–HAB–S (780.44 eV and 781.94 eV) and Co–HAB-HNs (780.13 eV and 781.60 eV). The slight differences in binding energies are probably caused by the morphological distinctions among the samples, which may affect the absorption of oxygen on the unsaturated Co atoms. The higher catalytic activity of Co–HAB-NSs than that of Co–HAB-NSs-2, bulk Co–HAB and Co–HAB–C also reveals the structural superiority of 2D ultrathin nanosheets according to their SEM images (Fig. S6†) and TEM images (Fig. S7†).
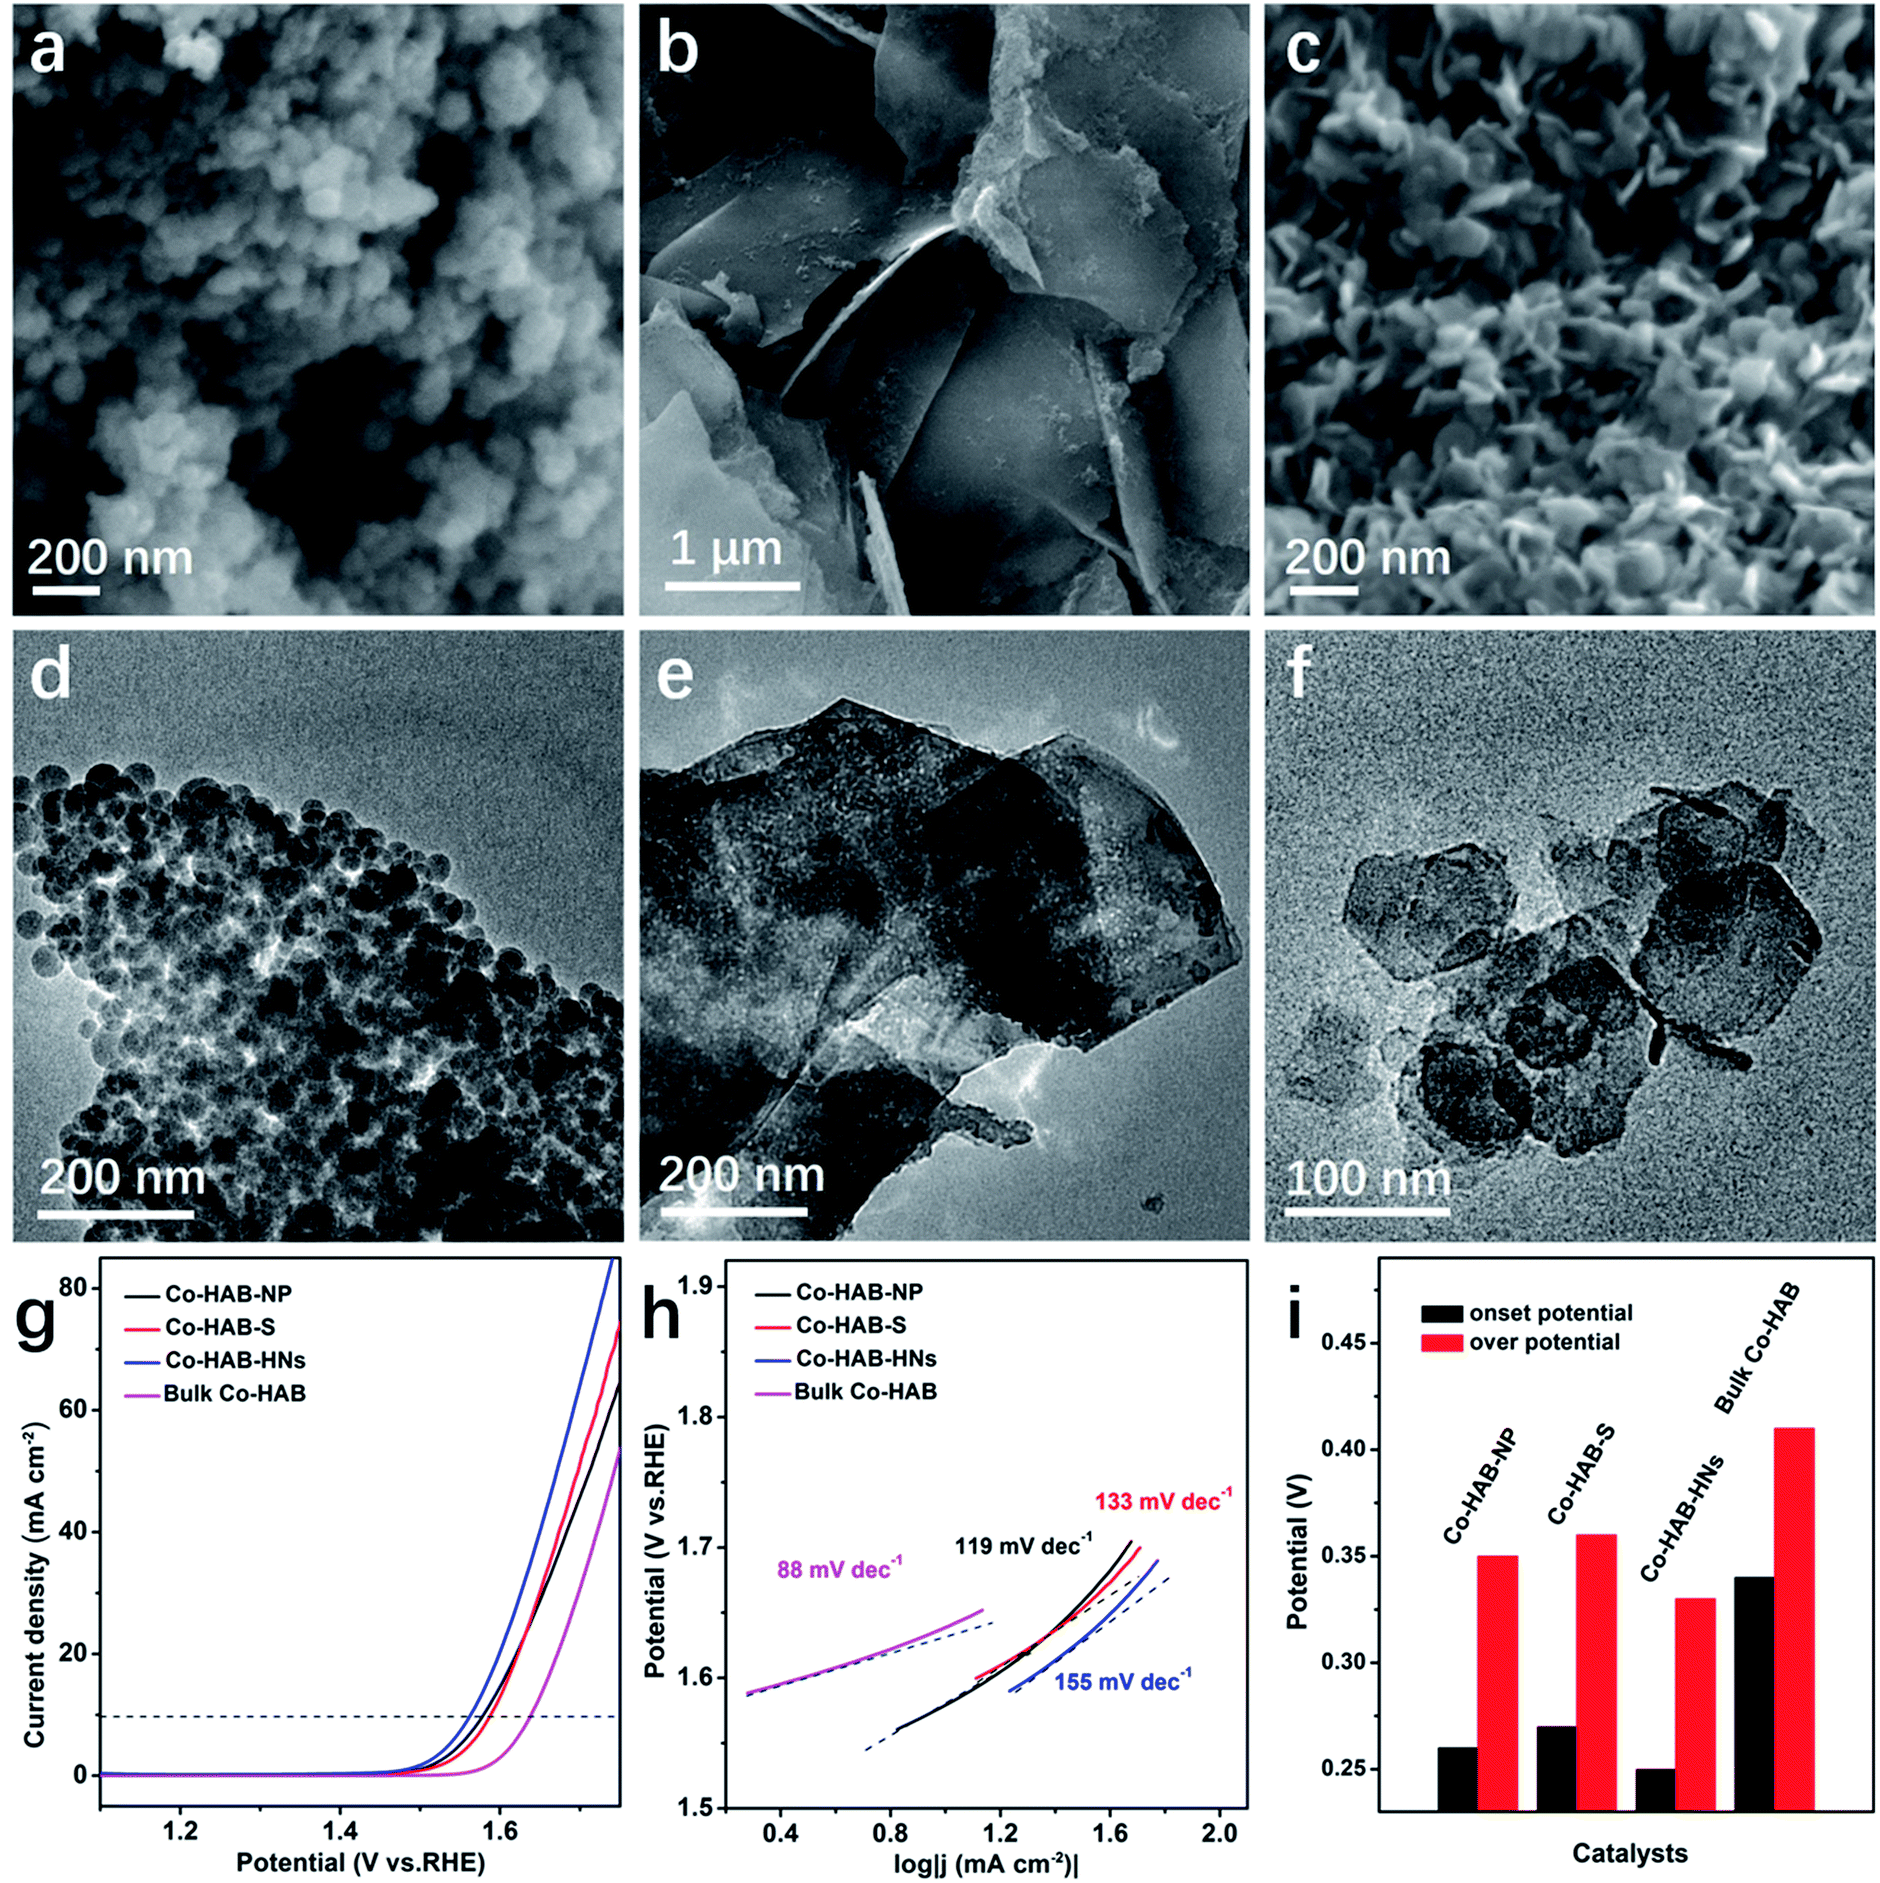 | ||
| Fig. 5 (a–c) SEM images and (d–f) TEM images of Co–HAB-NP, Co–HAB–S and Co–HAB-HNs. (g) LSV curves, (h) Tafel profiles and (i) onset potential and overpotentials of Co–HAB-NP, Co–HAB–S, Co–HAB-HNs and bulk Co–HAB. | ||
Secondly, the electrode kinetics of the synthesized catalysts during electrolysis was further investigated by electrochemical impedance spectroscopy (EIS) measurements at open circuit voltage, as presented in Fig. S8.† The charge transfer resistance of Co–HAB-NSs is much smaller than that of Co–HAB-NSs-2, bulk Co–HAB and Co–HAB–C, consistent with the smaller overpotential and Tafel slope. Besides, the electrical conductivity of Co–HAB-NSs was measured to be 0.2 S cm−1, which can be ascribed to the high delocalization of electrons and strong π–d interaction between Co(II) and HAB, thus leading to favorable kinetics for the OER.
Finally, the influence of the electrochemical surface area (ECSA) on the OER catalytic activity was evaluated. The CV curves of Co–HAB-NSs, Co–HAB-NSs-2, bulk Co–HAB and Co–HAB–C show that Co–HAB-NSs possess the largest integral area, indicating the highest available ECSA (Fig. 6a). In addition, the electrochemical double-layer capacitances (Cdl) of the as-prepared electrodes were calculated to evaluate the ECSA of the four samples (Fig. 6b), as the ECSA is proportional to Cdl in electrocatalysis.46 The slope of the linear relationship of current density against the cyclic voltammetry scan rate was calculated and the slope is twice Cdl (Fig. S9†). It is found that the Co–HAB-NSs give the largest Cdl among the as-prepared electrodes, manifesting that the 2D layered structure of Co–HAB-NSs can generate higher current density and more accessible surface active sites.47 To further explore the intrinsic activity of those catalysts toward the OER, the contribution of the ECSA to the catalytic activity was eliminated by normalizing the oxygen evolving current density (j) of the catalysts with their Cdl. As shown in Fig. 6c, the j/Cdl represents the area-specific activity of the catalysts and the j/Cdl value obtained at different overpotentials decreased in the following order: Co–HAB-NSs > Co–HAB–C > Co–HAB-NSs-2 > bulk Co–HAB. Thus, the enhancement of the OER activity of Co–HAB-NSs can be ascribed to not only the increased ECSA but also the improved intrinsic catalytic activity of the catalyst which are caused by the structural superiority of 2D ultrathin nanosheets.
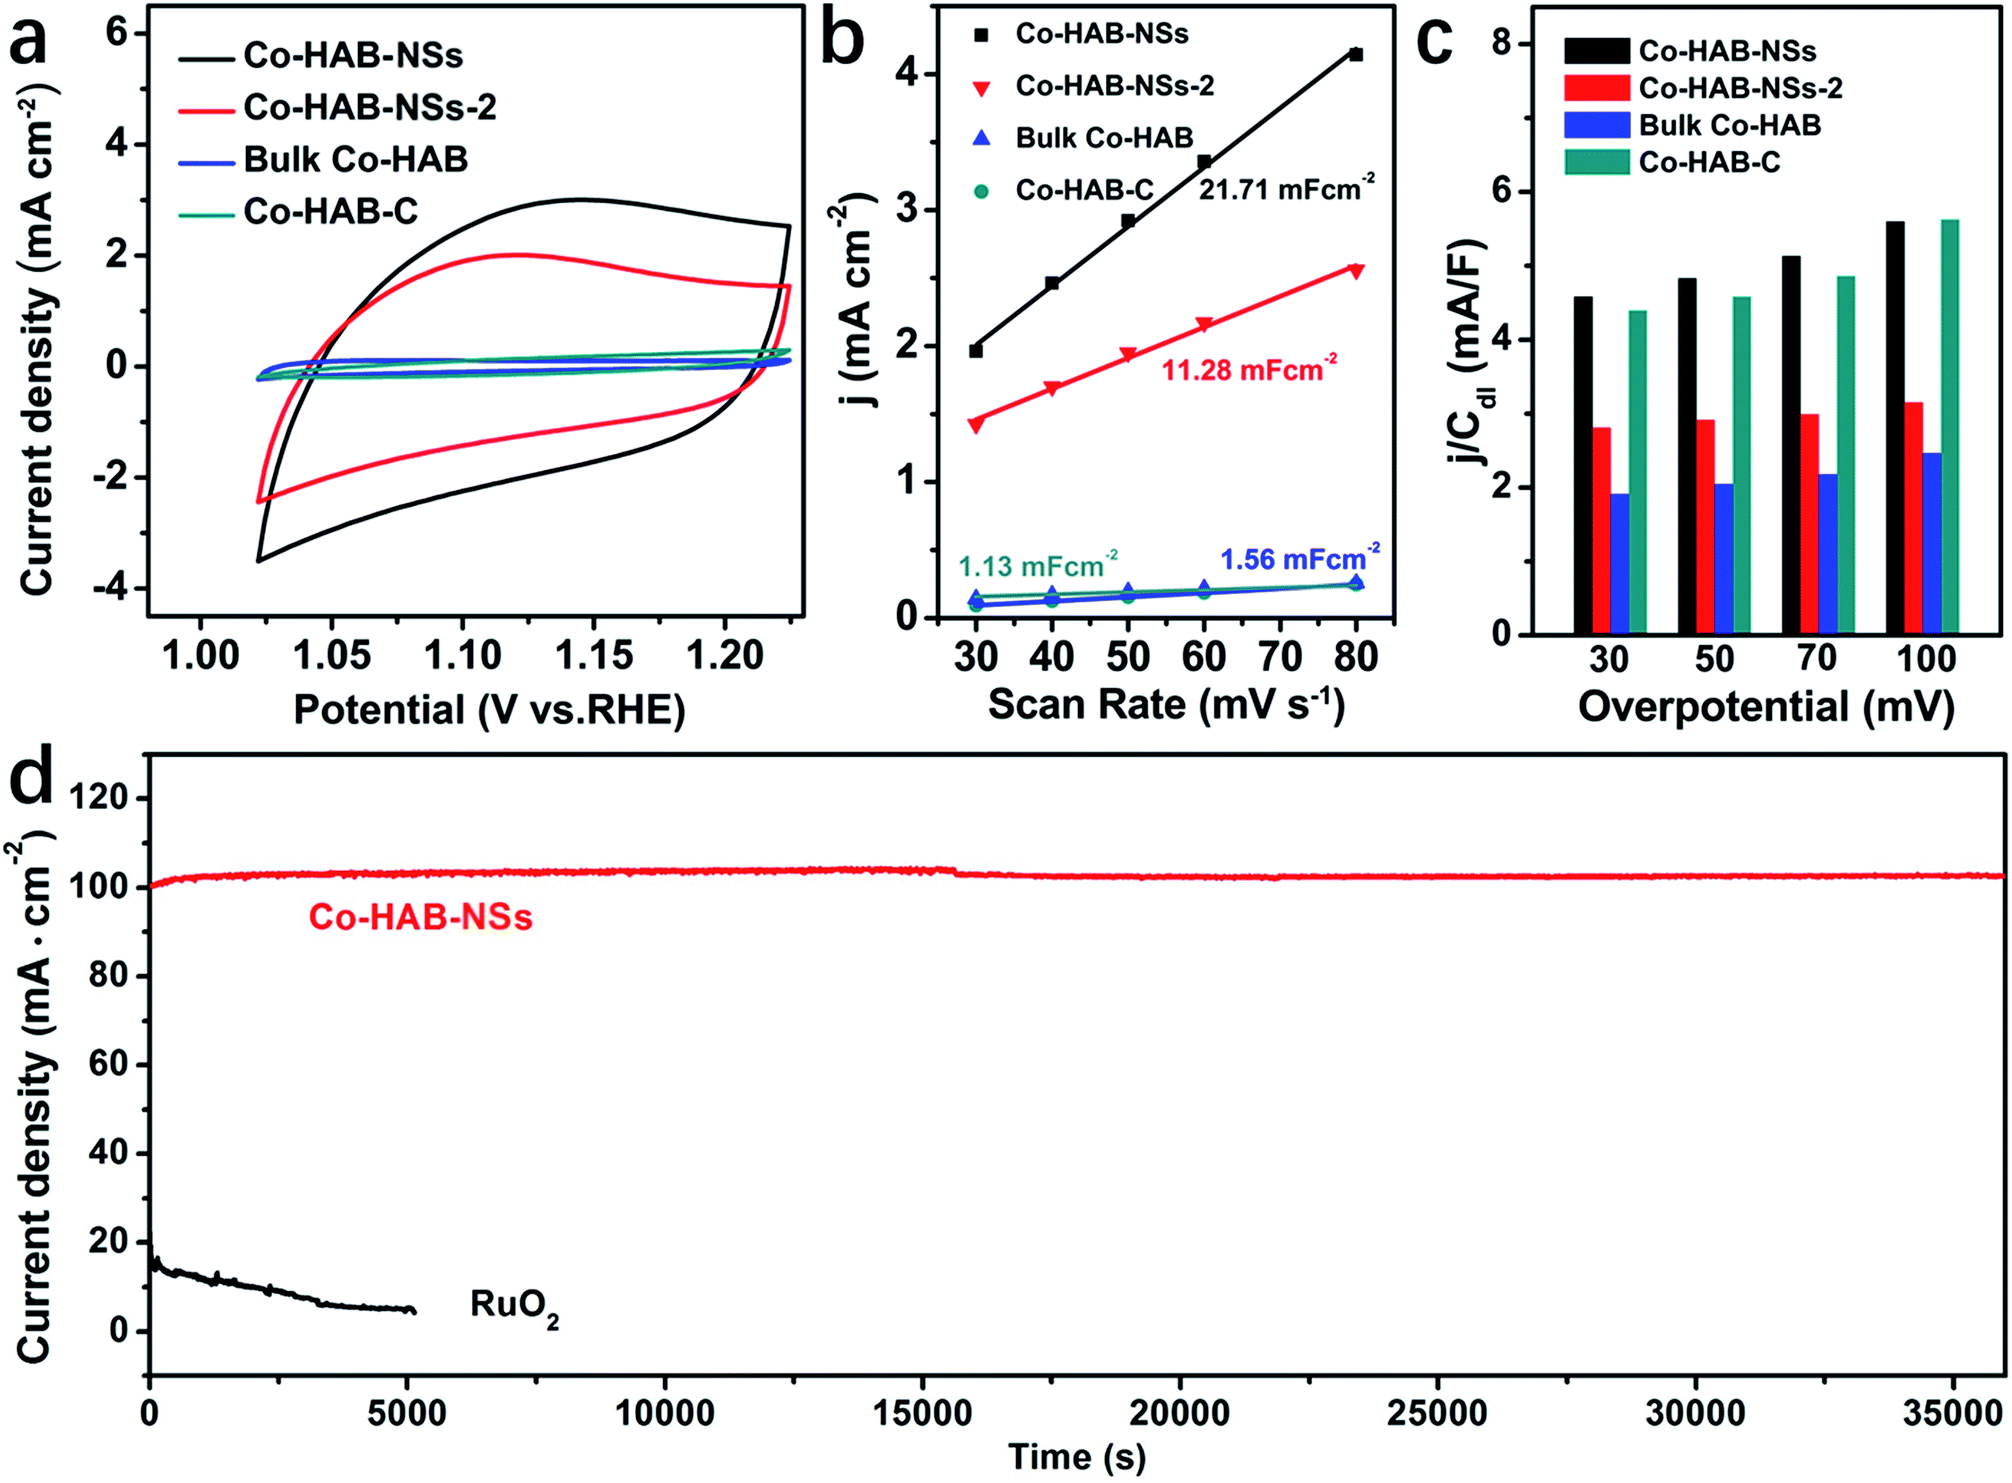 | ||
| Fig. 6 (a) CV curves at 50 mV s−1. (b) Double layer capacitance (Cdl). (c) j/Cdl comparison of Co–HAB-NSs, Co–HAB-NSs-2, bulk Co–HAB and Co–HAB–C. (d) j–t curves of Co–HAB-NSs and RuO2 at 1.75 V. | ||
The durability and chemical stability of electrode materials are also critical parameters to assess their potential values in practical applications. Thus the durability of Co–HAB-NSs during electrolysis was evaluated by chronoamperometry measurements (CA) as shown in Fig. 6d. The current density remains steady at an applied potential of −1.75 V for 10 hours, which reveals a much better durability than that of RuO2. The Co 2p XPS spectrum of Co–HAB-NSs after long-term electrolysis shown in Fig. 7a, the N 1s and survey spectrum (Fig. S10†) confirm that the atoms on the catalyst surface maintained their original state. In addition, the measurements of chemical stability were carried out in 0.05 M H2SO4 and 1 M KOH (detailed procedure is given in the Experimental section), respectively. After being treated with 0.05 M H2SO4 and 1 M KOH, it can be seen that there was no noticeable change in the structure of Co–HAB-NSs and bulk Co–HAB based on the Fourier-transform infrared spectra (Fig. 7b) and SEM images (Fig. 7c and d). The remarkable electrochemical durability and chemical stability can be ascribed to the strong chelating effect of hexadenticity and coordination bonds between Co(II) and HAB.
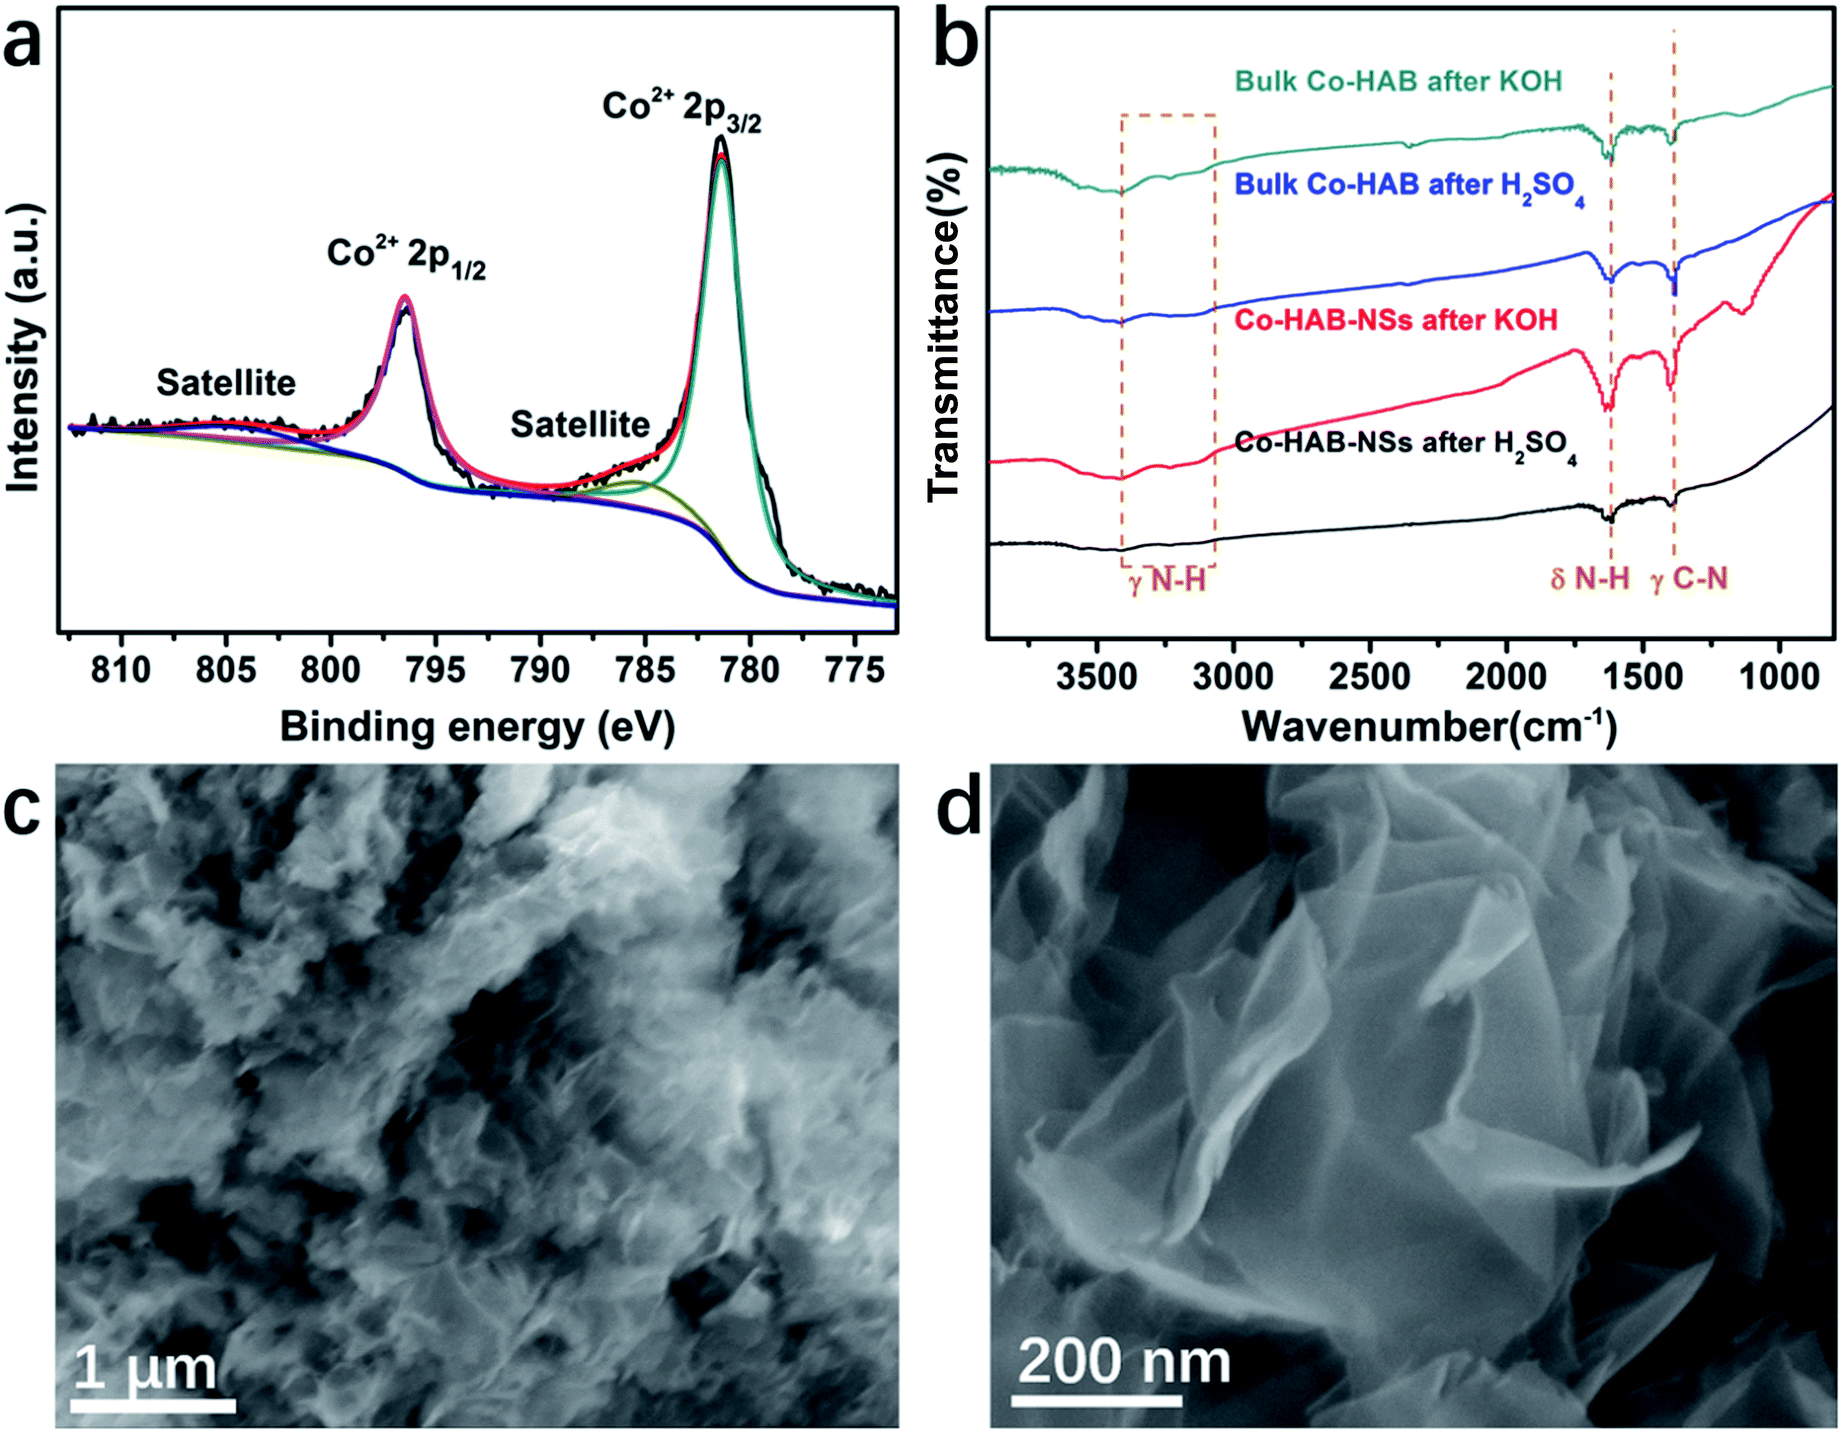 | ||
| Fig. 7 (a) XPS spectra of Co 2p for Co–HAB-NSs after electrolysis. (b) Fourier-transform infrared spectra of Co–HAB-NSs and bulk Co–HAB. (c and d) SEM images of Co–HAB-NSs after treatments with 0.05 M H2SO4 and 1 M KOH. | ||
Furthermore, density-functional theory (DFT) calculations were performed to investigate the intrinsic OER catalytic performance of Co–HAB. The carbon and cobalt atoms connected to four N atoms act as active sites for the absorption of OER intermediates (hydroxyl OH*, oxyl O*, and hydroperoxyl OOH*), and the optimal structure of Co–HAB and the intermediate structure of each elementary step in the OER over Co–HAB are exhibited in Fig. 8a and b. Obviously, Co–HAB displays a unique planar honeycomb structure, which remains unchanged after absorbing intermediates whether on the carbon atoms or on the cobalt atoms. Fig. 8c presents the free energy diagram of the OER on Co–HAB and RuO2 (110) surfaces (U = 0). It can be seen that the electron-deficient cobalt atoms can facilitate the chemisorption of negatively charged OH−, thus promoting the first elementary step in the OER.47,48 When the intermediates are absorbed on the cobalt sites of Co–HAB (Co–HAB@Co), the limiting step is the transformation of O* into OOH* with a maximum free energy of 1.98 eV, while the largest uphill energy transfer occurs in the formation of O* when the intermediates are absorbed on the carbon sites of Co–HAB (Co–HAB@C). Though the energy required for rate-determining steps on both Co–HAB@Co sites and Co–HAB@C sites is larger than that of RuO2, the energy barrier of OH− → O* over Co sites and O* → O2 over C sites is much lower than that of RuO2, which effectively promotes the catalytic reaction. Similar results are also observed when the applied voltage is 0.72 V (Fig. S11†). The overpotential is determined from the ΔG of the potential-determining step as shown in the volcano plots in Fig. 8d, and the detailed calculation is provided in the ESI.† Two different values of U were applied in Hubbard-U correction. It can be seen that the overpotentials for C sites are lower than those of Co sites, indicating higher catalytic activity over C atoms in the conjugated ring. Therefore, it can be concluded that the favorable thermodynamics contributes to low overpotential and high catalytic activity toward the OER.
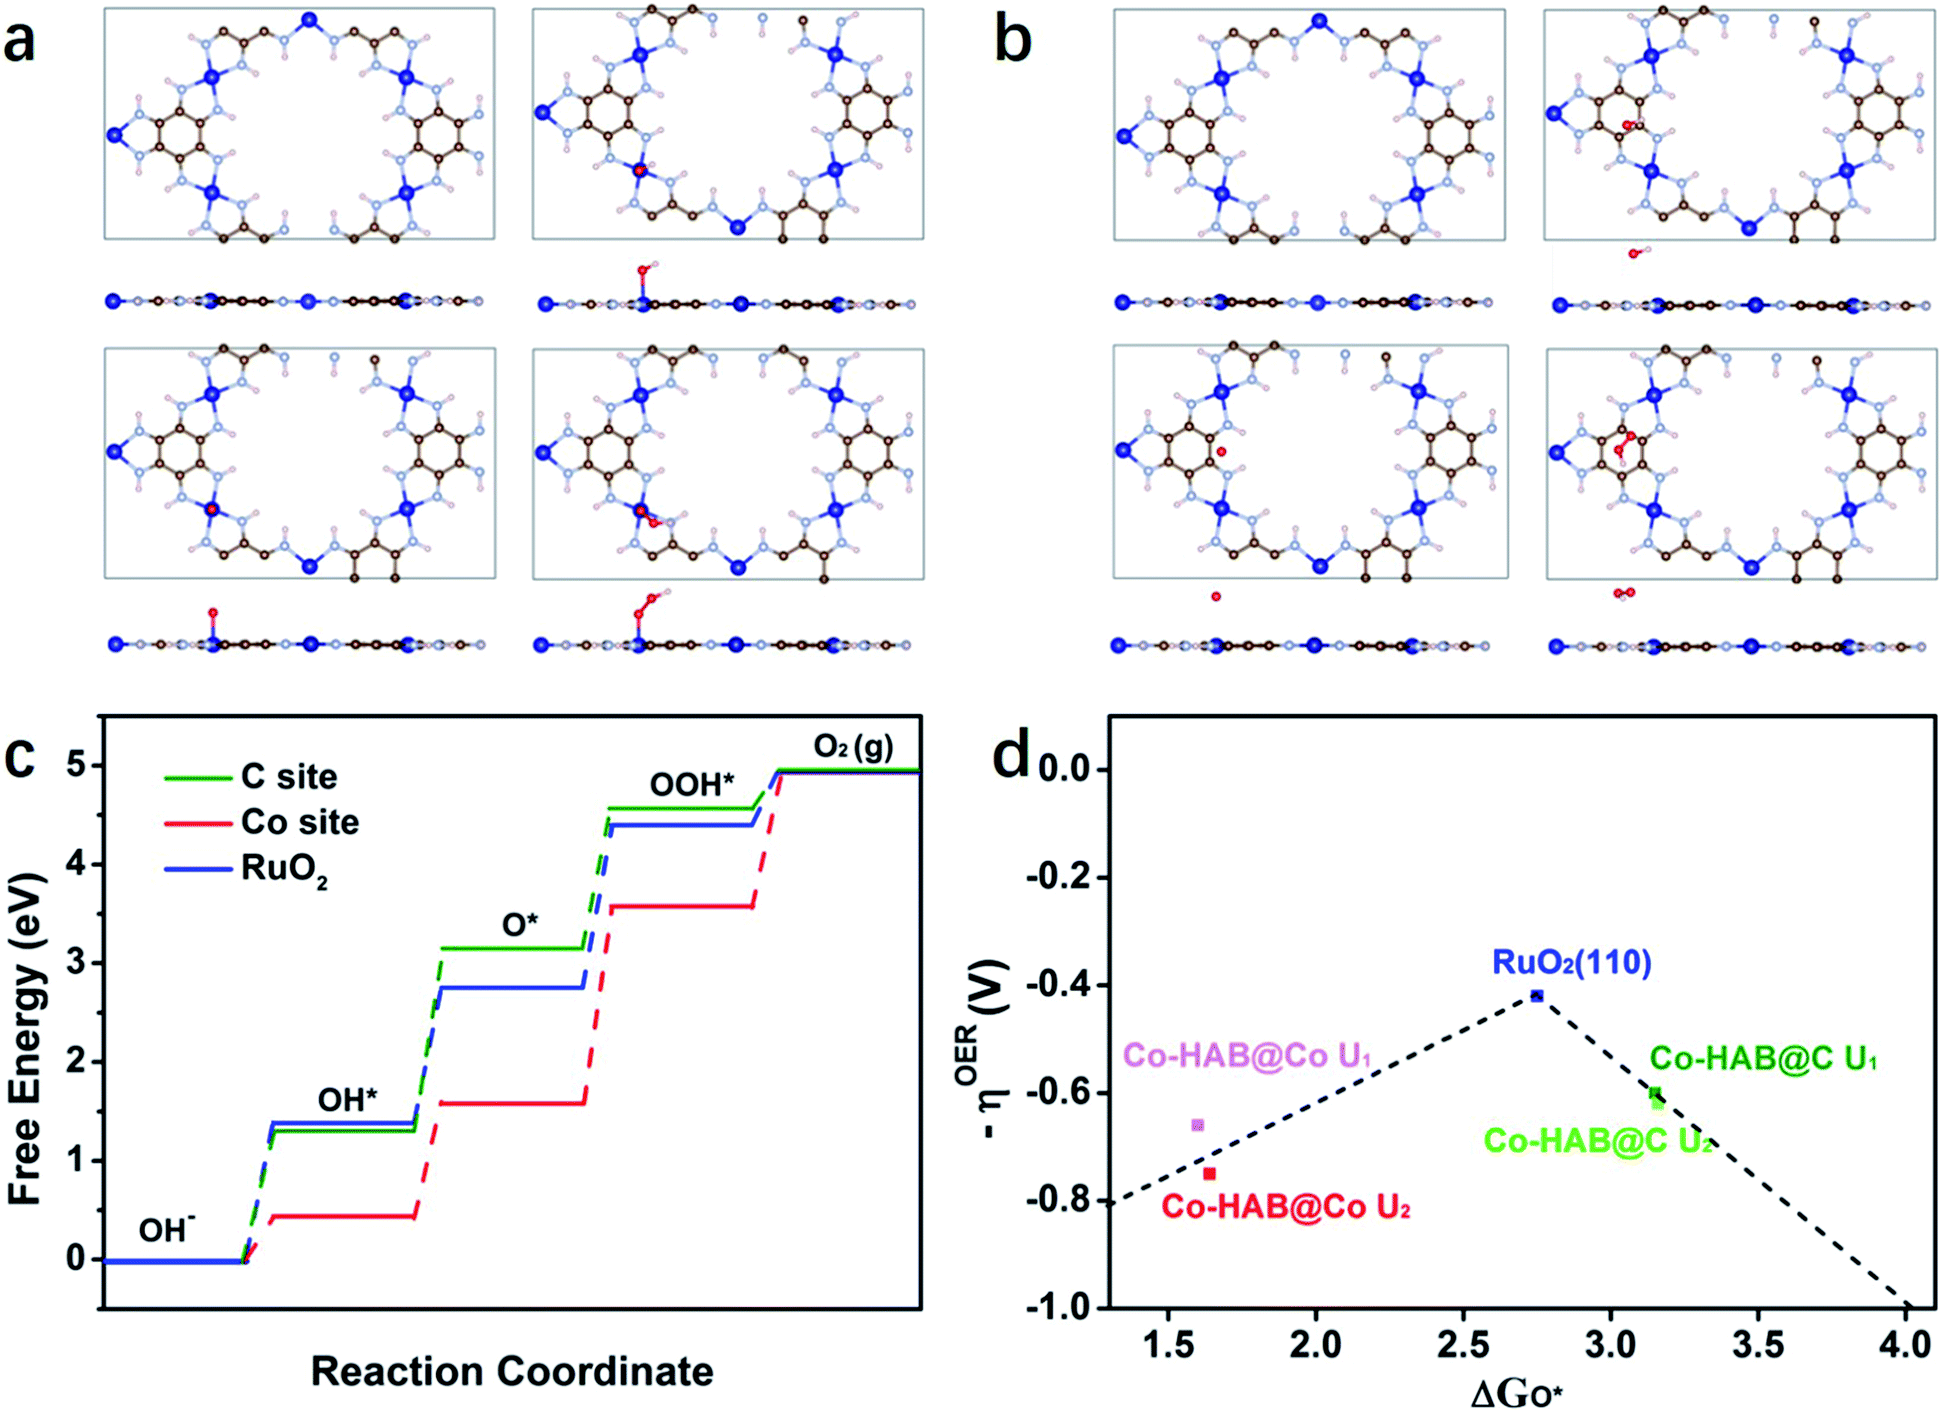 | ||
| Fig. 8 Top and side views of initial Co–HAB and configurations after the absorption of OER intermediates on (a) Co sites and (b) C sites. Grey, light blue, blue, red and white represent C, N, Co, O and H atoms, respectively. (c) Free energy diagram of the OER on Co–HAB and RuO2 (110) surfaces (U = 0). (d) Volcano profiles for the OER on Co–HAB and RuO2 (U1 = 0.4, U2 = 0.72). | ||
Conclusions
In summary, 2D Co–HAB-NSs with a thickness of about 4.5 nm were successfully synthesized in an aqueous solution and exhibited high activity for the OER and long term stability in alkaline electrolytes. The advantages of the ultrathin 2D layered structure endow Co–HAB-NSs with a high specific surface area and enhanced ECSA compared to bulk Co–HAB, and the strong π–d conjunction provides favorable channels to facilitate electron transfer. Confirmed by DFT computation, the comparable catalytic activity of the 2D ultrathin nanosheets with RuO2 is attributed to the cooperation of dense active sites.Experimental
Chemicals and materials
Ammonium hydroxide (NH4OH, 28–30%), N,N-dimethylformamide (C3H7NO, AR), potassium nitrate (KNO3, ≥99.5%), 4-nitroaniline and dimethyl sulfoxide (DMSO) were purchased from Aladdin. Cobalt nitrate hexahydrate (Co(NO3)2·6H2O, ≥99.0%) and sodium methylate (NaOMe, ≥98%) were obtained from Macklin, and perfluorosulfonic acid-PTFE copolymer (Nafion; 5% w/w) was purchased from Sigma. Acetone (CH3COCH3 ≥ 99.5%) was obtained from Shanghai Lingfeng chemical reagent. 2-Propanol (C3H8O, ≥99.5%) and potassium hydroxide were purchased from Meryer. 4-Amino-1,2,4-triazole (ATA) was obtained from Accela ChemBio Co., Ltd.Synthesis of catalysts
Moreover, we conducted additional experiments to determine whether the Co3O4 exists in the catalysts. First, the amount of NH4OH was increased to 218 mmol, and the as-obtained product was labeled NH4OH-final (other synthesis processes were the same as that of Co–HAB-NSs). The XRD pattern of NH4OH-final shows neither the characteristic peaks of Co(OH)2 nor the characteristic peaks of Co3O4 (Fig. S12†). Second, the feeding sequence was changed to verify the presence or absence of Co3O4. 218 mmol of NH4OH was first added into Co(NO)3, and then mixed with HAB. The as-obtained product was labeled NH4OH-first (other synthesis processes were the same as that of Co–HAB-NSs). The XRD pattern of NH4OH-first only shows the characteristic peak of Co(OH)2 at 19.05°, corresponding to the (001) planes of Co(OH)2. No characteristic peaks of Co3O4 were observed. Based on the above experimental results and XRD data, it is reasonable to rule out the possible presence of Co3O4.
Characterization of materials
X-ray powder diffraction (XRD) patterns were obtained on a Bruker D8 Advance diffractometer with Cu Kα (λ = 0.15406 nm) radiation and scanning angles (2θ) ranging from 5° to 40°. Fourier-transform infrared (FT-IR) spectra were recorded on a Bruker VECTOR 22 spectrometer. X-ray photoelectron spectroscopy (XPS, Thermo ESCALAB 250XI, Al Kα, hν = 1486.6 eV) was performed on an RBD-upgraded PHI-5000C ESCA system. The microstructures and morphologies of the as-prepared materials were analyzed by field emission scanning electron microscopy (FESEM, Quanta 400 FEG) and transmission electron microscopy (TEM, JEM2100F). The Brunauer–Emmett–Teller (BET) specific surface area measurements were conducted with nitrogen sorption isotherms at 77 K and the pore size distributions were calculated using the Barrett–Joyner–Halenda (BJH) model.Chemical stability test of Co–HAB-NSs and bulk Co–HAB
The catalysts (∼10 mg) were suspended in 5 mL of 0.05 M H2SO4 and 1 M KOH respectively for 5 h at room temperature. After washing with water and acetone, the catalysts were dried under vacuum for 3 h at 75 °C. Fourier-transform infrared spectroscopy and SEM were carried out to test the stability of the catalysts.Electrochemical measurements
The electrical conductivity of Co–HAB-NSs was measured by the four-point probe method at room temperature. The pellets (1 cm diameter; 300 μm thickness) for this measurement were prepared by pressing at 10 MPa for 30 s. The electrochemical measurements were conducted on an Auto Lab® PGSTAT302N electrochemical workstation in a conventional three-electrode system using 1 M aqueous KOH as the electrolyte. The reference electrode and counter electrode were an Ag/AgCl (with saturated KCl) electrode and Pt wire, respectively. 5.0 mg of the as-prepared catalyst was dispersed in 1 mL of Nafion solution (a mixture of H2O, isopropanol, and 5 wt% Nafion solution in a volume ratio of 10![[thin space (1/6-em)]](https://www.rsc.org/images/entities/char_2009.gif) :10:1) and the mixture was sonicated for 45 min to obtain a homogeneous ink. 20 μL of the ink was drop-cast on a polished glassy carbon rotating disk electrode (5 mm in diameter) to obtain a 0.5 mg cm−2 mass loading electrode. The potentials were standardized to the reversible hydrogen electrode (RHE) [ERHE = EAg/AgCl + 0.059 × pH + 0.198] unless otherwise stated. Cyclic voltammograms (CVs) were obtained with a scan rate of 50 mV s−1 and linear scan voltammograms (LSVs) were obtained with a scan rate of 5 mV s−1 at 1600 rpm. After twenty cycles of CV scan, chronopotentiometry at a specific potential for 10 h at a rotation rate of 1600 rpm was conducted to test the catalytic stability of the prepared materials. Electrochemical impedance spectra were obtained from 0.1 Hz to 100 kHz at open circuit voltage. Cyclic voltammograms (CVs) with scan rates from 30 to 80 mV s−1 were obtained to calculate Cdl. The current density at 1.05 V was plotted against the scan rate, and the plotted lines were linear fitted where the slope is twice Cdl.
:10:1) and the mixture was sonicated for 45 min to obtain a homogeneous ink. 20 μL of the ink was drop-cast on a polished glassy carbon rotating disk electrode (5 mm in diameter) to obtain a 0.5 mg cm−2 mass loading electrode. The potentials were standardized to the reversible hydrogen electrode (RHE) [ERHE = EAg/AgCl + 0.059 × pH + 0.198] unless otherwise stated. Cyclic voltammograms (CVs) were obtained with a scan rate of 50 mV s−1 and linear scan voltammograms (LSVs) were obtained with a scan rate of 5 mV s−1 at 1600 rpm. After twenty cycles of CV scan, chronopotentiometry at a specific potential for 10 h at a rotation rate of 1600 rpm was conducted to test the catalytic stability of the prepared materials. Electrochemical impedance spectra were obtained from 0.1 Hz to 100 kHz at open circuit voltage. Cyclic voltammograms (CVs) with scan rates from 30 to 80 mV s−1 were obtained to calculate Cdl. The current density at 1.05 V was plotted against the scan rate, and the plotted lines were linear fitted where the slope is twice Cdl.
Conflicts of interest
There are no conflicts to declare.Acknowledgements
This work was supported by the National Natural Science Foundation of China (Grant No. 51772156 and 51872144), Natural Science Foundation of Jiangsu Province (Grant No. BK20180019 and BK20171423), Fundamental Research Funds for the Central Universities (No. 30917015102 and No. 30918014103), the Advanced Research Project of The Professional Leader of Teachers in Jiangsu Higher Vocational Colleges (No. 2019GRFX008), Innovation Qinglan Project of Jiangsu Province and PAPD of Jiangsu.References
- K. S. Novoselov, A. K. Geim, S. V. Morozov, D. Jiang, Y. Zhang, S. V. Dubonos, I. V. Grigorieva and A. A. Firsov, Science, 2004, 306, 666–669 CrossRef CAS PubMed.
- K. S. Novoselov, A. K. Geim, S. V. Morozov, D. Jiang, M. I. Katsnelson, I. V. Grigorieva, S. V. Dubonos and A. A. Firsov, Nature, 2005, 438, 197–200 CrossRef CAS PubMed.
- A. K. Geim and K. S. Novoselov, Nanoscience and Technology: A Collection of Reviews from Nature Journals, 2010, pp. 11–19, DOI:10.1142/9789814287005_0002.
- G. Li, Y. Li, H. Liu, Y. Guo, Y. Li and D. Zhu, Chem. Commun., 2010, 46, 3256–3258 RSC.
- K. Srinivasu and S. K. Ghosh, J. Phys. Chem. C, 2012, 116, 5951–5956 CrossRef CAS.
- Q. Weng, X. Wang, X. Wang, Y. Bando and D. Golberg, Chem. Soc. Rev., 2016, 45, 3989–4012 RSC.
- Y. Song, D. Mandelli, O. Hod, M. Urbakh, M. Ma and Q. Zheng, Nat. Mater., 2018, 17, 894–899 CrossRef CAS PubMed.
- R. Yan, Y. Zhao, H. Yang, X.-J. Kang, C. Wang, L.-L. Wen and Z.-D. Lu, Adv. Funct. Mater., 2018, 28, 1802021 CrossRef.
- K. Adpakpang, S. M. Oh, D. A. Agyeman, X. Jin, N. Jarulertwathana, I. Y. Kim, T. Sarakonsri, Y.-M. Kang and S.-J. Hwang, Adv. Funct. Mater., 2018, 28, 1707106 CrossRef.
- S. Li, J. Chen, M. Cui, G. Cai, J. Wang, P. Cui, X. Gong and P. S. Lee, Small, 2017, 13, 1602893 CrossRef PubMed.
- P. Amo-Ochoa, L. Welte, R. González-Prieto, P. J. Sanz Miguel, C. J. Gómez-García, E. Mateo-Martí, S. Delgado, J. Gómez-Herrero and F. Zamora, Chem. Commun., 2010, 46, 3262–3264 RSC.
- Z. Lu, L. Qian, Y. Tian, Y. Li, X. Sun and X. Duan, Chem. Commun., 2016, 52, 908–911 RSC.
- J. Xie, H. Zhang, S. Li, R. Wang, X. Sun, M. Zhou, J. Zhou, X. W. D. Lou and Y. Xie, Adv. Mater., 2013, 25, 5807–5813 CrossRef CAS PubMed.
- D. Voiry, R. Fullon, J. Yang, C. de Carvalho Castro e Silva, R. Kappera, I. Bozkurt, D. Kaplan, M. J. Lagos, P. E. Batson, G. Gupta, A. D. Mohite, L. Dong, D. Er, V. B. Shenoy, T. Asefa and M. Chhowalla, Nat. Mater., 2016, 15, 1003 CrossRef CAS PubMed.
- F. Song and X. Hu, Nat. Commun., 2014, 5, 4477 CrossRef CAS PubMed.
- J.-C. Blancon, H. Tsai, W. Nie, C. C. Stoumpos, L. Pedesseau, C. Katan, M. Kepenekian, C. M. M. Soe, K. Appavoo, M. Y. Sfeir, S. Tretiak, P. M. Ajayan, M. G. Kanatzidis, J. Even, J. J. Crochet and A. D. Mohite, Science, 2017, 355, 1288–1292 CrossRef CAS PubMed.
- Q. Zhang, L. Chu, F. Zhou, W. Ji and G. Eda, Adv. Mater., 2018, 30, 1704055 CrossRef PubMed.
- R. Sakamoto, K. Hoshiko, Q. Liu, T. Yagi, T. Nagayama, S. Kusaka, M. Tsuchiya, Y. Kitagawa, W.-Y. Wong and H. Nishihara, Nat. Commun., 2015, 6, 6713 CrossRef CAS PubMed.
- M. G. Campbell, D. Sheberla, S. F. Liu, T. M. Swager and M. Dincă, Angew. Chem., Int. Ed., 2015, 54, 4349–4352 CrossRef CAS PubMed.
- L. Sun, M. G. Campbell and M. Dincă, Angew. Chem., Int. Ed., 2016, 55, 3566–3579 CrossRef CAS PubMed.
- C. Chakravarty, B. Mandal and P. Sarkar, Phys. Chem. Chem. Phys., 2016, 18, 25277–25283 RSC.
- B. Mortazavi, M. Shahrokhi, M. Makaremi, G. Cuniberti and T. Rabczuk, Materials Today Energy, 2018, 10, 336–342 CrossRef.
- S. Chen, J. Dai and X. C. Zeng, Phys. Chem. Chem. Phys., 2015, 17, 5954–5958 RSC.
- J.-H. Dou, L. Sun, Y. Ge, W. Li, C. H. Hendon, J. Li, S. Gul, J. Yano, E. A. Stach and M. Dincă, J. Am. Chem. Soc., 2017, 139, 13608–13611 CrossRef CAS PubMed.
- J. Park, M. Lee, D. Feng, Z. Huang, A. C. Hinckley, A. Yakovenko, X. Zou, Y. Cui and Z. Bao, J. Am. Chem. Soc., 2018, 140, 10315–10323 CrossRef CAS PubMed.
- J. Park, A. C. Hinckley, Z. Huang, D. Feng, A. A. Yakovenko, M. Lee, S. Chen, X. Zou and Z. Bao, J. Am. Chem. Soc., 2018, 140, 14533–14537 CrossRef CAS PubMed.
- D. Sheberla, L. Sun, M. A. Blood-Forsythe, S. Er, C. R. Wade, C. K. Brozek, A. Aspuru-Guzik and M. Dincă, J. Am. Chem. Soc., 2014, 136, 8859–8862 CrossRef CAS PubMed.
- R. Dong, M. Pfeffermann, H. Liang, Z. Zheng, X. Zhu, J. Zhang and X. Feng, Angew. Chem., Int. Ed., 2015, 54, 12058–12063 CrossRef CAS PubMed.
- M. Hmadeh, Z. Lu, Z. Liu, F. Gándara, H. Furukawa, S. Wan, V. Augustyn, R. Chang, L. Liao, F. Zhou, E. Perre, V. Ozolins, K. Suenaga, X. Duan, B. Dunn, Y. Yamamto, O. Terasaki and O. M. Yaghi, Chem. Mater., 2012, 24, 3511–3513 CrossRef CAS.
- X. Huang, P. Sheng, Z. Tu, F. Zhang, J. Wang, H. Geng, Y. Zou, C.-a. Di, Y. Yi, Y. Sun, W. Xu and D. Zhu, Nat. Commun., 2015, 6, 7408 CrossRef CAS PubMed.
- S. S. Shinde, C. H. Lee, J.-Y. Jung, N. K. Wagh, S.-H. Kim, D.-H. Kim, C. Lin, S. U. Lee and J.-H. Lee, Energy Environ. Sci., 2019, 12, 727–738 RSC.
- Y. Yao, S. Hu, W. Chen, Z.-Q. Huang, W. Wei, T. Yao, R. Liu, K. Zang, X. Wang, G. Wu, W. Yuan, T. Yuan, B. Zhu, W. Liu, Z. Li, D. He, Z. Xue, Y. Wang, X. Zheng, J. Dong, C.-R. Chang, Y. Chen, X. Hong, J. Luo, S. Wei, W.-X. Li, P. Strasser, Y. Wu and Y. Li, Nat. Catal., 2019, 2, 304–313 CrossRef CAS.
- Z. Yang, C. Zhao, Y. Qu, H. Zhou, F. Zhou, J. Wang, Y. Wu and Y. Li, Adv. Mater., 2019, 31, 1808043 CrossRef PubMed.
- H. J. Trodahl and A. Bittar, Adv. Mater., 2001, 13, 1031–1033 CrossRef CAS.
- K. L. Chopra, Thin Film Phenomena, New York, McGraw-Hill, 1969 Search PubMed.
- D. Feng, T. Lei, M. R. Lukatskaya, J. Park, Z. Huang, M. Lee, L. Shaw, S. Chen, A. A. Yakovenko, A. Kulkarni, J. Xiao, K. Fredrickson, J. B. Tok, X. Zou, Y. Cui and Z. Bao, Nat. Energy, 2018, 3, 30–36 CrossRef CAS.
- N. Lahiri, N. Lotfizadeh, R. Tsuchikawa, V. V. Deshpande and J. Louie, J. Am. Chem. Soc., 2017, 139, 19–22 CrossRef CAS PubMed.
- C. Hu and L. Dai, Adv. Mater., 2017, 29, 1604942 CrossRef PubMed.
- Y. Zhang, Q. Ma, S. Wang, X. Liu and L. Li, ACS Nano, 2018, 12, 4824–4834 CrossRef CAS PubMed.
- M. Li, L. Zhang, Q. Xu, J. Niu and Z. Xia, J. Catal., 2014, 314, 66–72 CrossRef CAS.
- F. Calle-Vallejo, J. I. Martínez and J. Rossmeisl, Phys. Chem. Chem. Phys., 2011, 13, 15639–15643 RSC.
- L. Zhang and Z. Xia, J. Phys. Chem. C, 2011, 115, 11170–11176 CrossRef CAS.
- P. Bazylewski, D. W. Boukhvalov, A. I. Kukharenko, E. Z. Kurmaev, A. Hunt, A. Moewes, Y. H. Lee, S. O. Cholakh and G. S. Chang, RSC Adv., 2015, 5, 75600–75606 RSC.
- I. S. Amiinu, X. Liu, Z. Pu, W. Li, Q. Li, J. Zhang, H. Tang, H. Zhang and S. Mu, Adv. Funct. Mater., 2018, 28, 1704638 CrossRef.
- N. S. McIntyre and M. G. Cook, Anal. Chem., 1975, 47, 2208–2213 CrossRef CAS.
- J. Wang, F. Xu, H. Jin, Y. Chen and Y. Wang, Adv. Mater., 2017, 29, 1605838 CrossRef PubMed.
- B. Eberle, E. Kaifer and H.-J. Himmel, Angew. Chem., Int. Ed., 2017, 56, 3360–3363 CrossRef CAS PubMed.
- X.-R. Wang, J.-Y. Liu, Z.-W. Liu, W.-C. Wang, J. Luo, X.-P. Han, X.-W. Du, S.-Z. Qiao and J. Yang, Adv. Mater., 2018, 30, 1800005 CrossRef PubMed.
- B. Eberle, E. Kaifer and H.-J. Himmel, Angew. Chem., Int. Ed., 2017, 56, 3360–3363 CrossRef CAS.
Footnote |
| † Electronic supplementary information (ESI) available: Theoretical methods and Fig. S1–S12. See DOI: 10.1039/c9ta10644h |
| This journal is © The Royal Society of Chemistry 2020 |