
Constructing a tunable defect structure in TiO2 for photocatalytic nitrogen fixation†
Guoqiang
Zhang
a,
Xun
Yang
 c,
Chuanxin
He
ab,
Peixin
Zhang
ab and
Hongwei
Mi
*ab
c,
Chuanxin
He
ab,
Peixin
Zhang
ab and
Hongwei
Mi
*ab
aCollege of Chemistry and Environmental Engineering, Shenzhen University, Shenzhen, Guangdong 518060, PR China. Email. E-mail: milia807@szu.edu.cn
bGuangdong Flexible Wearable Energy, Tools Engineering Technology Research Centre, Shenzhen University, Shenzhen, Guangdong 518060, PR China
cSchool of Physics, Zhengzhou University, Zhengzhou 450052, China
First published on 25th November 2019
Abstract
Photocatalytic systems capable of precisely regulating oxygen vacancy (OV) concentrations, which could help illuminate the effects of the OV concentration on N2 fixation activity, are still scarce. Here, we demonstrate that excessive OVs in TiO2, while increasing the adsorption activation capacity of N2 molecules, exhibit disappointing activity due to a decrease in charge separation efficiency. With optimized OV concentration, TiO2 can increase the charge separation efficiency 3-fold and show significant activation towards N2 molecules. The normalized N2 photofixation rate is 324.86 μmol h−1 g−1 (full spectrum) and the corresponding apparent quantum yield (AQY) under 365 nm illumination reaches 1.1%, which are relatively high levels compared to reports in the literature. The origin of this excellent activity is clearly attributable to the OV defect structures, which coordinate the charge separation efficiency and the dissociative adsorption capacity of N2. This work establishes the relationship between OV concentration and activity, and helps to construct a highly efficient nitrogen-fixing photocatalyst by optimizing the OV concentration.
Introduction
Photocatalytic nitrogen fixation is highly promising and possesses significant potential with regard to sustainable energy solutions compared to the industrial Haber–Bosch process, which is carried out under a high temperature (300–550 °C) and pressure (15–25 MPa).1–3 To drive its reactions, a photocatalyst must efficiently separate photogenerated carriers to minimize recombination and activate nitrogen molecules to enable their reaction with migrating photogenerated carriers.4 Unfortunately, due to the fast recombination of photogenerated carriers, most of these photocatalytic systems show disappointing activity. More than that, the rate-determining step of N2 fixation is the cleavage of the N![[triple bond, length as m-dash]](https://www.rsc.org/images/entities/char_e002.gif) N triple bond.5 The strong triple bond of nitrogen (bond energy: 941 kJ mol−1) is very stable and difficult to dissociate on the photocatalyst surface, which leads to a very low nitrogen fixation activity. It has remained a huge challenge to activate and split the highly stable NN bond for solar-driven N2 fixation. Therefore, there is an urgent need to explore and construct high-efficiency photocatalysts for nitrogen fixation.
N triple bond.5 The strong triple bond of nitrogen (bond energy: 941 kJ mol−1) is very stable and difficult to dissociate on the photocatalyst surface, which leads to a very low nitrogen fixation activity. It has remained a huge challenge to activate and split the highly stable NN bond for solar-driven N2 fixation. Therefore, there is an urgent need to explore and construct high-efficiency photocatalysts for nitrogen fixation.
Recently, building defects in semiconductor photocatalysts has attracted attention as an approach for furnishing abundant active sites to activate N2 molecules for challenging nitrogen fixation.6–9 Despite the strong NN triple bonds, they can be activated and weakened through the transfer of electrons into the antibonding orbital of N2 when absorbed on defect sites,10 which favors nitrogen molecules that then react with photogenerated electrons for the nitrogen reduction reaction. Zhang and co-workers first proposed that the oxygen vacancies (OVs) on the surface of BiOBr nanosheets can significantly improve the adsorption and activation of N2 molecules, resulting in the successful reduction of N2 to NH3 at normal temperatures and pressures.11 In addition, the OV-induced defect states can work as photoexcited electron acceptors to prevent electron/hole recombination, and facilitate the transfer of interfacial carriers from the photoexcited photocatalysts to pre-activated N2 on the OV sites. Zhao et al. reported that the photoelectric separation efficiency can be increased tenfold by introducing OVs onto rutile TiO2.12 Sun's group found that defective SrTiO3 can increase the charge separation efficiency by 5 times compared with common SrTiO3.13 The high charge separation efficiency is beneficial to more photogenerated carriers participating in N2 fixation reaction. Several defective inorganic and organic semiconductors have been used for N2 activation and photofixation, such as TiO2,5 Sb/TiO2,14 Cu–TiO2,15 Au/TiO2,16 g-C3N4,17,18 W18O49,19 MoO3,20 CuCr-LDH,21 BiOCl,22 BiOBr,11 Bi5O7Br4,23 Bi3O4Br,24 Bi2WO6,25 and Bi5O7I.26 However, systems capable of precisely regulating OV concentration which could help illuminate the effect of OV concentration on N2 fixation activity are still scarce. A series of continuously adjustable OVs can be achieved to tailor the electronic structure and together serve as surface charge separation centers and adsorption activation sites for N2 to further promote the N2 fixation activity.
Here we choose the most common TiO2 as a model photocatalyst to study the effect of OV concentration on nitrogen fixation activity. The OVs are constructed by a solid phase reduction with NaBH4, and their concentration can be precisely regulated by the reduction temperature (310–360 °C). We demonstrate that the reduced TiO2 with optimized OV concentration exhibits a 3-fold increase in charge separation efficiency and shows significant activation towards N2 molecules. Excessive OVs, while increasing the adsorption activation capacity of N2, exhibit disappointing activity due to a decrease in charge separation efficiency. The normalized N2 photofixation rate is 324.86 μmol h−1 g−1 (full spectrum), which is 3.85 times that of the original TiO2. It is immediately evident that the NH4+ production rate under a full spectrum and the AQY in this work are at a relatively high level. This work establishes the relationship between OV concentration and N2 fixation activity, and clarifies that the activity can be enhanced by optimizing the OV concentration to coordinate the charge separation efficiency and the dissociative adsorption capacity of N2.
Experimental
Chemicals and materials
Pluronic@F-127 (F127) and standard ammonia solution (1000 mg L−1 NH4+ in water) were purchased from Sigma-Aldrich. Tetrabutyl titanate (TBT, AR, 98%), ethanol (AR, 99.7%), hydrochloric acid (AR, 36–38%) and acetic acid (AR, 99.5%) were purchased from Beijing Chemical Reagent Company. NaBH4 (98%), hydrazine (80%) and 4-(dimethylamino) benzaldehyde (99%) were purchased from Aladdin Reagent Company. Methanol (AR, 99.5%) was purchased from Sinopharm Chemical Reagent Co., Ltd. All chemicals were used without any further purification.Synthesis of anatase TiO2
At room temperature, 8 g of F127, 11.5 mL of HCl, and 3.7 mL of acetic acid were dissolved in 150 mL of ethanol and then added to 30 mL of TBT. The mixture was agitated vigorously for 2 h, then subsequently evaporated at 100 °C in an electric oven for 12 h. Following this, the reaction was aged for 24 h. The as-prepared samples were annealed at 500 °C for 4 h at a heating rate of 2 °C min−1 to remove remaining organic impurities and finally the anatase TiO2 was obtained.Preparation of reduced TiO2
At room temperature, 2.0 g of anatase TiO2 powders were mixed with 2 g of NaBH4 and the mixtures were ground for 30 min. Then the mixtures were transferred into a glass bottle, and then heated to the designated temperature (310–360 °C) at a rate of 5 °C min−1 in a tubular furnace and maintained at this temperature for 30 min under an Ar atmosphere. After cooling down to room temperature, the samples were washed with distilled water several times to remove the remaining impurities and dried in an oven at 60 °C for 12 h. According to the temperature of the reduction treatment, we named the samples R-x (x refers to the reduction temperature).Characterization
Scanning electron microscope (SEM) images were measured on a JEOL JSM 4800F microscope. Transmission electron microscope (TEM) images were taken using a FEI Tecnai G2 F30 operated at 300 kV. The crystalline structure was recorded by using an X-ray diffractometer (XRD) (Bruker D8 Advance), using Cu Kα radiation (λ = 1.54056 A). The Brunauer–Emmett–Teller (BET) specific surface area was measured using an ASAP 2020 HD88 Surface Area and Pore Size Analyzer. The UV-Vis absorption spectra were recorded on a UV-2450 scanning spectrophotometer (Shimadzu). Fluorescence emission spectra were recorded on an FLS 9802 fluorescence spectrometer. X-ray photoelectron spectrum (XPS) analyses were performed on an ESCALAB 250Xi spectrometer with an Al-Kα (1486.6 eV) achromatic X-ray source. The EPR spectra were recorded using a Bruker EMX-8 spectrometer at 9.857 GHz at 100 K. The temperature-programmed desorption of N2 (N2-TPD) was tested with an Autosorb-iQ-C chemisorption analyser (Quantachrome, USA) with the temperature ranging from 0 to 773 K.Photocatalytic nitrogen fixation
50 mg of the photocatalyst was added and dispersed in 100 mL of solution (10 mL of methanol, 90 mL of deionized water) under ultra-sonication for 15 min. Then high-purity N2 was bubbled at a rate of 30 mL min−1. And then the system was closed and illuminated with a 300 W Xe lamp. All runs were conducted at ambient pressure and 25 °C. 2 mL of the solution was taken out for ammonia detection every 10 min during the illumination. The concentration of ammonia was detected by ion chromatography (Metrohm IC).AQY calculations of nitrogen fixation
The catalyst solution was irradiated by a 365 nm LED (2 W) for 1 h. The average intensity of irradiation was determined by an FZ-A spectroradiometer (Photoelectric Instrument Factory of Beijing Normal University). The AQY was calculated from the equation:
Quantification of hydrazine
The amount of hydrazine was measured based on the basis of the condensation of hydrazine with 4-(dimethylamino) benzaldehyde. The colored solutions formed had an absorption peak centered at 456 nm. A 0.1 mg mL−1 stock solution of hydrazine monohydrate was prepared in 0.05 M H2SO4 solution. The standard solutions were freshly prepared. A solution of colored reagent was prepared by dissolving 1.09 g of 4-(dimethylamino) benzaldehyde with a mixture of 5.5 mL of concentrated HCl solution and 54.5 mL of ethanol. 1 mL of different concentrations of hydrazine solutions were added to 4 mL colorimetric tubes. Then, these solutions were mixed with 1 mL of colored reagent and were set aside for 20 min for full color development.IPCE measurements
10 mg of the samples were dispersed in 100 mL of 0.2 mg mL−1 I2/acetone solution under ultrasonic treatment. A two-electrode process was used to deposit the samples at an applied potential of 30 V for 5 min. FTO glass substrates with a coated area of about 1 × 3 cm2 were used for both electrodes. Then, the deposited electrode was dried at 200 °C for 30 min to remove I2 residues. A conventional three electrode process was used to investigate the photoelectrochemical properties of samples in a quartz cell. An FTO photoanode with deposited samples, Hg/HgCl2, and a Pt foil electrode acted as the working electrode, reference electrode, and counter electrode, respectively. A 0.5 M Na2SO3 aqueous solution was used as the electrolyte. The photoanode was illuminated by a 300 W Xe lamp with a monochromator. The illuminated area was 1 × 1 cm2. The IPCE (incident photon-to-current conversion efficiency) was calculated from the following equation:
Surface photovoltage measurements
The surface photovoltage (SPV) measurement system consisted of a source of monochromatic light, a lock-in amplifier (SR 830-DSP) with a light chopper (SR 540) and a sample chamber. Monochromatic light was provided by a 300 W Xe lamp (Perfect Light Company Solaredge 700) and a monochromator (SBP500, Zolix). All measurements were operated at room temperature and under ambient pressure and samples were not pre-treated prior to the SPV measurement.In situ DRIFT measurements
In situ diffuse-reflectance infrared Fourier transform spectroscopy (DRIFTS) was performed on a Nicolet iS50 FT-IR spectrometer. The TiO2 catalyst was placed in the center of the reaction cell, followed by pumping out all gases with an ultrahigh vacuum pump. In our functional model, a layer of water molecules is necessary to provide protons. Before a large amount of molecular nitrogen was pumped to form a nitrogen atmosphere, it was pre-adsorbed on the surface by bubbling a small amount of water vapor. Finally, the full spectrum light was turned on and the IR signal was in situ collected through an MCT detector alongside the reaction the background spectrum was collected beforehand and automatically subtracted from the recorded spectrum.DFT theoretical calculations
All the calculations were performed using first-principles density functional theory (DFT)+U calculations with the exchange-correlation energy functional, which were described by a generalized gradient approximation with the Perdew–Burke–Ernzerhof (PBE) exchange-correlation function. A (1 × 1) surface was applied to test the thickness of the atomic layers of the slabs for all the models, which was implemented by the CASTEP code in which a plane-wave pseudopotential approach and ultrasoft pseudopotentials were employed for all the atoms with a kinetic energy cutoff of 520 eV. A Monkhorst–Pack mesh for anatase was generated with k-points of 2 × 4 × 1. To simulate N2 activation on the anatase surfaces, a (2 × 5) supercell was used and enabled by a VASP code in which the projector augmented wave (PAW) method represented the electron–ion interaction with a kinetic energy cutoff of 520 eV. During optimizations, the energy and force converged to 10−4 eV per atom and 0.01 eV Å−1, respectively. The k-points were 5 × 5 × 1 for the anatase (101) supercell.Results and discussion
Constructing a suitable concentration of OV defects can extend visible light harvesting and facilitate the charge separation process, thereby improving the photocatalytic efficiency. However, an excess amount of OVs may generate a deep energy level as a recombination center for photoproduced carriers. Large quantities of anatase TiO2 were prepared according to a sol–gel method by introducing a surfactant of F127 to control the particle sizes to below 50 nm. Subsequently, one-step solid phase reduction with NaBH4 was used to obtain reduced TiO2. Using the reducing properties of NaBH4, the OV concentration can be regulated by controlling the reaction temperature (310–360 °C). According to the reduction temperature, we named the samples R-x (x refers to the reduction temperature). The adjustable colours of these reduced TiO2 samples at different temperatures, as shown in Fig. 1a, gradually changed from white to light blue and finally to dark blue with an increase in the reduction temperature. The ultraviolet-visible diffuse reflectance spectra (UV-Vis DRS) are shown in Fig. 1b. Compared with the original anatase, a stronger absorption band in the visible-light region is present with a rise in the reaction temperature. These results are consistent with the colour changes in the samples (Fig. 1a). In addition, the visible light absorption may come from midgap states in the forbidden band, such as the OV defect band. The XPS valence-band analyses (Fig. S1†) indicate that the VB position was 1.74 eV below the Fermi level and did not change obviously before or after reduction. Therefore, we speculate that the OV defect band may be located below the CB, which is consistent with previous reports.12,13,27 The X-ray powder diffraction pattern (XRD, Fig. 1c) indicates a typical anatase phase of TiO2 (JCPDS no. 21-1272), and no additional diffraction peaks of other species are observed. However, a significantly wider and weaker main peak is shown with an increase in reduction temperature, which can be attributed to OVs, because of disorder-induced lattice strains and a decrease in crystallite dimension.27 | ||
| Fig. 1 Optical images (a), UV-vis DRS spectra (b) and XRD patterns (c) of anatase and reduced TiO2. | ||
The morphology of reduced TiO2 is represented by scanning electron microscopy (SEM) and transmission electron microscopy (TEM). Fig. S2† shows the FE-SEM images of the nanoparticles with significant agglomeration after the reduction. Low resolution TEM (Fig. 2a, c and e) and high resolution TEM images (HR-TEM, Fig. 2b and d) show that the reduced TiO2 are nanoparticles with a diameter of 20–50 nm and that 0.35 nm is the characteristic lattice fringe space of anatase TiO2 (101). Interestingly, we observed the apparently amorphous structure of the R-360 surface (Fig. 2f), which matches well with the changes in XRD. The Brunauer–Emmett–Teller (BET) surface area and pore size distribution are characterized using N2 adsorption–desorption isotherms (Fig. S3†). The original anatase exhibits BET surface area of 60.5 m2 g−1 calculated from the N2 adsorption–desorption curve. After reduction treatment, the BET surface areas exhibit a slight reduction caused by nanoparticle agglomeration and are measured to be 57.2 (R-340) and 56.4 m2 g−1 (R-360), respectively.
 | ||
| Fig. 2 TEM and HR-TEM images of anatase (a and b), R-340 (c and d) and R-360 (e and f). | ||
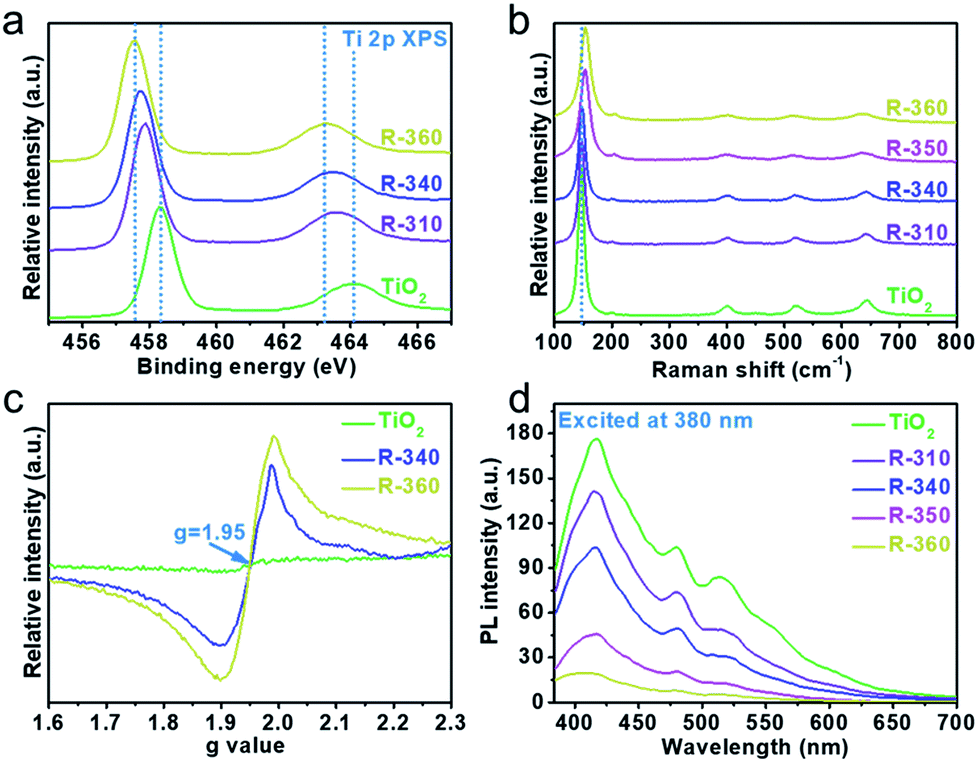
X-ray photoelectron spectroscopy (XPS) can furnish useful information regarding chemical binding and surface defects on the sample surfaces. The Ti 2p3/2 and Ti 2p1/2 peaks (Fig. 3a) show an obvious shift to low binding energies, indicating that Ti3+ doped TiO2 is formed and the OV concentration increases as the reaction temperature goes up. Raman spectroscopy (Fig. 3b) is further used to illustrate the formation of OVs. With the increase in OV concentration, the strongest Eg mode area at 144 cm−1 amplifies and exhibits a blue shift accompanied by peak broadening, compared with pristine TiO2. As reported in previous studies, the shift and broadening of the peaks can be ascribed to the decrease in crystal domain size and nonstoichiometry.28 Electron paramagnetic spectra (EPR) were recorded at 100 K to determine the presence of Ti3+. A strong EPR signal is observed at g = 1.95 (Fig. 3c), which could be assigned to Ti3+,29 thus confirming the existence of the OVs in the reduced sample. The presence of Ti3+ results from the reduction of Ti4+ by NaBH4. The photoluminescent peak intensity (Fig. 3d) of reduced TiO2 reveals a significant decrease compared with pristine TiO2, which indicates that these reduced TiO2 samples have a relatively low radiative recombination rate of photogenerated electrons and holes. This fluorescence quenching is derived from the capture of photogenerated carriers by OV defects. These characterizations strongly illustrate the presence of OVs and the concentration increases as the reduction temperature increases.
 | ||
| Fig. 3 High-resolution Ti 2p XPS (a), Raman (b), low temperature EPR (c) and steady-state photoluminescence (d) spectra of anatase and reduced TiO2. | ||
Successfully constructed reduced TiO2 photocatalysts featuring regulatable defect structures allow an exploration of their N2 fixation activity. The amount of NH4+ produced was determined using cation exchange chromatography (Fig. S4†). A Xe lamp was used for illumination, and a 420 nm cutoff filter was employed to obtain the visible light. Control experiments indicated that ammonia cannot be generated in the absence of any of the following: illumination, N2 or the reduced TiO2 photocatalyst (Fig. S5†). Fig. 4a and b show the N2 fixation and normalized N2 fixation rate of anatase and reduced TiO2. The amount of ammonia increases linearly with illumination (Fig. 4a). The normalized NH4+ production rate is 66.94 μmol h−1 g−1 for 50 mg of anatase. By increasing the reduction temperature of the TiO2 samples, the activity of NH4+ production is also increased. However, an excessive reaction temperature (350–360 °C) results in a high OV concentration and a decrease in NH4+ production rate. The appropriate concentration of OVs can be used as activation sites for nitrogen and separation centers for photogenerated carriers. Although the defect levels will weaken the reduction ability of photogenerated electrons, the activity of nitrogen fixation will be improved, as shown in the catalyst R-340. Excess OVs will become the recombination centers of photogenerated carriers and greatly reduce the reduction ability of photogenerated electrons, which has adverse effects on photocatalytic nitrogen fixation. The optimal reaction temperature is about 340 °C, the corresponding NH4+ production rate is 324.86 μmol h−1 g−1 (full spectrum, 50 mg), which are 3.85 and 5.37 times that of pristine TiO2 and Degussa P25 (Fig. S6†), respectively. Above all, R-340 shows obvious visible light activity at 2.21 μmol h−1 g−1, while no activity is shown for the original anatase. Fig. S7† shows the nitrogen fixation of R-340 in pure water, methanol/water and pure methanol. Compared with the activity in methanol/water, the activity was significantly improved under pure methanol conditions; while in pure water, the activity was very low. Considering that methanol is more easily oxidized by photogenerated holes than water, we think that the protons in ammonia may come mainly from methanol with a small part from water. The other potential reduction products, N2H4 and H2, were quantified by the 4-(dimethylamino) benzaldehyde spectrophotometric method (Fig. S8†) and GC, respectively. In this work, NH4+ was the only product without production of N2H4 and H2. The activity shows almost no reduction after six cycles of photocatalytic experiment, indicating that R-340 has good photostability under a full spectrum (Fig. 4c). The morphology (Fig. S9†) and color (Fig. S10†) of the R-340 sample before and after photocatalytic reaction show no obvious change, which further confirms its photostability. We observed that irradiation of R-340 using a 365 nm LED can induce N2 photofixation, with the apparent quantum yield (AQY) determined to be 1.1% at 365 nm. Table S1† compares photocatalytic data from the current study with previous data in the literature for N2 photofixation. It is immediately evident that the NH4+ production rate under a full spectrum and the AQY in this work are at a relatively high level. The origin of this excellent activity is clearly attributable to the OV defect structure and promotion of charge separation, visible light response and the activation of nitrogen molecules. Fig. 4d proposes a schematic diagram of photocatalytic N2 fixation. The reduced TiO2 is excited to generate photogenerated electrons and holes. Photoexcited electrons on the CB are then captured by the OV level below the CB. The N2 molecules are activated at OV sites and react with the trapped photogenerated electrons to form NH3. Photogenerated holes are consumed by the CH3OH sacrificial agent.
 | ||
| Fig. 4 The full-spectrum N2 fixation (a) and normalized N2 fixation rate (b) data for anatase and reduced TiO2. Recycling measurements of N2 fixation for R-340 under full-spectrum irradiation (c). A schematic diagram of photocatalytic N2 fixation (d). 50 mg of sample was dispersed in 100 mL of 10 vol% methanol solution under full-spectrum and visible-light irradiation for N2 fixation, respectively. | ||
In order to track the activation of N2, in situ diffuse reflectance infrared Fourier transform spectroscopy (DRIFTS) was used to detect intermediate products on the R-340 surface (Fig. 5). This highly sensitive spectroscopic technique allows the time-dependent transition of functional groups on the catalyst surface in a wet nitrogen flow to be studied under a full spectrum. Several absorption bands gradually strengthen with an increase in irradiation time from 0 to 160 min. The predominant overlapped absorption peaks ranging from 3600 to 2996 cm−1 were ascribed to the ν(N–H) stretching mode of NH3 and the ν(O–H) stretching mode of surface OH groups or adsorbed H2O, respectively;16 while the two absorption peaks at 1700 and 1649 cm−1 were attributed to the σ(N–H) bending mode.23 Furthermore, the sharp peaks at 1397 cm−1 and the weak peaks at 2876 and 1499 cm−1 were assigned to the representative absorptions of NH4+ and NH3 molecules, respectively. In addition, another broad and weak peak located at 2108 cm−1 was produced from the chemisorbed N2. The wavenumber is shorter than the stretching wavenumber of free N2 molecules (ν(gaseous N2) = 2331 cm−1) and larger than that of hydrazine (H2N = NH2) (1111 cm−1), showing that the NN triple bond has weakened and the bond length has increased.30 Fig. S11† shows the in situ DRIFTS in the N2 fixation reaction of anatase TiO2. In sharp contrast to R-340, the positions of all the peaks changed slightly. Moreover, the peak of nitrogen chemisorption at 2108 cm−1 can hardly be observed, and the representative absorptions (1392, 2886 and 1496 cm−1) of NH4+ and NH3 molecules are obviously weakened. These results show that OVs can activate nitrogen molecules and promote the formation of ammonia.
 | ||
| Fig. 5 In situ DRIFTS spectra detected as a function of time for the N2 fixation reaction on R-340. | ||
To verify the source of the ammonia from N2 in our system, the photocatalytic N2 reduction reaction was conducted with isotope-labeled 15N2 gas.5,15 100 mg of R-340 was dispersed in 100 mL of a methanol sacrificial solution and bubbled with Ar gas for 30 min. Thereafter, 50 mL of 15N2 was injected into the closed reactor under full-spectrum irradiation for 10 h. A control experiment was performed by injecting 50 mL of high-purity 14N2. Phenol solutions were added with NaClO as an oxidizing reagent and Na2[Fe(CN)5NO] as a catalyst. The resulting product 15NH4+ was monitored according to the indophenol blue method, and further confirmed via liquid chromatography-mass spectroscopy (LC-MS). Both solutions presented an obvious absorption peak at 660 nm belonging to indophenol (Fig. 6a), and no peak appeared for either solution without light irradiation. Fig. 6b and c show the MS spectra of the indophenol solution from 14N2 and 15N2. The 14N2 solution revealed two peaks at m/z 198 and m/z 199, which were attributed to the indophenol anion. Further, the 15N![[thin space (1/6-em)]](https://www.rsc.org/images/entities/char_2009.gif) :14N abundance ratio was significantly higher when 15N2 was adopted as a nitrogen source. This test thus verifies that N2 was the origin of NH4+ in the photocatalytic reaction.
:14N abundance ratio was significantly higher when 15N2 was adopted as a nitrogen source. This test thus verifies that N2 was the origin of NH4+ in the photocatalytic reaction.
 | ||
| Fig. 6 The UV-vis absorption spectra of the solutions from N2 reduction with 14N2 or 15N2 gas followed by an indophenol assay (a). MS spectra of obtained indophenol solutions from 14N2 (b) and 15N2 (c). | ||
As aforementioned, the OV-induced defect states can work as photoexcited electron acceptors to prevent electron/hole recombination, and facilitate interfacial carrier transfer from the photoexcited photocatalysts to pre-activated N2 on the OV sites. To further confirm this point of view, surface photovoltage spectroscopy (SPS), incident photon conversion efficiency (IPCE) measurement, N2 temperature-programmed desorption (N2-TPD) and steady-state photoluminescence (PL) spectroscopy were adopted. SPS is a powerful tool to further characterize charge separation at the nanoscale.13,31Fig. 7a show the surface photovoltage (SPV) response of the original anatase, R-340 and R-360. A positive SPV response band in the range of 320–400 nm is detected, which is ascribed to the electron transition from VB to CB. The SPV response in R-340 is ∼3 times that of the original anatase, revealing a dramatic increase in charge separation efficiency. However, R-360 exhibits a significantly reduced SPV intensity and weak charge separation. The IPCE measurement (Fig. 7b) clearly shows that the conversion efficiency of the R-340 sample at 300 nm is approximately 10.9%, which is about a 2-fold increase compared to the original anatase. In case of R-360 sample, the conversion efficiency at 300 nm is only 1.3%. These results indicate that the OV-induced defect states can work as photoexcited electron acceptors to prevent electron/hole recombination, and promote charge separation; while excessive OVs act as recombination centres for photogenerated carriers, resulting in a decrease in charge separation efficiency, which corresponds to the decrease in nitrogen fixation activity shown in Fig. 4a and b. The N2 temperature-programmed desorption (N2-TPD, Fig. 7c) was used to study the adsorption and activation capacity of N2. The pristine TiO2 may contain trace OV defects itself due to the low formation energy of OVs, and the high surface energy and large specific surface area of ∼50 nm of TiO2. All samples exhibited two N2 desorption peaks at 130 and 365 °C, which were related to physical and chemical adsorption, respectively. With the increase in OV concentration, the adsorption and activation capacity of N2 becomes stronger and stronger. This result shows that N2 chemisorption occurs on OV sites, which is mainly caused by electron transfer from OVs into the antibonding orbital of N2 when absorbed on defect sites.11 This activation process favors nitrogen molecules that then react with photogenerated electrons for the nitrogen reduction reaction. Photoluminescence tests under different atmospheres (vacuum, argon and nitrogen) were used to investigate the activation behaviour of N2 over OVs (Fig. 7d). Under an Ar atmosphere or vacuum, the R-340 presented a broader and more intense peak centred at about 420 nm compared to that under an N2 atmosphere. Since the electrons captured at OV sites are usually in a metastable state, the quenching of the PL spectrum under an N2 atmosphere may be due to the non-radiative transfer of captured electrons to the anti-bond orbital of adsorbed N2.11 This process greatly promoted the adsorption and dissociation of nitrogen molecules.
 | ||
| Fig. 7 The SPS (a) and IPCE (b) measurements of original anatase, R-340 and R-360. The N2 TPD (c) data from original anatase, R-340 and R-360. Photoluminescence spectra under different atmospheres (vacuum, argon and nitrogen) of R-340 (d). | ||
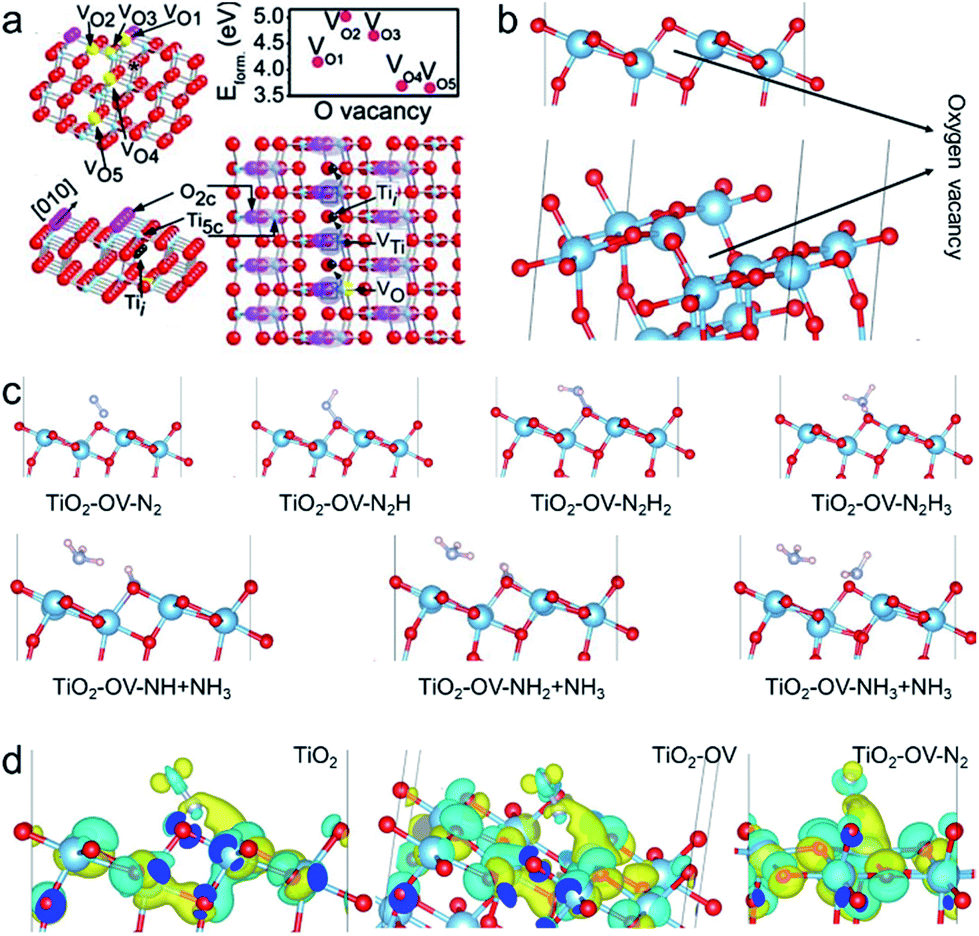
Density functional theory (DFT) calculations were employed to examine the possible N2 activation on anatase TiO2 (101) facets without and with OV. The OV energy of the anatase (101) crystal face is lowest in the secondary outer layer, so this configuration was also adopted in our calculations, as shown in Fig. 8a and b. Fig. 8c shows the theoretical calculation of each step of the photocatalytic nitrogen fixation. The chemisorption of N2 on anatase (101) facets without OV was excluded due to their weak interactions. The OVs can adsorb and activate N2 by transporting the available localized electrons back to the π antibonding orbital of N2, while the activated N2 with a negative charge greatly promotes the Lewis acid–base reaction activity at OV sites.22 As expected, after generating an OV on the surface, N2 could be adsorbed on the OV through combining with the two nearest Ti atoms in the sublayer to form a terminal end-on bound structure. Since the N2 fixation sites are diverse in the photocatalytic reactions, the model of an N2 molecule on a Ti atom far away from OVs was considered. Due to the weak adsorption energy, the chemisorption of the N2 molecule was excluded. The activation of the NN bond on the OV can be inferred via the NN bond length increasing to 1.138 Å, which is between the triple bond length (1.113 Å) of free N2 and the double bond length (1.254 Å) of diazene (Fig. S12†). In addition, the adsorption energy was entirely negative during the whole process, indicating it is thermodynamically feasible for nitrogen fixation (Fig. S13†). Bader charge simulation and differential charge density were used to further explain the activation of nitrogen molecules at OV sites. As shown in Fig. 8d, the Ti atoms near the OVs accumulate more electrons, and these localized electrons are transferred to the adsorbed N2 molecule. The number of electrons accumulated on the N2 molecule increases, making the NN bond longer. Such interesting activation of the N2 molecule can be found in many transition metal–N2 complexes, in which the transitional metals (metal = Fe, Mo, Ru and Co) donate their available d-orbital electrons into the π NN antibonding system to activate the –N2 ligand.
 | ||
| Fig. 8 O-vacancy configuration of the (101)-crystal facet outer layer of anatase phase TiO2 (a and b). Theoretical calculations of each step of photocatalytic nitrogen fixation (c). Bader charge simulation and differential charge density data (d). | ||
Conclusions
In summary, we have successfully designed and constructed a series of continuously adjustable defect structures on TiO2. On one hand, an optimized concentration of OVs as electron acceptors can increase the charge separation efficiency 3-fold, while excessive OVs will result in a decrease in charge separation. On the other hand, N2 adsorbed on OVs can be dissociated and activated through the transfer of electrons into the antibonding orbital of N2, thus weakening the strong triple bond. In addition, the greater the concentration of OVs, the stronger the adsorption and activation behaviours of N2. The defect structures were confirmed via XRD, TEM, XPS, Raman, EPR and PL studies, and the OV effects on N2 fixation activity were also fully investigated according to SPV, IPCE, PL, N2 TPD and DFT calculations. Finally, we further observed the formation of ammonia on the catalyst surface and the source of N via in situ DRIFTS and isotope-labeled 15N2. Our results presented herein provide new insights into the construction of efficient nitrogen-fixing photocatalysts via optimizing the OV concentration to coordinate the charge separation efficiency and dissociative adsorption capacity of N2.Conflicts of interest
There are no conflicts to declare.Acknowledgements
This work was jointly supported by the Science and Technology Project of the Research Foundation of China Postdoctoral Science (2018M630982) and the Natural Science Foundation of China (51874199, 21601126). The computation experiments used the resources of the National Supercomputing Center in Shenzhen.Notes and references
- T. Rayment, R. Schlögl, J. Thomas and G. Ertl, Nature, 1985, 315, 311–313 CrossRef CAS.
- C. J. Van der Ham, M. T. Koper and D. G. Hetterscheid, Chem. Soc. Rev., 2014, 43, 5183–5191 RSC.
- D. E. Canfield, A. N. Glazer and P. G. Falkowski, Science, 2010, 330, 192–196 CrossRef CAS.
- G. Liu, H. G. Yang, J. Pan, Y. Q. Yang, G. Q. Lu and H.-M. Cheng, Chem. Rev., 2014, 114, 9559–9612 CrossRef CAS.
- H. Hirakawa, M. Hashimoto, Y. Shiraishi and T. Hirai, J. Am. Chem. Soc., 2017, 139, 10929–10936 CrossRef CAS.
- M. Cheng, C. Xiao and Y. Xie, J. Mater. Chem. A, 2019, 7, 19616–19633 RSC.
- J. Li, H. Li, G. Zhan and L. Zhang, Acc. Chem. Res., 2016, 50, 112–121 CrossRef PubMed.
- S. Bai, N. Zhang, C. Gao and Y. Xiong, Nano Energy, 2018, 53, 296–336 CrossRef CAS.
- M. Li, H. Huang, J. Low, C. Gao, R. Long and Y. Xiong, Small Methods, 2019, 3, 1800388 CrossRef.
- K. C. MacLeod, D. J. Vinyard and P. L. Holland, J. Am. Chem. Soc., 2014, 136, 10226–10229 CrossRef CAS.
- H. Li, J. Shang, Z. Ai and L. Zhang, J. Am. Chem. Soc., 2015, 137, 6393–6399 CrossRef CAS.
- Z. Zhao, X. Zhang, G. Zhang, Z. Liu, D. Qu, X. Miao, P. Feng and Z. Sun, Nano Res., 2015, 8, 4061–4071 CrossRef CAS.
- G. Zhang, W. Jiang, S. Hua, H. Zhao, L. Zhang and Z. Sun, Nanoscale, 2016, 8, 16963–16968 RSC.
- Z. Zhao, S. Hong, C. Yan, C. Choi, Y. Jung, Y. Liu, S. Liu, X. Li, J. Qiu and Z. Sun, Chem. Commun., 2019, 55, 7171–7174 RSC.
- Y. Zhao, Y. Zhao, R. Shi, B. Wang, G. I. Waterhouse, L. Z. Wu, C. H. Tung and T. Zhang, Adv. Mater., 2019, 31, 1806482 CrossRef.
- J. Yang, Y. Guo, R. Jiang, F. Qin, H. Zhang, W. Lu, J. Wang and J. C. M. Yu, J. Am. Chem. Soc., 2018, 140, 8497–8508 CrossRef CAS.
- G. Dong, W. Ho and C. Wang, J. Mater. Chem. A, 2015, 3, 23435–23441 RSC.
- Y. Kofuji, Y. Isobe, Y. Shiraishi, H. Sakamoto, S. Tanaka, S. Ichikawa and T. Hirai, J. Am. Chem. Soc., 2016, 138, 10019–10025 CrossRef CAS PubMed.
- N. Zhang, A. Jalil, D. Wu, S. Chen, Y. Liu, C. Gao, W. Ye, Z. Qi, H. Ju and C. Wang, J. Am. Chem. Soc., 2018, 140, 9434–9443 CrossRef CAS PubMed.
- Y. Li, X. Chen, M. Zhang, Y. Zhu, W. Ren, Z. Mei, M. Gu and F. Pan, Catal. Sci. Technol., 2019, 9, 803–810 RSC.
- Y. Zhao, Y. Zhao, G. I. Waterhouse, L. Zheng, X. Cao, F. Teng, L. Z. Wu, C. H. Tung, D. O'Hare and T. Zhang, Adv. Mater., 2017, 29, 1703828 CrossRef.
- H. Li, J. Shang, J. Shi, K. Zhao and L. Zhang, Nanoscale, 2016, 8, 1986–1993 RSC.
- S. Wang, X. Hai, X. Ding, K. Chang, Y. Xiang, X. Meng, Z. Yang, H. Chen and J. Ye, Adv. Mater., 2017, 29, 1701774 CrossRef.
- J. Di, J. Xia, M. F. Chisholm, J. Zhong, C. Chen, X. Cao, F. Dong, Z. Chi, H. Chen and Y. X. Weng, Adv. Mater., 2019, 1807576 CrossRef PubMed.
- S. Zhou, C. Zhang, J. Liu, J. Liao, Y. Kong, Y. Xu and G. Chen, Catal. Sci. Technol., 2019, 9, 5562–5566 RSC.
- Y. Bai, L. Ye, T. Chen, L. Wang, X. Shi, X. Zhang and D. Chen, ACS Appl. Mater. Interfaces, 2016, 8, 27661–27668 CrossRef CAS.
- H. Tan, Z. Zhao, M. Niu, C. Mao, D. Cao, D. Cheng, P. Feng and Z. Sun, Nanoscale, 2014, 6, 10216–10223 RSC.
- Z. Wang, C. Yang, T. Lin, H. Yin, P. Chen, D. Wan, F. Xu, F. Huang, J. Lin and X. Xie, Adv. Funct. Mater., 2013, 23, 5444–5450 CrossRef CAS.
- F. Zuo, K. Bozhilov, R. J. Dillon, L. Wang, P. Smith, X. Zhao, C. Bardeen and P. Feng, Angew. Chem., Int. Ed., 2012, 51, 6223–6226 CrossRef CAS.
- H.-P. Jia and E. A. Quadrelli, Chem. Soc. Rev., 2014, 43, 547–564 RSC.
- L. Kronik and Y. Shapira, Surf. Sci. Rep., 1999, 37, 1–206 CrossRef CAS.
Footnote |
| † Electronic supplementary information (ESI) available: Additional SEM, BET, and photocatalysis data and DFT studies. See DOI: 10.1039/c9ta10471b |
| This journal is © The Royal Society of Chemistry 2020 |