 Open Access Article
Creative Commons Attribution 3.0 Unported Licence
High antisite defect concentrations in hard-sphere colloidal Laves phases†
Berend
van der Meer
 a,
Frank
Smallenburg
 b,
Marjolein
Dijkstra
a and
Laura
Filion
 *a
*a
aSoft Condensed Matter, Debye Institute for Nanomaterials Science, Utrecht University, Princetonplein 5, 3584 CC Utrecht, The Netherlands. E-mail: L.C.Filion@uu.nl
bUniversité Paris-Saclay, CNRS, Laboratoire de Physique des Solides, 91405 Orsay, France
First published on 2nd April 2020
Abstract
Binary mixtures of hard spheres can spontaneously self-assemble into binary crystals. Computer simulations have been especially useful in mapping out the phase behaviour of these mixtures, under the assumption that the stoichiometry of the binary crystal is ideal. Here we show that for a size ratio of q = 0.82 this assumption is not valid near the coexistence region between the fluid and the stable binary crystal, the MgZn2 Laves phase. Instead we find a surprisingly high number of antisite defects: up to 2% of the large spheres are replaced by small spheres in equilibrium. We demonstrate that the defect concentration can be estimated using simple approximations, providing an easy way to identify systems where antisite defects play an important role. Our results shed new light on the self-assembly of colloidal Laves phases, and demonstrate the importance of antisite defects in binary crystals.
1 Introduction
In equilibrium, all crystals are marred by a small concentration of point defects, such as vacancies and interstitials. These defects strongly affect the optical and mechanical properties of crystalline materials, and are the main agents for transport in crystals. In systems of more than one component, in addition to vacancies and interstitials, new forms of point defects arise: a lattice site of one species can be filled by a particle of another species, creating a so-called “antisite” defect.1 Such defects are most likely to occur when two species of particle in the crystal have very similar interactions, such that one easily “fits” on a mismatched lattice site. On the atomic scale, antisite defects often occur in alloys, and play an important role in e.g. the electronic properties of semiconductors such as GaAs.2 However, when predicting colloidal phase behavior, antisite defects have, until now, been ignored.3–8 This is particularly surprising since colloidal interactions, which are typically short-ranged and weak in comparison to the thermal energy scale, are ideal for the formation of antisite defects.Here, we explore the effect of antisite defects on the phase diagram of a binary hard-sphere mixture. Binary hard-sphere mixtures are perhaps the simplest possible model for studying binary crystal structures, and have been instrumental in understanding the phase behavior of colloidal systems.3–31 The equilibrium phase diagrams of binary hard-sphere mixtures for various size ratios have been extensively explored using simulations,3–8,11,22,31 revealing a number of stable binary crystal structures. However, even for this classical colloidal system, antisite defects have not been considered. Here, we focus our attention on binary hard spheres with a size ratio of  , where σS(L) is the diameter of the small (large) particles. For this size ratio, previous studies have concluded that the phase diagram contains a binary fluid phase, single-component face-centered-cubic (FCC) crystals of both the large and small particles, and a binary crystal phase. The stable binary crystal is the MgZn2 Laves phase, with two other Laves phases, MgCu2 and MgNi2 closely competing.8 Note that these phases are very similar and differ by the stacking of the large particles. As the MgZn2 phase has been shown to be the most stable one, we will focus on it in this paper, and in the following use the terms MgZn2 Laves phase and Laves phase interchangeably.
Of all stable binary hard-sphere crystal structures, MgZn2 occurs for size ratios closest to 1, suggesting that switching out a particle in the crystal with one of the opposite species carries a relatively low free-energy cost. Hence, this structure is a prime candidate for exploring the effect of antisite defects on equilibrium phase behavior. Moreover, colloidal Laves phases have drawn considerable attention, due to the interesting photonic properties of the sublattices of the MgCu2 phase.7,32 Such properties could be affected by the presence of defects.
In this study, we use Monte Carlo simulations and thermodynamic integration to calculate the free energy of FCC and MgZn2 hard-sphere crystals as a function of the antisite defect concentration. Combining this free energy with that of the fluid, we predict the equilibrium phase behavior. The new phase diagram differs significantly from the phase diagram calculated without taking defects into account:8 while in the defect-free phase diagram, the Laves phase was only stable at the ideal composition, in the new phase diagram, the Laves phase covers a range of compositions, all of which correspond to a higher fraction of small particles than in the perfect crystal. This correction arises from a significant concentration of antisite defects, with up to 2% of the large-particle lattice sites occupied by a small particle. This defect concentration is orders of magnitude higher than the vacancy and interstitial defect concentrations found in monodisperse hard-sphere crystals.33,34 Finally, we demonstrate that the defect concentration can be estimated using simple approximations, providing a fast and easy way to identify systems where antisite defects play an important role.
2 Free energy of antisite defects
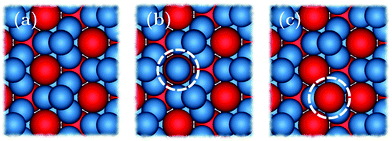
We begin by considering the impact of antisite defects on the free energy of the MgZn2 hard-sphere crystal. In the ideal MgZn2 crystal (see Fig. 1(a)), there is one large particle (denoted L) for every two small particles (S), and each particle is on a lattice site corresponding to its own species. In principle, however, the free energy of the crystal will be minimized when there are a finite number of local mistakes, including vacancies, interstitials and antisite defects. Previous studies of hard-sphere systems have found (at least in the case of single-component crystals), that the equilibrium concentration of vacancies and interstitials is very small. Specifically, for hard spheres near melting, the concentration of vacancies and interstitials is predicted to be 10−4 and 10−8, respectively.33–35 Here, we focus on the possibility of antisite defects. Using Kröger–Vink notation, we denote a small particle occupying a large-particle lattice site as SL and a large particle occupying a small-particle lattice site as LS. Fig. 1(b) and (c) shows illustrations of both types of defects.We now consider the Helmholtz free energy of a binary crystal with M lattice sites, N particles, volume V, and temperature T. Assuming the defects do not interact, the total free energy Ftot of a crystal containing NSL and NLS antisite defects of type SL and LS, respectively, can be written as
 | (1) |
 | (2) |
 and
and  the number of large-particle and small-particle lattice sites, respectively, and β = 1/kBT with kB Boltzmann's constant. Note that we ignore the possibility of defects other than antisite defects (such as vacancies or interstitials), as these are known to be extremely rare in hard-sphere crystals.33,34
The free energy per particle of the defect-free crystal can be obtained for any given density ρM using
 | (3) |
We calculate fSL and fLS using Monte Carlo simulations in the canonical ensemble. In addition to standard Monte Carlo moves, we allow a single particle to fluctuate in size. We start off by initializing an ideal MgZn2 crystal, and assign all particles to their corresponding lattice site. In order to prevent the spontaneous creation of additional defects, we confine the particles to their Wigner–Seitz cell by rejecting any particle move that will cause the center-of-mass of the particle to be closer to any other lattice point than its own.39,40 This allows us to measure the free energy of a single antisite defect at a specific lattice site in a defect-free environment. Importantly, restricting the particles to their Wigner–Seitz cells has a minimal effect on the accessible phase space, mainly preventing the formation of additional interstitial-vacancy pairs. As shown in the ESI,† this has no measurable effect on the equation of state, and hence negligible effect on the free energy.
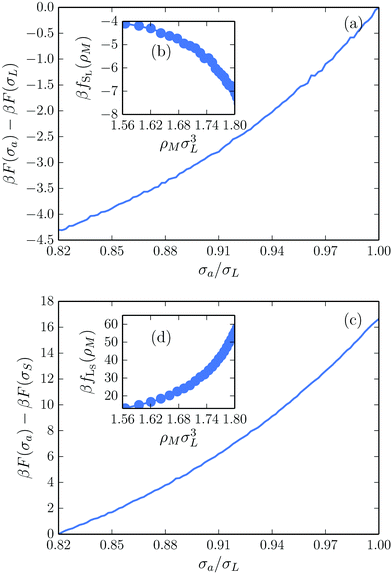
Focusing first on the SL-defect, we allow a single large particle in the crystal to fluctuate in size during the simulation. This allows us to measure the change in free energy associated with changing the size of this specific particle. The free-energy difference ΔF(σa,σL) between a crystal with a particle of actual size σa and its nominal size σL at a specific lattice site is directly related to the probability P(σa) of observing that size in the simulation:33
 | (4) |
We can extract fSL for a range of densities, as summarized in Fig. 2(b). For the LS-defect, we repeat the same process but allow a small particle to fluctuate in size, with the results plotted in Fig. 2(c) and (d). It should be noted that the small particles in the MgZn2 lattice appear in two different local environments, which in principle correspond to different free-energy costs fLS. However, since our calculations show that fLS is nearly identical for the two local environments, we ignore this distinction here.
As one might expect, the free-energy cost of shrinking a large particle is negative, while the cost of growing a small particle is positive: the pressure of the surrounding particles favors the shrinking of any particle in the crystal. Moreover, the cost of creating an LS-defect is much higher than the gain of creating an SL-defect, suggesting that simply swapping two particles in the crystal is not a favorable way to create defects. However, introducing excess SL-defects has the potential to significantly lower the crystal free energy.
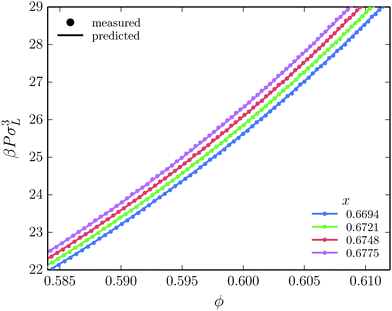
Using eqn (1), we can now calculate the full free energy of a crystal at a given density and composition, containing an arbitrary number of SL- and LS-defects. Moreover, we can calculate the pressure P = −(∂Ftot/∂V)N,T (at constant defect concentration) at each state point, giving us access to the Gibbs free energy G = F + PV as well. In Fig. 3, we compare the pressure of defected MgZn2 crystals, as derived from our expression for the free energy of the binary crystal phase, to the pressure as measured directly using event-driven molecular dynamics (EDMD) simulations,42 for different concentrations of SL antisite defects. Recall that in the expression for the free energy, we made the assumption that the defects do not interact. Clearly, we observe excellent agreement between the two approaches, justifying our assumption of non-interacting defects.
In addition to the antisite defects in the MgZn2 crystal, it is also possible that “substitutional” defects are present in the FCC crystals. Specifically, as the system is by definition a mixture of large and small particles, it is possible for the FCC crystal of the large particles to include substitutional defects where a small particle replaces a large particle. Similar defects occur in the FCC crystal of small particles. The method we use to determine the free energy of the FCC crystals with these substitutional defects is analogous to the method used for MgZn2 Laves phase (see the ESI† for more details).
3 Phase behavior with antisite defects
We now turn our attention to the effects of antisite defects on the phase diagram of hard-sphere mixtures. To predict the phase transitions in the system, we combine the free energies calculated for the defected crystals with the free energy of the fluid (taken from ref. 43). Phase coexistences are determined using common-tangent constructions in the (x, g) plane, where x = NS/N is the composition and g = βG/N is the Gibbs free energy per particle. Interestingly, we find that including antisite defects in our calculations significantly shifts the composition of the Laves phase coexisting with the fluid. As an example, we plot in Fig. 4 the common-tangent construction with and without defects for a fixed pressure βPσL3 = 23.3. In the absence of defects, we find (black dotted line) a coexistence between a perfect crystal x = 2/3 and a binary fluid. However, taking into account the antisite defects (green dashed line), the fluid coexists with a strongly defected Laves phase, at composition x = 0.672. This shift in composition corresponds to a substantial net concentration of SL-defects: around 1.6% of the large-particle lattice sites are taken up by small particles. Note that our calculations show that in all cases, the concentration of LS-defects is negligible (see ESI†), and hence we ignore these defects when calculating the phase diagram.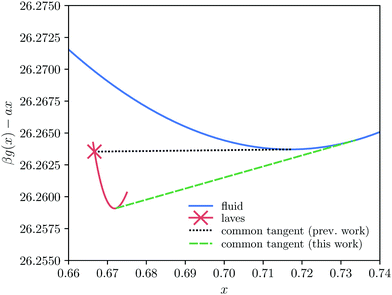 | ||
| Fig. 4 Effect of taking antisite defects into account on the common-tangent construction between the fluid and Laves phase. Specifically, we plot the Gibbs free energy per particle g = G/N as a function of the composition x at βPσL3 = 23.3. A linear shift has been subtracted here to aid the visualization of the common-tangent construction. When only the ideal Laves composition (x = 2/3) is taken into consideration the common tangent between the fluid and Laves phase manifests itself as the horizontal line, as was used in previous work.7,8 However, upon taking into consideration the Laves phase for a range of compositions it becomes clear that the common tangent is changed significantly. Note that in this plot the free-energy differences between different compositions appear a lot smaller than they are in reality due to the subtraction of a linear shift ax. | ||
Extending this approach to different pressures, and also considering substitutional defects in the FCC phases, we map out the revised phase diagram shown in Fig. 5(a), and provide a zoom-in of the Laves phase region in Fig. 5(b). As expected, allowing for defects expands the region of stability for the Laves phase from a single line at composition x = 2/37,8 to a narrow but finite region. What was not expected, however, is that at all pressures investigated this full region lies at composition greater than x = 2/3. In other words, the pure Laves phase is not stable at its “ideal” composition. While the shift in composition shown in Fig. 5(b) may appear to be small, it should be noted that the maximum shift (to x ≈ 0.6733) corresponds to a full 2.0% of the large particles being substituted by small particles. This defect concentration is orders of magnitude higher than typical vacancy and interstitial concentrations in single-component hard-sphere crystals.33,34 Aside from high SL-defect concentrations, our phase diagram exhibits another interesting feature. For the fluid-Laves region our updated phase diagram reveals that at low pressures the SL-defect concentration increases with pressure (as indicated by the increasing composition x). This is uncommon as usually the free-energy cost associated with the formation of defects increases strongly with pressure, resulting in lower defect concentrations.34
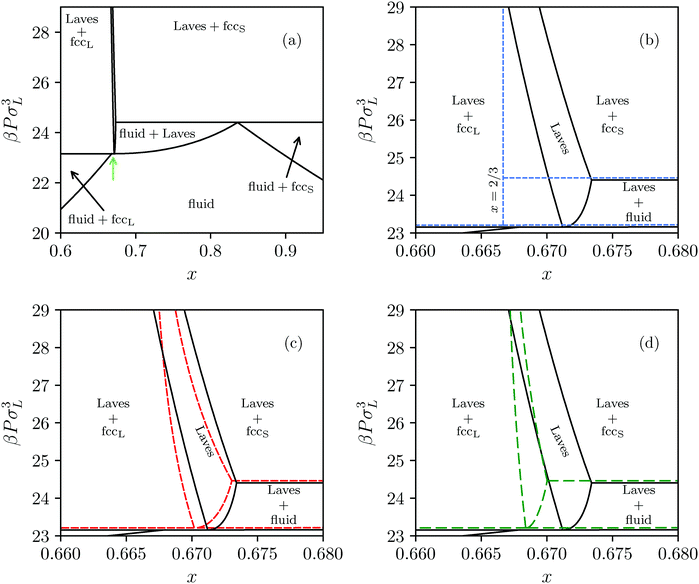 | ||
| Fig. 5 (a) Revisited phase diagram for a binary hard-sphere mixture with a size ratio of q = 0.82 upon taking defects into account in both the Laves phase and FCC phases. (b–d) Zoomed-in section on the Laves phase region, where we compare different approximations (colored lines) with the revisited phase diagram (black lines). (b) The dashed blue lines correspond to the defect-free phase diagram as calculated in ref. 7 and 8. (c) The dashed red lines are obtained by using the approximate method to take into account antisite defects, i.e. by using eqn (5), and by taking fSL from Monte Carlo simulations. (d) The dashed green lines are again obtained by using eqn (5), but now taking fSL from cell theory. Note that there is an extremely small Laves phase + fluid region at the tip of the green arrow in (a) that is not visible on either of the pressure scales displayed here, as the pressure range of the region is βΔPσL3 = 0.002.31 | ||
4 Estimating the impact of antisite defects
Lastly, we present a simple, approximate way to estimate the importance of these defects on a system where the defect-free phase diagram is known. In the following, we make the approximation that introducing antisite defects has no effect on the equation of state, and again assume that the defects do not interact. Under these assumptions, it can be shown (see ESI† for a full derivation) that the SL-defect concentration is given by | (5) |
As Fig. 5(c) shows, this first-order correction captures the essential traits of our “revised” phase diagram. Specifically, it predicts a similarly high concentration of defects, and captures the atypical defect concentration increasing with pressure in the fluid-Laves region. However, it still requires the measurement of fSL in simulations, and hence a significant additional effort when calculating the phase diagram. To this end, we try an even simpler approximation, where fSL is determined using cell theory. Specifically, we calculate for each particle the free volume that they can access when they are restricted to their own Wigner–Seitz cell in an otherwise perfect, static crystal. In this approximation, we can write the partition function as a product of volumes
 | (6) |
 | (7) |
 and v0i are the free volume of a particle i in a system with and without a SL-defect, respectively. Using this mean-field defect free energy in connection with the approximation made in eqn (5), one can test the qualitative importance of antisite or substitutional defects on a phase transition. As shown in Fig. 5(d), while somewhat less accurate, this approach correctly captures the order of magnitude of the defect concentration and the topology of the phase diagram. Hence, this is a quick, computationally inexpensive recipe to check whether antisite defects are important in a known phase diagram.
5 Discussion and conclusions
In conclusion, we have shown that the equilibrium Laves phase in binary hard-sphere mixtures of size ratio q = 0.82 contains an extraordinarily high concentration of antisite defects. In fact, we find stable regions where up to 2% of the large-particle lattice sites are occupied by a small particle. This defect concentration is orders of magnitude higher than the vacancy and interstitial defect concentrations found in single-component hard-sphere crystals.33,34 We expect these defects to play an important role for all size ratios for which the Laves phase is stable.Our results highlight the need to carefully consider possible defects when predicting colloidal phase behavior, and in particular stress the need to consider non-stoichiometric perturbations of binary crystals. Clearly, the commonly made assumption in the calculation of phase diagrams that the crystal composition is ideal is not valid here. To date, these types of defects have not been considered in any of the binary hard-sphere crystal studies,3–8,31 nor in any colloidal binary phase diagram studies that we are aware of. While we have focused here only on the Laves phase and FCC crystals, we like to stress that the assumption of ideal crystal composition has also been made for the calculation of phase diagrams of binary hard spheres which show regions of stability of e.g. NaZn13, AlB2. As these crystals appear at more extreme size ratios, it might even be necessary to consider defects in which multiple small spheres take up the space of a single large sphere.
We presented a simple theoretical method to determine whether such defects are important for any predicted phase coexistence. This simple approach captured the essential traits of the “updated” phase diagram with little computational effort. This method is an excellent starting point for future studies of antisite defects in binary crystals.
Furthermore, our results highlight some striking similarities between colloids and atoms. Namely, we find the Laves phase to be thermodynamically stable for quite a broad range of composition – just like in atomic binary crystals, where the composition can be tuned through the incorporation of stoichiometric defects.44–46 Hence, binary mixtures of colloids do not only provide an interesting model system of “big atoms”47,48 to study interstitial and substitutional solid solutions,16–23,49–51 but also to study alloying in binary crystals.
Intriguingly, we find that the hard-sphere Laves phase is never thermodynamically stable at its ideal composition. This should be an important consideration in both experimental and computational attempts to study the nucleation of these crystals.52–55 Lastly, much of the research on the Laves phases in colloidal crystals has been motivated by the possibility of a complete photonic band gap in the visible part of the spectrum, associated with the sublattices in the MgCu2 crystal.7,32 The high concentration of antisite defects we have found in the Laves phase with the MgZn2 structure, is also very likely to play an important role in the other, metastable Laves phases with the MgCu2 and MgNi2 structures. Hence, high defect concentrations may affect the photonic band gap of the metastable MgCu2 Laves phase, as it is well known that already low concentrations of defects can deteriorate the performance of band-gap materials. As these defects are an inherent part of the crystal phase behavior, removing them may be a considerable challenge.
Conflicts of interest
There are no conflicts to declare.Acknowledgements
We acknowledge funding from the Dutch Sector Plan Physics and Chemistry. We thank Michiel Hermes and Alfons van Blaaderen for many useful discussions.References
- R. J. D. Tilley, Defects in solids, Wiley, New York, 2008 Search PubMed.
- B. Meyer, D. Hofmann, J. Niklas and J.-M. Spaeth, Phys. Rev. B, 1987, 36, 1332 CrossRef CAS PubMed.
- M. D. Eldridge, P. A. Madden and D. Frenkel, Nature, 1993, 365, 35 CrossRef CAS.
- M. D. Eldridge, P. A. Madden and D. Frenkel, Mol. Phys., 1993, 79, 105–120 CrossRef CAS.
- M. D. Eldridge, P. A. Madden, P. N. Pusey and P. Bartlett, Mol. Phys., 1995, 84, 395–420 CrossRef CAS.
- E. Trizac, M. D. Eldridge and P. A. Madden, Mol. Phys., 1997, 90, 675–678 CrossRef CAS.
- A.-P. Hynninen, J. H. J. Thijssen, E. C. M. Vermolen, M. Dijkstra and A. van Blaaderen, Nat. Mater., 2007, 6, 202 CrossRef CAS PubMed.
- A.-P. Hynninen, L. Filion and M. Dijkstra, J. Chem. Phys., 2009, 131, 064902 CrossRef PubMed.
- T. Biben and J.-P. Hansen, Phys. Rev. Lett., 1991, 66, 2215 CrossRef CAS PubMed.
- M. Dijkstra, R. van Roij and R. Evans, Phys. Rev. Lett., 1998, 81, 2268 CrossRef CAS.
- M. Dijkstra, R. van Roij and R. Evans, Phys. Rev. E, 1999, 59, 5744 CrossRef CAS PubMed.
- M. Dijkstra, R. van Roij and R. Evans, Phys. Rev. Lett., 1999, 82, 117 CrossRef CAS.
- A. D. Dinsmore, A. G. Yodh and D. J. Pine, Phys. Rev. E, 1995, 52, 4045 CrossRef CAS PubMed.
- A. Imhof and J. K. G. Dhont, Phys. Rev. Lett., 1995, 75, 1662 CrossRef CAS PubMed.
- J. L. Barrat, M. Baus and J. P. Hansen, Phys. Rev. Lett., 1986, 56, 1063 CrossRef CAS PubMed.
- J. L. Barrat, M. Baus and J. P. Hansen, J. Phys. C: Solid State Phys., 1987, 20, 1413 CrossRef CAS.
- W. G. T. Kranendonk and D. Frenkel, J. Phys.: Condens. Matter, 1989, 1, 7735 CrossRef.
- D. A. Kofke, Mol. Simul., 1991, 7, 285–302 CrossRef CAS.
- W. G. T. Kranendonk and D. Frenkel, Mol. Phys., 1991, 72, 699–713 CrossRef CAS.
- W. G. T. Kranendonk and D. Frenkel, Mol. Phys., 1991, 72, 679–697 CrossRef CAS.
- X. Cottin and P. A. Monson, J. Chem. Phys., 1993, 99, 8914–8921 CrossRef CAS.
- L. Filion, M. Hermes, R. Ni, E. C. M. Vermolen, A. Kuijk, C. G. Christova, J. C. P. Stiefelhagen, T. Vissers, A. van Blaaderen and M. Dijkstra, Phys. Rev. Lett., 2011, 107, 168302 CrossRef CAS PubMed.
- I. Rios de Anda, F. Turci, R. P. Sear and C. P. Royall, J. Chem. Phys., 2017, 147, 124504 CrossRef PubMed.
- P. Bartlett, R. H. Ottewill and P. N. Pusey, J. Chem. Phys., 1990, 93, 1299–1312 CrossRef CAS.
- P. Bartlett, R. H. Ottewill and P. N. Pusey, Phys. Rev. Lett., 1992, 68, 3801 CrossRef CAS PubMed.
- M. D. Eldridge, P. A. Madden and D. Frenkel, Mol. Phys., 1993, 80, 987–995 CrossRef CAS.
- X. Cottin and P. A. Monson, J. Chem. Phys., 1995, 102, 3354–3360 CrossRef CAS.
- N. Hunt, R. Jardine and P. Bartlett, Phys. Rev. E, 2000, 62, 900 CrossRef CAS PubMed.
- A. B. Schofield, P. N. Pusey and P. Radcliffe, Phys. Rev. E, 2005, 72, 31407 CrossRef CAS PubMed.
- S. R. Ganagalla and S. N. Punnathanam, J. Chem. Phys., 2013, 138, 174503 CrossRef PubMed.
- T. Dasgupta and M. Dijkstra, Soft Matter, 2018, 14, 2465 RSC.
- E. C. M. Vermolen, J. H. J. Thijssen, A. Moroz, M. Megens and A. van Blaaderen, Opt. Express, 2009, 17, 6952–6961 CrossRef CAS PubMed.
- S. Pronk and D. Frenkel, J. Phys. Chem. B, 2001, 105, 6722–6727 CrossRef CAS.
- C. H. Bennett and B. J. Alder, J. Chem. Phys., 1971, 54, 4796–4808 CrossRef CAS.
- S. Pronk and D. Frenkel, J. Chem. Phys., 2004, 120, 6764–6768 CrossRef CAS PubMed.
- B. J. Alder and T. E. Wainwright, J. Chem. Phys., 1959, 31, 459–466 CrossRef CAS.
- M. P. Allen, D. Frenkel and J. Talbot, Comput. Phys. Rep., 1989, 9, 301–353 CrossRef.
- J. M. Polson, E. Trizac, S. Pronk and D. Frenkel, J. Chem. Phys., 2000, 112, 5339–5342 CrossRef CAS.
- B. van der Meer, M. Dijkstra and L. Filion, J. Chem. Phys., 2017, 146, 244905 CrossRef PubMed.
- B. van der Meer, R. van Damme, M. Dijkstra, F. Smallenburg and L. Filion, Phys. Rev. Lett., 2018, 121, 258001 CrossRef CAS PubMed.
- F. Wang and D. P. Landau, Phys. Rev. Lett., 2001, 86, 2050 CrossRef CAS PubMed.
- D. C. Rapaport, R. L. Blumberg, S. R. McKay and W. Christian, et al. , Comput. Phys., 1996, 10, 456 CrossRef.
- G. A. Mansoori, N. F. Carnahan, K. E. Starling and T. W. Leland Jr, J. Chem. Phys., 1971, 54, 1523–1525 CrossRef CAS.
- D. J. Thoma and J. H. Perepezko, J. Alloys Compd., 1995, 224, 330–341 CrossRef CAS.
- J. H. Zhu and C. T. Liu, Acta Mater., 2000, 48, 2339–2347 CrossRef CAS.
- F. Stein, D. Jiang, M. Palm, G. Sauthoff, D. Grüner and G. Kreiner, Intermetallics, 2008, 16, 785–792 CrossRef CAS.
- D. Frenkel, Science, 2002, 296, 65–66 CrossRef CAS PubMed.
- W. Poon, Science, 2004, 304, 830–831 CrossRef CAS PubMed.
- J. Tauber, R. Higler and J. Sprakel, Proc. Natl. Acad. Sci. U. S. A., 2016, 113, 13660–13665 CrossRef CAS PubMed.
- R. Higler and J. Sprakel, Sci. Rep., 2017, 7, 12634 CrossRef PubMed.
- B. van der Meer, E. Lathouwers, F. Smallenburg and L. Filion, J. Chem. Phys., 2017, 147, 234903 CrossRef PubMed.
- P. K. Bommineni, M. Klement and M. Engel, 2019, arXiv preprint, arXiv:1912.06251.
- T. Dasgupta, G. M. Coli and M. Dijkstra, 2019, arXiv preprint, arXiv:1906.10680, to be published in ACS Nano.
- D. Wang, T. Dasgupta, E. B. van der Wee, D. Zanaga, T. Altantzis, Y. Wu, G. M. Coli, C. B. Murray, S. Bals, M. Dijkstra, et al., 2019, arXiv preprint, arXiv:1906.10088.
- N. Schaertl, D. Botin, T. Palberg and E. Bartsch, Soft Matter, 2018, 14, 5130–5139 RSC.
Footnote |
| † Electronic supplementary information (ESI) available. See DOI: 10.1039/d0sm00335b |
| This journal is © The Royal Society of Chemistry 2020 |

