
 Open Access Article
 This Open Access Article is licensed under a Creative Commons Attribution-Non Commercial 3.0 Unported Licence
Vesicle adhesion in the electrostatic strong-coupling regime studied by time-resolved small-angle X-ray scattering†
Karlo
Komorowski
a,
Jannis
Schaeper
a,
Michael
Sztucki
b,
Lewis
Sharpnack
b,
Gerrit
Brehm
a,
Sarah
Köster
 a and
Tim
Salditt
*a
a and
Tim
Salditt
*a
aInstitute for X-Ray Physics, University of Göttingen, Friedrich-Hund-Platz 1, 37077 Göttingen, Germany. E-mail: tsaldit@gwdg.de
bEuropean Synchrotron Radiation Facility, CS 40220, 38043 Grenoble Cedex 9, France
First published on 16th April 2020
Abstract
We have used time-resolved small-angle X-ray scattering (SAXS) to study the adhesion of lipid vesicles in the electrostatic strong-coupling regime induced by divalent ions. The bilayer structure and the interbilayer distance dw between adhered vesicles was studied for different DOPC:DOPS mixtures varying the surface charge density of the membrane, as well as for different divalent ions, such as Ca2+, Sr2+, and Zn2+. The results are in good agreement with the strong coupling theory predicting the adhesion state and the corresponding like-charge attraction based on ion-correlations. Using SAXS combined with the stopped-flow rapid mixing technique, we find that in highly charged bilayers the adhesion state is only of transient nature, and that the adhering vesicles subsequently transform to a phase of multilamellar vesicles, again with an inter-bilayer distance according to the theory of strong binding. Aside from the stopped-flow SAXS instrumentations used primarily for these results, we also evaluate microfluidic sample environments for vesicle SAXS in view of future extension of this work.
1 Introduction
The intrinsically non-equilibrium state of small unilamellar lipid vesicles (SUVs) is stabilized against the transition to larger membrane aggregates such as multilamellar lipid vesicles (MLVs) by repulsive interactions, in particular by hydration repulsion as well as by electrostatic repulsion for the case of charged lipids.1–3 Furthermore, while fusion of two SUVs would release curvature energy on the order of the bending rigidity κ, the highly curved intermediate states in membrane fusion also act as a highly effective energetic barrier. For these reasons, lipid vesicles can be encountered as meta-stable phases, or – in a biological context – as organelles, which can maintain their structure and shape also without significant energy turnover. In fact, the conditions of stability against aggregation, shape transformation and fusion are of utmost importance, equally for cellular vesicles and lipid vesicles used in drug delivery, food processing or cosmetics.At some point in its life, triggered by changes in environmental parameters or by strong interactions, a vesicle it is bound to transform. Structural observation and characterization of these shape transformations is of fundamental interest, but challenging in view of their transient nature and the small length scales involved, on the order of the bilayer thickness. In the biological context, membrane fusion is known as a well-controlled and important physiological process. Fusion of neurotransmitter-filled synaptic vesicles (SVs) with the presynaptic plasma membrane,4 for example, is an essential step in nerve conduction. This process is catalyzed and controlled by proteins, in particular by the soluble N-ethylmaleimide-sensitive factor attachment protein receptors (SNAREs).5 In general, the merger of two membranes involves a highly complex interplay on the molecular level among lipids, proteins, ions of the aqueous environment and water molecules. Important aspects of the membrane fusion pathway, concerning for example intermediate structures, such as the docking state,6,7 and the quantitative evaluation of underlying forces and energetics, are currently under investigation. To this end, numerical studies have provided interesting insight into possible structures and mechanisms,8,9 and now call for experimental verification.
Lipid vesicles without proteins have also been intensively studied. The equilibrium phase diagram of vesicle shapes was calculated long ago,10 and a quantitative understanding of inter-bilayer forces based on linear superposition of molecular interactions has entered textbooks.1,11 Self-consistent field-theoretical approaches including Helfrich-type steric interaction predict a phase transition from bound to unbound lipid membranes.12 More recently, effects from non-linear electrostatics, such as like-charge attraction, have been considered, and a regime of strong coupling induced by multi-valent ions has been identified.13–16 Binding of divalent ions, in particular Ca2+ and Mg2+ to lipid membranes has been studied by Molecular Dynamics (MD) simulations.17–19
We have recently studied the adhesion state of vesicles, as induced by the divalent ions Ca2+ and Mg2+ for different ion concentration, lipid composition, and surface charge density σs.20 Using small-angle X-ray scattering (SAXS), we could distinguish a strong adhesion state – probably caused by ion bridging – and a soft adhesion state in the presence of background monovalent salt concentration. While vesicle adhesion was observed when mixing anionic and zwitterionic or neutral lipids (binary and quaternary lipid mixtures), pure anionic membranes (DOPS) with correspondingly high σs were found to undergo a phase transition to a multilamellar state. The structure and interactions between charged MLVs in the presence of multivalent ions was also studied by SAXS in ref. 21. Recently, strong coupling has been studied between two highly charged solid-supported lipid bilayers in the presence of monovalent counter-ions by neutron and X-ray reflectivity.22 While interesting aspects of bilayer interactions beyond linear electrostatics were elucidated, studies of ion-induced transition, non-equilibrium effects or the kinetics of vesicle phase transitions still remain scarce, with the exception of experiments based on temperature changes (T-jump).23
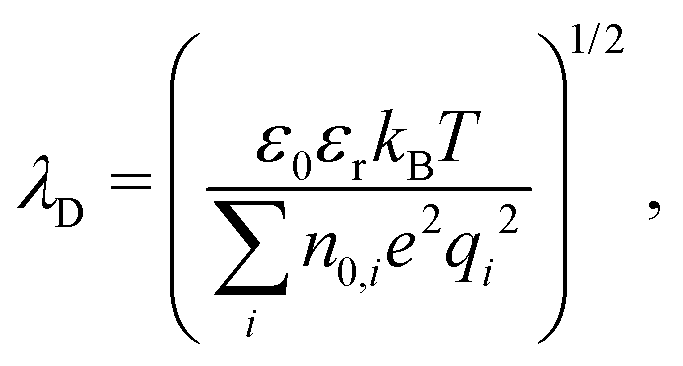
In this work, we now extend our SAXS studies of the adhesion state, presenting a wider range of ions and first time-resolved studies monitoring the transition from SUVs to MLVs as illustrated in Fig. 1(a and b). We show that the divalent salts induced attractive interactions between bilayers, which are in quantitative agreement with the strong coupling theory put forward by R. Netz and coworkers.13–16 Furthermore, we have studied the adhesion transition by time-resolved SAXS using the rapid mixing technique as illustrated in Fig. 1(a) as well as with microfluidic devices. Importantly, we can identify a transient docking intermediate state in the SUV to MLV transition in DOPC:DOPS mixtures, induced by Ca2+.
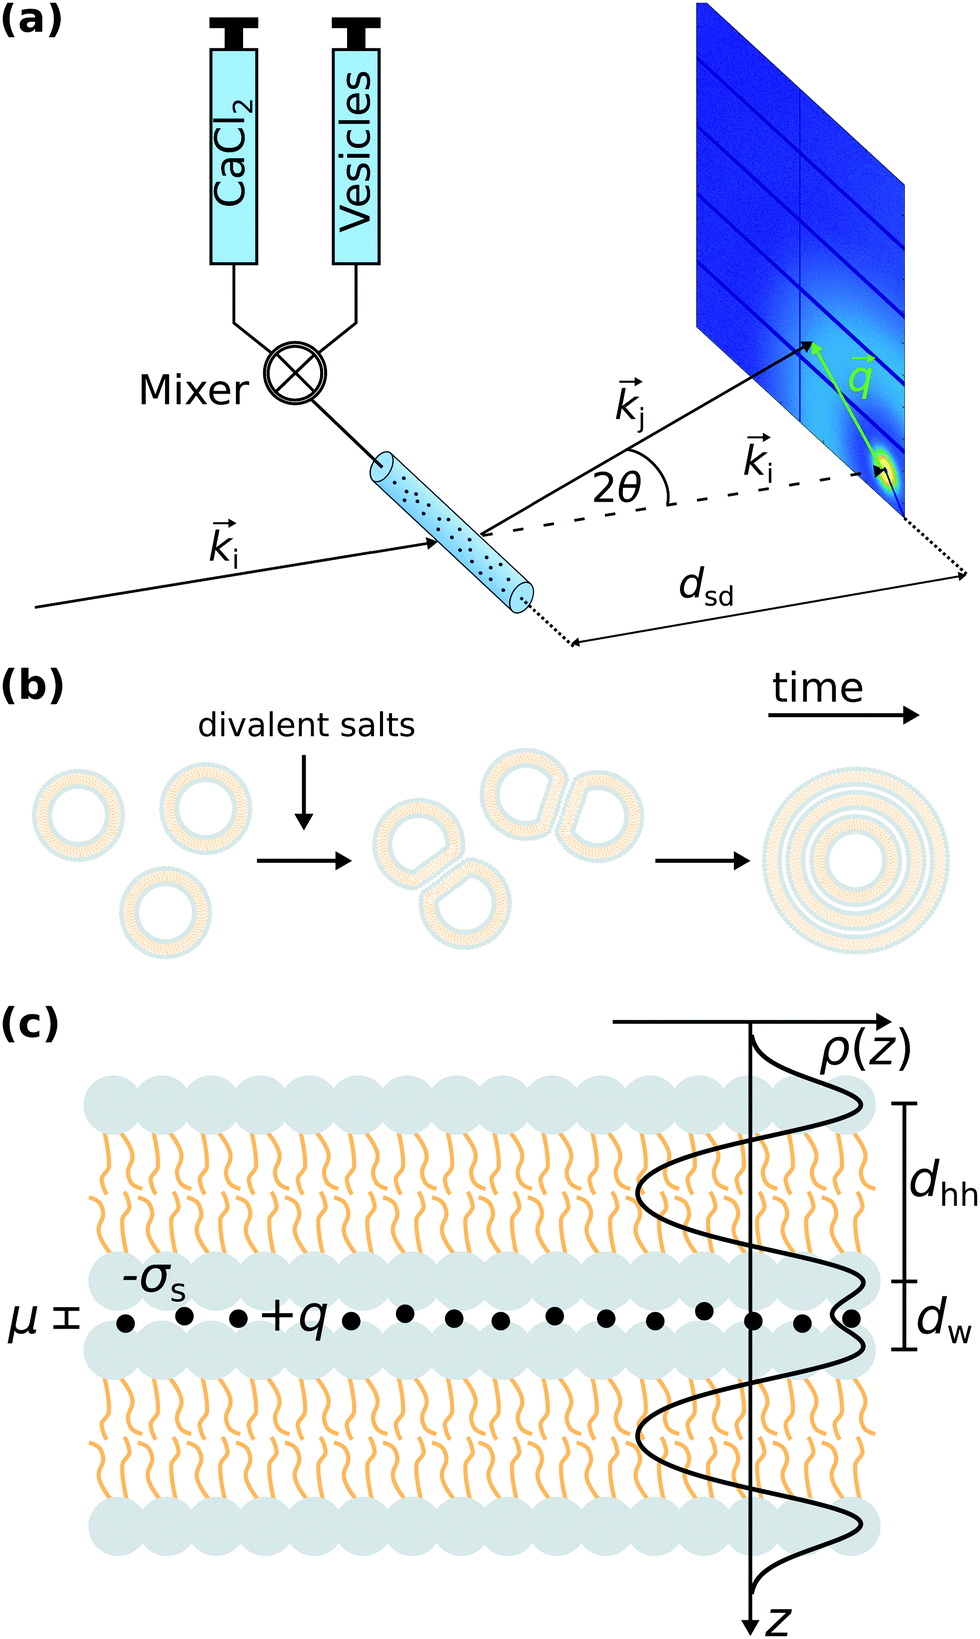 | ||
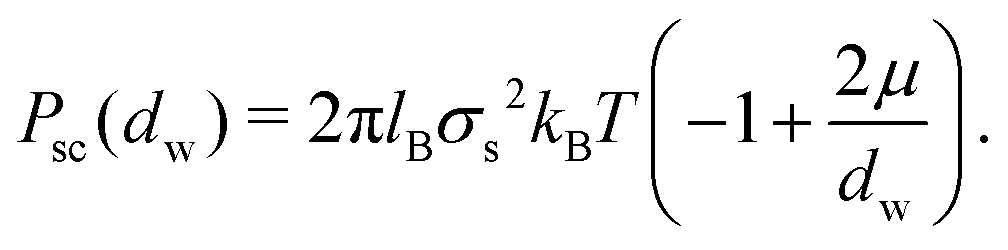
Fig. 1 (a) Illustration of the principle of SAXS combined with the stopped flow rapid mixing technique. The two components (CaCl2 and unilamellar lipid vesicles both prepared in ultra-pure water) are rapidly mixed and flowing into a flow-through capillary cell adapted to the mixing chamber. For time-resolved data collection, the X-ray beam is synchronized with the mixing device. The two-dimensional diffraction pattern is measured by an area detector. The distance between the sample plane and the detector is denoted by dsd. The momentum transfer vector is given by ![[q with combining right harpoon above (vector)]](https://www.rsc.org/images/entities/i_char_0071_20d1.gif) = = ![[k with combining right harpoon above (vector)]](https://www.rsc.org/images/entities/i_char_006b_20d1.gif) j − i, where i and j are the wave vectors of the incident and the scattered X-ray beam, respectively. (b) Sketch of the structural dynamics of the phase transition from unilamellar vesicles toward multilamellar vesicles upon mixing with divalent salts. An intermediate state of docked vesicles can be distinguished in the structural analysis of the SAXS data. (c) Illustration of the strong coupling theory on lipid membranes. Two like-charge membranes with the surface charge density −σs are in close proximity induced by ion correlations, where the ions have the valency +q. In the SAXS analysis the effective electron density profile (EDP) ρ(z) is modeled by the sum of three Gaussians (one Gaussian for each headgroup region and one Gaussian for the hydrophobic chain region). The bilayer thickness dhh is given by the distance between the two headgroup's maxima within the bilayer. The inter-membrane distance dw is defined as the distance between two opposing headgroup maxima. The Gouy–Chapman length μ is a measure for the ion-layer thickness. Note, that σs and q are both positive by definition. j − i, where i and j are the wave vectors of the incident and the scattered X-ray beam, respectively. (b) Sketch of the structural dynamics of the phase transition from unilamellar vesicles toward multilamellar vesicles upon mixing with divalent salts. An intermediate state of docked vesicles can be distinguished in the structural analysis of the SAXS data. (c) Illustration of the strong coupling theory on lipid membranes. Two like-charge membranes with the surface charge density −σs are in close proximity induced by ion correlations, where the ions have the valency +q. In the SAXS analysis the effective electron density profile (EDP) ρ(z) is modeled by the sum of three Gaussians (one Gaussian for each headgroup region and one Gaussian for the hydrophobic chain region). The bilayer thickness dhh is given by the distance between the two headgroup's maxima within the bilayer. The inter-membrane distance dw is defined as the distance between two opposing headgroup maxima. The Gouy–Chapman length μ is a measure for the ion-layer thickness. Note, that σs and q are both positive by definition. | ||
For this study, we have used both a stopped-flow rapid mixer as well as microfluidic devices, and different beam conditions, instrumentation and optics have been evaluated for studies of time-resolved SAXS, in particular with respect to docking and fusion of vesicles. Therefore, it is adequate to briefly consider the state-of-the art in this field: SAXS combined with the stopped-flow rapid-mixing technique has been used previously to study osmotic shrinkage of sterically stabilized liposomes,24 as well as the role of calcium in membrane condensation and spontaneous curvature variations in model lipidic systems.25 A calcium triggered lamellar to hexagonal phase transition (Lα–H2) was studied by combined rapid mixing and time-resolved synchrotron SAXS.26 For SAXS in combinations with microfluidics, we refer to the review.27 Direct monitoring of calcium-triggered phase transitions in cubosomes using small-angle X-ray scattering combined with microfluidics has been reported in ref. 28. A microfluidic platform for the continuous production and characterization of multilamellar vesicles was presented in ref. 29. Finally, a microfluidic SAXS study of unilamellar and multilamellar surfactant vesicle phases was reported in ref. 30.
2 Interaction potentials and strong coupling regime
Before giving the details of the experiment, we briefly address the essential interactions needed to describe the docking of vesicles and the transition from SUVs to multilamellar phases. Like-charge attraction between two bilayers induced by divalent ions is illustrated in Fig. 1(c). The distance between the two bilayers is denoted as dw, which is obtained from the SAXS analysis described in detail in the Materials and methods section. In the following, we recapitulate the formula used in the literature for the sake of notational clarity. In line with textbook literature and in particular following the review by Andelman,2 we first define the characteristic length scales which govern the different regimes of electrostatic interaction between membranes in solution. The Bjerrum length is defined as| lB = e2(4πεε0kBT)−1, | (1) |
| μ = (2πqlBσs)−1, | (2) |
 | (3) |
Together, these three length scales are sufficient to describe all regimes of linear electrostatics in solution. As mentioned above, the dominant attraction between like-charge membranes when adhesion is induced by divalent ions is described by the so-called strong coupling theory,13–16 which is characterized by ion bridging and/or ion correlation effects. In contrast, mean-field electrostatics which neglect ion–ion correlation effects is denoted as the weak coupling regime.2,3 The two regimes are delineated by the unitless coupling parameter Ξ = ![[l with combining tilde]](https://www.rsc.org/images/entities/i_char_006c_0303.gif) B/μ, where B = q2lB. The Poisson–Boltzmann approximation is valid for Ξ ≪ 1, while Ξ ≫ 1 is denoted as the strong coupling regime. In the strong coupling regime, an analytical expression for the interaction pressure is given as
B/μ, where B = q2lB. The Poisson–Boltzmann approximation is valid for Ξ ≪ 1, while Ξ ≫ 1 is denoted as the strong coupling regime. In the strong coupling regime, an analytical expression for the interaction pressure is given as
 | (4) |
 | (5) |
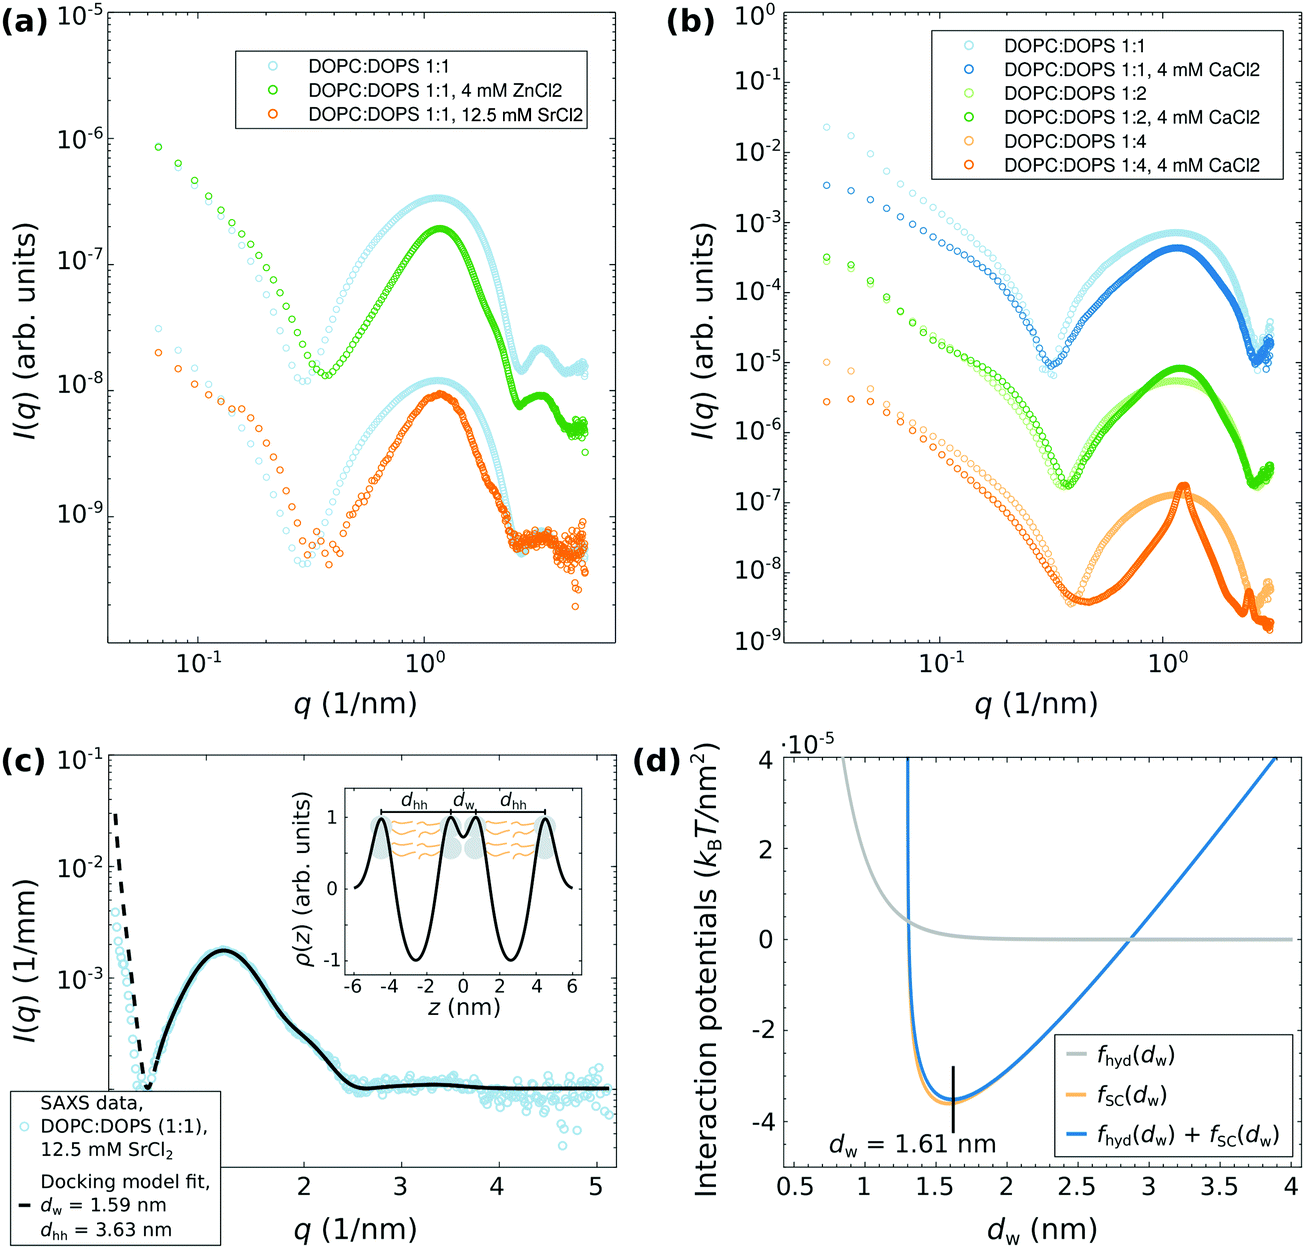 | ||
Fig. 2 SAXS experiments at ID02 using the flow through cell. (a) SAXS data of DOPC![[thin space (1/6-em)]](https://www.rsc.org/images/entities/char_2009.gif) :DOPS (1:1) vesicles suspended in a 100 mM glucose solution, both with and without the addition of the divalent salts ZnCl2 and SrCl2. (b) SAXS data of DOPC:DOPS (1:1), (1:2), and (1:4) vesicles suspended in a 100 mM glucose solution, both with and without the addition of CaCl2. (c) DOPC:DOPS (1:1), 12.5 mM SrCl2, docking model fit, dw = 1.59 nm, dhh = 3.63 nm. (d) The strong-coupling potential (orange line) yields an attractive interaction of like-charge membranes at small separations. By adding the hydration repulsion, an equilibrium water spacing of dw ≈ 1.6 nm is found, in agreement to the experimental finding. The following simulation parameters have been used: σs = 0.5/64 e Å2 assuming an area per lipid headgroup of 64 Å2, lB ≃ 7.11 × 10⁻¹⁰ m, μ ≃ 1.43 × 10⁻¹⁰ m, dh = 13 × 10−10 m (FWHM, taken from the fit result in (c)), λh = 2 × 10⁻¹⁰ m, Ph = 3.3 × 10⁹ J m−3, T = 294 K. :DOPS (1:1) vesicles suspended in a 100 mM glucose solution, both with and without the addition of the divalent salts ZnCl2 and SrCl2. (b) SAXS data of DOPC:DOPS (1:1), (1:2), and (1:4) vesicles suspended in a 100 mM glucose solution, both with and without the addition of CaCl2. (c) DOPC:DOPS (1:1), 12.5 mM SrCl2, docking model fit, dw = 1.59 nm, dhh = 3.63 nm. (d) The strong-coupling potential (orange line) yields an attractive interaction of like-charge membranes at small separations. By adding the hydration repulsion, an equilibrium water spacing of dw ≈ 1.6 nm is found, in agreement to the experimental finding. The following simulation parameters have been used: σs = 0.5/64 e Å2 assuming an area per lipid headgroup of 64 Å2, lB ≃ 7.11 × 10⁻¹⁰ m, μ ≃ 1.43 × 10⁻¹⁰ m, dh = 13 × 10−10 m (FWHM, taken from the fit result in (c)), λh = 2 × 10⁻¹⁰ m, Ph = 3.3 × 10⁹ J m−3, T = 294 K. | ||
3 Materials and methods
3.1 Microfluidic devices
X-ray compatible microfluidic devices were built in a multi-step process following the protocol in ref. 31. First, SU-8 2150 negative photo resist (MicroChem, Newton, MA, USA) is processed by means of standard photolithography on a 2-inch silicon wafer. During the soft bake step, an edge bead removal is performed to ensure a better contact between the substrate and the photo mask (S. A. Selba, Versoix, Switzerland) in the mask aligner. The resulting channels have a width of 200 μm as defined by the lithography mask, and a height of 200 μm as measured with a profilometer (Veeco Dektak 6). Subsequently, a PDMS copy (Sylgard, Dow Corning, Midland, USA) was made from the wafer. The PDMS stamp was used to print the structure in UV-curable glue (NOA 81, Norland Optical Adhesives, Cranberry, USA) on a glass slide as support which is cured under a UV-lamp (366 nm). A stack of aluminium foil, the glass slide and a 300 μm COC foil (Topas 8007, Topas Advanced Polymers GmbH, Frankfurt, Germany) with a glass transition temperature tG = 78 °C was placed in a preheated laboratory hotpress at 130 °C for 10 min. Subsequently, it was pressed with 2.3 kN for 5 min. Holes for the inlets and outlets are punched in the COC with a 0.5 mm biopsy punch (Harris Unicore, Sigma-Aldrich, St. Louis, Missouri, USA). The device is sealed with a 20 μm COC foil (Topas 8007, Topas Advanced Polymers GmbH, Frankfurt, Germany) with a glass transition temperature tG = 78 °C in a heat and pressure controlled lamination machine.In order to tightly connect the microfluidic device and the tubing in a leak-free manner, the device was integrated into a sample holder. The sample holder consists of two plates made of aluminium, which are designed with a gab to expose the channels. The two plates sandwich a PVC (polyvinylchloride) plate and the device itself. The front metal plate and the PVC plate have five small holes matching the holes of the device to attach the tubing to the device. For sealing, the tubing was further threaded through o-rings. A photograph of the sample holder integrated at the GINIX endstation at the P10 beamline is shown in Fig. 5.
To establish certain flow velocities on all four inlets and to be able to control the flow remotely the neMESYS pump system (Cetoni GmbH, Korbussen, Germany) is used in combination with Hamilton Gastight Syringes (Hamilton Bonaduz AG, Switzerland).
3.2 Simulation of the microfluidic flow
Both the flow conditions and the distribution of lipid vesicles and Ca2+-ions in the microfluidic device have been studied using finite element method (FEM) simulations with COMSOL Multiphysics 5.3 (COMSOL GmbH, Göttingen, Germany). Due to the small cross-section of the device and the small flow rates, the flow can be described as laminar flow, hence the stationary Navier-Stokes equation was solved, applying the no-slip boundary condition at the channel walls. The distribution of lipid vesicles and the Ca2+-ions in the channel was calculated, setting the initial concentration of both substances to the arbitrary value 1 mol m−3. The diffusion coefficient of the lipid vesicles has been calculated according to the Stokes–Einstein equation, Dvesicle = kBT/(6πηr), with vesicle radius rvesicle = 20 nm. The diffusion of Ca2+-ions was modelled with a diffusion constant DCa2+ = 7.92 × 10⁻¹⁰ m2 s−1.323.3 Sample preparation
Lipid vesicles with a size of approximately 100 nm in diameter were prepared by extrusion through polycarbonate membranes. The lipids dioleoylphosphatidylcholine (DOPC) and dioleoylphosphatidylserine (DOPS) were purchased as lyophilized powders from Avanti Polar Lipids (Alabaster, AL, USA). DOPC and DOPS were dissolved in chloroform and mixed at the desired molar ratio. Subsequent evaporation of chloroform was performed under a stream of nitrogen. The resulting dried lipid film was hydrated either with a 100 mM glucose solution or ultra-pure water to a final lipid concentration of 10 mg ml−1 for the flow-through SAXS and the microfluidic SAXS experiments, and to 20 mg ml−1 for the stopped-flow SAXS experiments. Note that by adding glucose the vesicle volume can be quenched, as water in- or outflux is penalized by an osmotic pressure difference. For vesicle preparation, the suspension was first vortexed and subsequently extruded (35 times) through membranes with pore sizes of 100 nm in diameter by using a Mini-Extruder from Avanti Polar Lipids (Alabaster, AL, USA). Prior to the injection into both, the microfluidic and the stopped-flow rapid mixing devices, the samples were gently degassed to minimize air bubbles.3.4 Small-angle X-ray scattering
SAXS experiments were performed at the undulator beamlines P10 at Deutsches Elektronen-Synchrotron (DESY) in Hamburg, Germany, and ID0233 at European Synchrotron Radiation Facility (ESRF) in Grenoble, France. At P10, the GINIX (Göttingen instrument for nanoscale imaging with X-rays) endstation34 was used for the experimental realization. The details of the experimental settings are given below.At ID02, the photon energy was set to 12.56 keV by a Si(111) mono crystal monochromator. The beam size at the sample plane was 30 μm × 30 μm for microfluidics experiments. The scattered X-rays were recorded using an Rayonix MX-170HS CCD pixel detector (Rayonix L.L.C., USA) with 3840 × 3840 pixels at a sample-to-detector distance of 1.5 m.
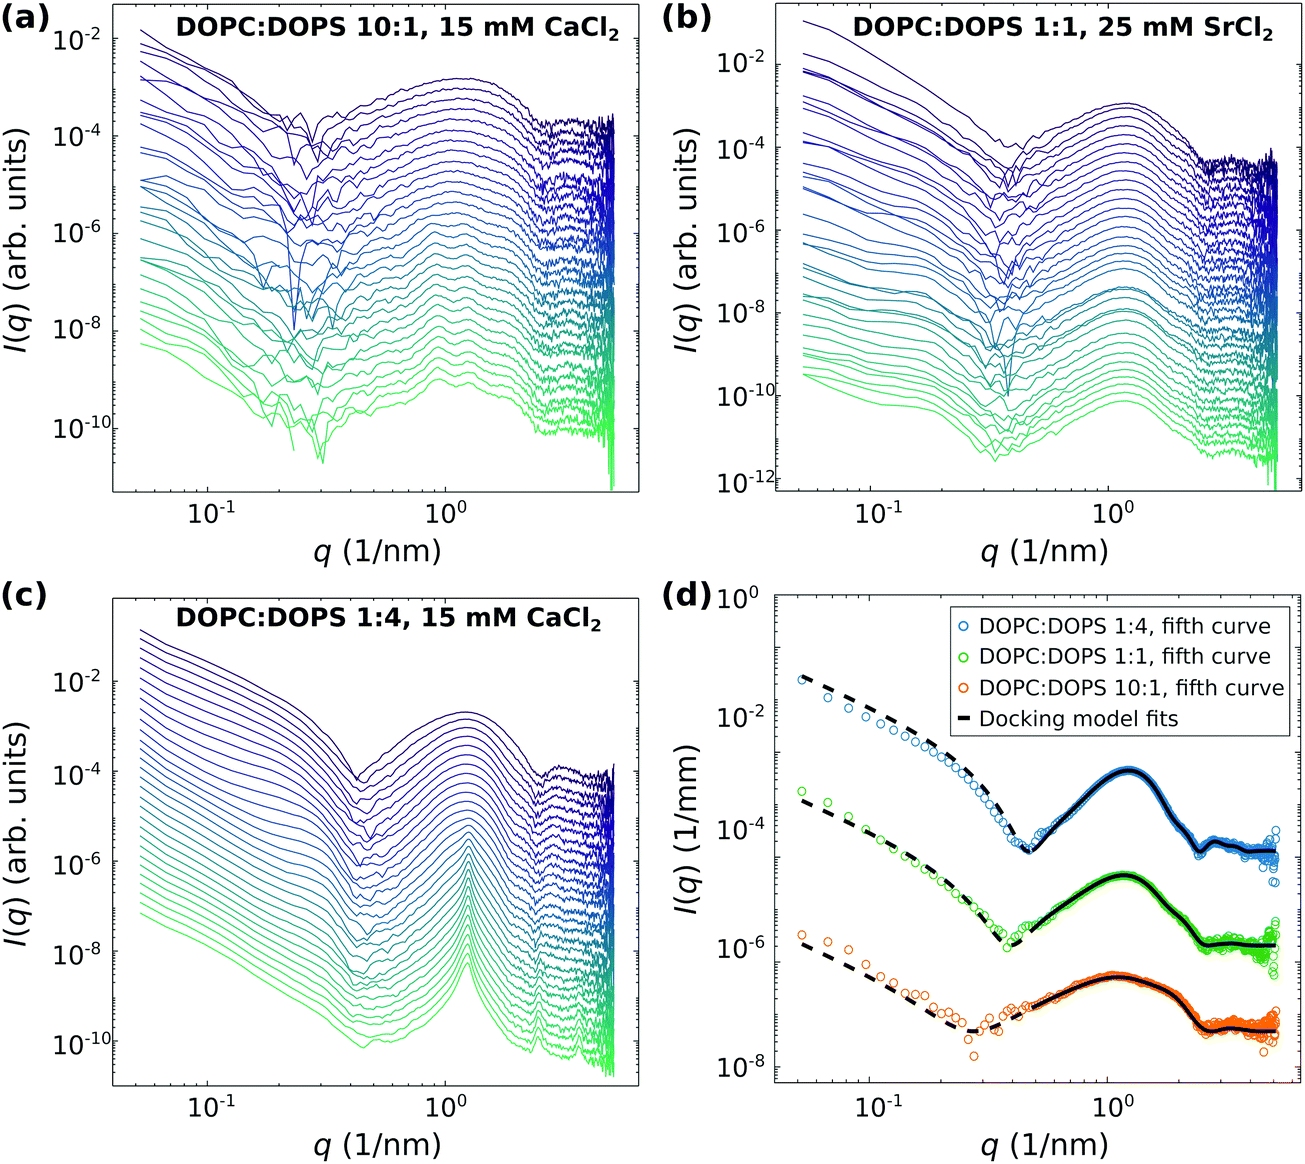 | ||
| Fig. 3 Time-resolved SAXS data of 20 mg ml−1 DOPC:DOPS vesicles with varied surface charge density mixed with either 15 mM CaCl2 (a and c) or with 25 mM SrCl2 (b) obtained by using the stopped-flow rapid mixing device. The vesicles were either suspended in ultra-pure water (a and c) or in a 100 mM glucose solution (b). The background corrected SAXS data is shifted for clarity. (a) 30 frames, first frame 0.05 s after mixing, last frame 91.95 s. The exposure time was 0.005 s. (b) 35 frames, first frame 0.04 s after mixing, last frame 316.16 s. The exposure time was 0.02 s. (c) 30 frames, first frame 0.055 s after mixing, last frame 92.099 s. The exposure time was 0.01 s. (d) Representative docking model least-squares fits to the SAXS data from (a–c) show that adhesion states can be well identified, either as intermediate (a and c) or as final states (b). The SAXS data of DOPC:DOPS (1:1) and DOPC:DOPS (10:1) as well as the corresponding fits are shifted for clarity. | ||
Briefly, we use the standard decomposition of the powder-averaged kinematic structure factor S(q) and the bilayer form factor F(q) = |f(q)|2 with the form factor amplitude f(q) to write the scattering intensity I(q) ∝ 〈F()S()〉, where 〈 … 〉 denotes the orientational average. q is given by the modulus of the momentum transfer vector q = || = (4π/λ)sinθ, where λ is the wavelength of the X-rays and θ the half of the scattering angle relative to the incident beam. The electron density profile (EDP) ρ(z) normal to the bilayer, which enters into the form factor by  , is parameterized by three Gaussian functions according to
 | (6) |
The final expression for the scattering intensity of the docking model used in the analysis is given by20
 | (7) |
| S(q) = 2 + 2cos(qd), | (8) |
 | (9) |
Least-squares fit. To obtain structural parameters from SAXS data, the experimental scattering intensities Iexp(qi) with data points i = 1,…,N recorded at qi, were fitted by the model curve Imod(qi), accounting for a scaling factor and a constant background as
| Itot(q) = c1·Imod(q) + c2. | (10) |
 | (11) |
For the bilayer structure, a symmetric profile was enforced, reducing the number of free parameters. The Gaussian parameters representing the headgroups are σh = σh1 = σh2 and ρh = ρh1 = ρh2. While the width σc of the Gaussian representing the chain region is a free parameter, the amplitude and the position were fixed to ρc = −1 (arb. units) and zc = 0 (nm), respectively. The positions of the two outer Gaussians are denoted zh1,2 = ±zh. Estimation for standard deviation of the fit parameters was performed by calculation of the variance–covariance matrix approximated by cov = resnorm (JTJ)−1/N.
4 Results and discussion
4.1 Vesicle adhesion in the strong coupling regime
First, we have studied vesicle adhesion as a function of the divalent cations (CaCl2, SrCl2, and ZnCl2) and as a function of the surface charge density σs by varying the content of DOPS in the DOPC:DOPS mixture. Previously, it was shown, that the addition of CaCl2 and MgCl2 to a suspension consisting of 100 nm extruded DOPC:DOPS (1:1) vesicles, resulted in a stable adhesion state.20 The obtained interbilayer spacing was well reproduced by the strong-coupling theory. Moreover, dw was approximately the same for CaCl2 and for MgCl2, and was independent of the concentration of the ions. Contrarily, ν was increased when increasing the ion concentration. This indicates, that the concentration of the divalent ions has a minor effect on the equilibrium interbilayer spacing, but indeed affects the fraction of adhered bilayers.
The characteristic shape of the SAXS signal from adhered vesicles is discussed in detail in ref. 20. Briefly, in the case of vesicle adhesion, structure factor modulations can be observed in a most pronounced manner between the characteristic form factor minima of the lipid bilayer (depending on the bilayer thickness, approximately in the q-range of 0.4 and 2.5 nm−1). The structure factor modulations are superimposed by the bilayers form factor, so that the minima of the structure factor exhibit a smooth profile. The intermediate modulations of the structure factor vary in a characteristic manner with dw.
Here, we extend the previous study by using other divalent salts as well as by using different molar ratios in the DOPC:DOPS mixtures. Moreover, the results presented in Fig. 2 will be an important basis for the time-resolved SAXS experiments discussed later. Fig. 2(a and b) shows a series of SAXS data of lipid vesicles prepared in a 100 mM glucose solution, in which structural changes were induced by (a) ZnCl2 and SrCl2 for DOPC:DOPS (1:1), and by (b) CaCl2 for DOPC:DOPS (1:1, 1:2, and 1:4). Comparing the SAXS signal with the pure lipid vesicle suspension, e.g. no salt added, structure factor modulations characteristic for the adhesion state can be observed for almost all cases except for DOPC:DOPS (1:4), where two Bragg peaks are visible. This indicates, that increasing the surface charge density by increasing the content of DOPS results in a collapse of the vesicles and to an rearrangement of the vesicles to a multilamellar state at a certain point. Previously, this observation was also made with pure DOPS vesicles suspended in ultra-pure water.20
The quantitative analysis of the adhesion state is exemplified in (c) for DOPC:DOPS (1:1) with the addition of 12.5 mM SrCl2. From the docking model fit, the effective electron density profile (EDP) and the interbilayer spacing, here dw ≈ 1.6 nm, are obtained as indicated in the inset. The results are well in line with the previous studies20 for CaCl2 and MgCl2. The structural parameters are summarized in Table 1. The modeling of the interaction potentials by using the strong-coupling theory for the dominating attraction between the like-charge bilayers and an additional hydration potential for the repulsion is shown in (d) using the parameters described in the caption. The experimentally obtained interbilayer spacing of dw = 1.6 nm can be well reproduced by the superposition of the strong-coupling potential and the hydration potential. Thus, the small bilayer separations, e.g. strong like-charge attraction between the bilayers, are the result of ion-correlation effects associated with strong coupling according to theory. The simulation parameters are as summarized in the caption of Fig. 2.
| Sample | ρ h | σ h, σc | d hh (nm) | d w (nm) | (1 − ν) | χ red 2 | Ref. |
|---|---|---|---|---|---|---|---|
| DOPC:DOPS (1:1), 4 mM CaCl2 |
1.39 | 0.44, 0.95 | 3.71 | 1.56 | 0.89 | 1.14 | 20 |
| DOPC:DOPS (1:1), 4 mM MgCl2 |
1.34 | 0.39, 0.84 | 3.72 | 1.72 | 0.98 | 0.89 | 20 |
| DOPC:DOPS (1:1), 12.5 mM SrCl2 |
1.14 | 0.54, 0.98 | 3.63 | 1.59 | 0.83 | 1.44 | — |
| DOPC:DOPS (1:1), 4 mM ZnCl2 |
1.13 | 0.48, 0.89 | 3.63 | 1.59 | 0.85 | 101.76 | — |
| DOPC:DOPS (1:2), 4 mM CaCl2 |
1.31 | 0.46, 0.91 | 3.75 | 1.26 | 0.85 | 17.63 | — |
Note, that further flow-through SAXS experiments were performed to study the reaction between DOPC:DOPS (1:1) vesicles and the trivalent salts FeCl3, Al2(S04)3, and MgSO4 as shown in the ESI† (Fig. S2). In those cases, no signature was observed which could be attributed to the docking state of vesicles. Instead, phase transitions to different multilamellar states were observed.
4.2 SAXS combined with the stopped-flow rapid mixing device
Next, structural dynamics of vesicle adhesion and fusion upon mixing with divalent salts was studied by time-resolved SAXS combined with the stopped-flow technique. Fig. 3 shows the time-resolved SAXS data of DOPC:DOPS vesicles with the a molar ratio of (a) 10:1, (b) 1:1 and (c) 1:4, either mixed with 15 mM CaCl2 (a and c) or 25 mM SrCl2 (b). After mixing, the first SAXS image is recorded approximately 0.05 after starting the measurement script, subsequently following the reaction over a time window of approximately 92 s (a and c) and 316 s (b). However, subtracting the dead time of the stopped flow mixing time, the true kinetic time can be smaller down to the millisecond range, accounting for an offset between the elapsed time in the data acquisition and the kinetic time. In all data sets, different states along the reaction pathway can be distinguished as a function time. In particular, the transition of unilamellar vesicles to adhered vesicles is visible, even if the final states are different. For DOPC:DOPS (10:1), notably, the final state is difficult to attribute. The docking modulation seems to be superimposed with several smaller (structure factor) peaks indicative of short range order between several adhering bilayers. Osmotic shrinkage of vesicles may also contribute to the signal.
For DOPC:DOPS (1:4), the final state is clearly characterized by the structure factor of multilamellar vesicles. This state is reached from a transient docking state. As revealed by the least-square fits, the collapse of vesicles occurs at ν ≈ 0.5. For the observation of the intermediate state of adhered vesicles in this system, the time-resolved SAXS combined with the stopped-flow technique was essential. SAXS experiments using the flow-through cell could only reveal the initial state of unilamellar vesicles without mixing with CaCl2, and the final state of multilamellar vesicles by measuring the equilibrated reaction upon mixing with CaCl2 (cf.Fig. 2). The quantitative analysis of the adhesion state is exemplified in (d) for representative SAXS curves of each data set, where the typical structure factor modulation associated with docking are observed.
Fig. 4 shows the main structural results combining the analysis of the stopped-flow SAXS data and of the flow-through SAXS data. The structural parameters d, dhh and dw are displayed in (a) as a function of the molar ratio of DOPC:DOPS (10:1, 1:1, 1:2, and 1:4). For (10:1), (1:1), and (1:4) the structural parameters are the mean values from the time-course analyzed by docking model fits to the stopped-flow SAXS data (corresponding to the analysis of at least ten SAXS signals, where a clear adhesion state could be identified). As shown in Fig. S2 (ESI†), the structural parameters dhh and dw remain nearly constant over time. The error is given as the standard deviation of the mean. For the molar ratio of (1:2), the results are from the analysis of the flow-through SAXS data shown in Fig. 2(b). The error is calculated by the approximated parameter co-variance matrix of the least-squares fit.
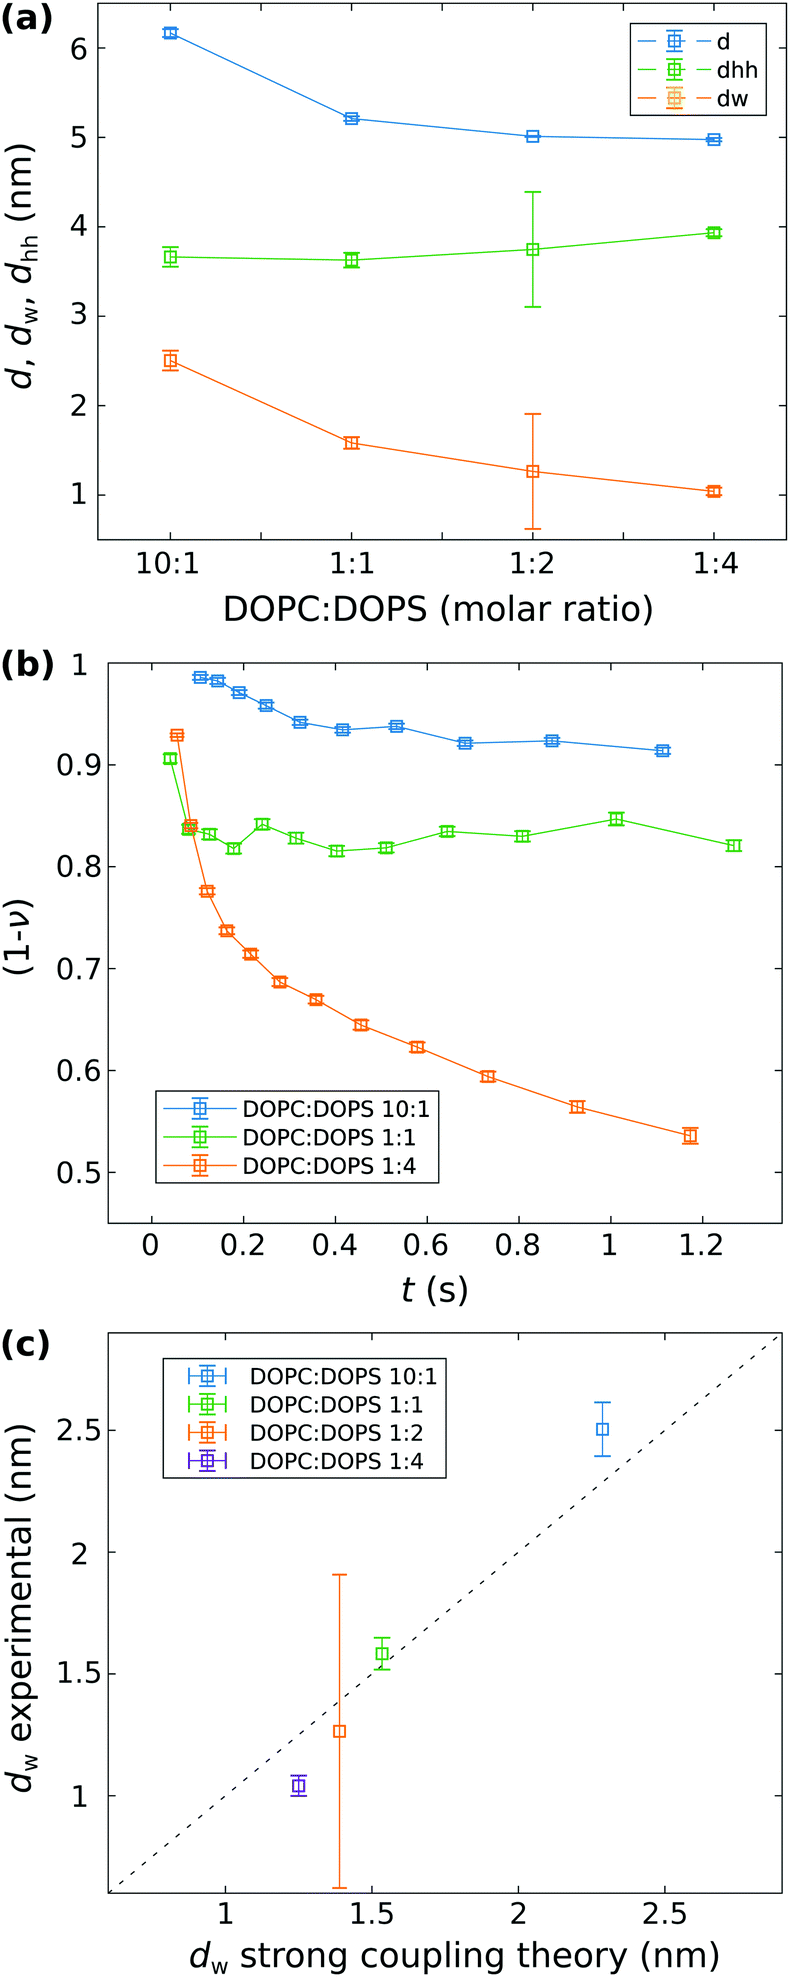 | ||
| Fig. 4 Analysis of the vesicle adhesion. (a) Structure of the adhesion state: The structural parameters d, dhh and dw for different molar ratio of DOPC:DOPS. The values for molar ratios (10:1), (1:1), and (1:4) are the mean of all least-square fit results for curves corresponding to the adhesion state in the stopped-flow SAXS series shown in Fig. 3. The corresponding standard deviation of the mean is taken as errorbar. For the molar ratio (1:2) the parameters are obtained from the flow-through SAXS data shown in Fig. 2. Here, the errorbar is given by the estimated standard deviation of the least-squares analysis. (b) Kinetics of adhesion: The surface fraction (1 − ν) of non-adhered bilayers as a function of time, obtained from least-squares analysis of the stopped-flow SAXS. (c) Analysis of the strong coupling regime: each data point represents a different system with varied charge density σs and corresponding coupling parameters, notably Ξ(10:1) = 3.97, Ξ(1:1) = 19.84, Ξ(1:2) = 26.19, and Ξ(1:4) = 29.76. The experimentally determined water layer thickness dw is plotted against the value predicted by the strong coupling theory. We can deduce that within the probed range of the four different coupling parameters, prediction and measurement are reasonably close, with a correlation coefficient r = 0.9948. The fact, however, that only 2 out of the 4 points are within error bars may suggest that the experimental error is slightly underestimated. | ||
In (a) it can be observed that with an increasing σs, i.e. increasing content of DOPS, the structural parameters d and dw decrease, while dhh shows a slight increase. While those parameters remain nearly constant over time, in (b) we can observe that (1 − ν) as a measure of the fraction of single (undocked) bilayers decreases significantly as a function of time for all stopped-flow data sets shown here. The increase of the fraction of adhered bilayers is most pronounced for DOPC:DOPS (1:4), indicating that the surface charge density σs is an important factor for triggering the adhesion-reaction. Prior to the collapse of the DOPC:DOPS (1:4) vesicles (cf.Fig. 3(c)), inferred from the emerging Bragg peak, the fraction of adhered bilayers is ν ≈ 0.5. Contrary, for DOPC:DOPS (10:1) and for DOPC:DOPS (1:1) ν ≈ 0.1 and ≈0.2, respectively.
In (c), the structural parameter dw obtained by the docking model analysis of the SAXS data (shown in (a)) is plotted as a function of dw,sim obtained from the simulations of the strong coupling theory. It can be observed, that the experimentally measured water spacings of the lipid bilayer, obtained for the different σs values, are well in line with the predictions from the strong coupling theory. For the simulated water distance predicted by strong coupling, the following parameters were chosen and kept constant for all systems: area per lipid headgroup dAH = 64 Å2, lB ≃ 7.11 × 10⁻¹⁰ m, λh = 2 × 10⁻¹⁰ m, Ph = 3.3 × 10⁹ J m−3, and T = 294 K. In contrast, the thickness of the headgroup dh,FWHM is taken from the fit results of dh by calculating the full width half maximum (FWHM), and more importantly, the surface charge density σs is varied corresponding to the molar ratios of the DOPC:DOPS mixtures and the Gouy–Chapman length μ is calculated accordingly. Further, it is of interest to also discuss the multi-lamellar final state of the DOPC:DOPS 1:4 system in view of strong coupling. From the position of the first Bragg peak qn=1 ≈ 1.208 1/nm, we obatain d ≈ 5.2 nm, and by subtraction of the bilayer thickness (as obtained from the least-square fit of the adhesion state), the water layer can be determined to dw ≈ 5.2 − 3.935 = 1.27 nm, again in good agreement with the predicted value dw,sim ≈ 1.25 nm. All additional fit results, in particular for dhh and dw as a function of time are shown in the appendix (Fig. S1, ESI†).
4.3 SAXS combined with microfluidics
After the evaluation of stopped-flow SAXS for vesicle adhesion, it is of interest to briefly address the suitability of a microfluidics setup for similar studies. Note that stopped flow and microfluidics sample environment could potentially access regimes, which are complementary in temporal resolution. With typical flow velocities on the order of vF ≃ 1 − 10 μm s−1 and minimal spatial sampling δx ≃ 1 − 10 μm defined by the relevant diffusion lengths and/or beam size, smallest reaction times would range in 100 μs ≤ tmin ≤ 10 ms, well below those accessible by the stopped flow chamber. At the same time, a SAXS image of the interaction zone is obtained by scanning SAXS, and potentially a down-scaling of the total volume. On the other hand, a tighter beam focus will compromise SAXS data quality. Further, the material and window choices compatible with microfluidic devices are more restrictive than those for stopped flow. To evaluate suitability, limitations and instrumental settings, we have carried out two exploratory microfluidic SAXS experiments, the first one using scanning SAXS with a micro-focused beam of 2.5 μm (horizontal) × 1.3 μm (vertical) at the GINIX endstation of the P10 beamline (PETRAIII storage ring, DESY), the second using a 30 μm (horizontal) × 30 μm (vertical) collimated beam defined by slits at the ID02 beamline (ESRF). For both experiments, identical home-built microfluidic devices made of Topas were used, placed vertically in a device holder with adaptation for tubing. The device holder was then positioned in the beam on the sample stage.Fig. 5 presents an overview of the setup and illustrates the micro-focus SAXS experiment at GINIX. In Fig. 5(a) a photo of the microfluidic device is shown, mounted on the sample tower, for alignment and subsequent scanning in x, y, and z. Coarse alignment and inspection of the flow was enabled by an on-axis video camera (OAV). A microfluidic layout with four-inlet/one-outlet channels was chosen for all devices. Flow properties were simulated by finite elements (COMSOL), see Fig. 5(b). Lipid vesicles were simulated as particles with 60 nm in diameter with the diffusion constant of D ≈ 8 × 10⁻¹² m2 s−1 and injected into the upper diagonal inlet. The flow rates are 100 μL h−1 and 25 μL h−1 for the diagonal inlets and for the side inlets, respectively. In this configuration, the side inlets focus the flow from the diagonal inlets. Along the outlet, diffusion of the particles outside of the focused stream can be observed. Finally, Fig. 5(c, d) show examples of integrated scattering intensity maps (darkfield maps), as recorded by scanning-SAXS with 1 s accumulation time for each frame. As indicated, 10 mg ml−1 extruded DOPS vesicles and 10 mM CaCl2 suspended in ultra-pure water were injected through the diagonal inlets at the flow rates of 25 μl h−1 to study the reaction upon mixing along the outlet. Ultra-pure water was injected through the side-inlets at the flow rates of 100 μl h−1. Each pixel represents the integrated photon counts from a single 2d-diffraction pattern. The darkfield images show an increase of the intensity in the vesicle inlet as well as in the mixing region, corresponding to the scattering from vesicles. In particular, a large increase of the intensity can be observed after the mixing of DOPS vesicles with CaCl2. The one-dimensional curves I(q) vs. q, obtained by azimuthal integration of the 2d diffraction patterns, are exemplified in Fig. 5(e) for selected points along the reaction line. The corresponding locations are indicated by numbers in Fig. 5(d). Note that the raw data are shown before background subtraction. Qualitatively, the curves 1 and 2 show an aggregated state of vesicles with an emerging multilamellar Bragg peak modulated by the bilayer form factor. Along the outlet, a phase coexistence regime of different multilamellar states can be observed, see Bragg peaks of curves 3 and 4. From previous experiments it is known that DOPS vesicles mixed with CaCl2 show a transition to a monophasic multilamellar state.20 Accordingly, the multilamellar state obtained from the microfluidics SAXS experiments shown here has not reached its equilibrium state.
 | ||
| Fig. 5 (a) Photograph of the microfluidic setup integrated into the GINIX endstation at P10, DESY. (b) COMSOL simulation of a microfluidic flow profile showing the concentration of the particles representing lipid vesicles with the diffusion constant of D ≈ 8 × 10⁻¹² m2 s−1. (c) Darkfield of the microfluidic device obtained by scanning-SAXS. 10 mg ml−1 DOPS vesicles are mixed with 10 mM CaCl2 suspended in ultra-pure water and injected through the diagonal inlets with the flow-rates of 25 μl h−1. Ultra-pure water is injected through the side inlets with the flow-rates of 100 μl h−1. (d) Darkfield of the microfluidic device shown in (c) obtained by scanning-SAXS, showing a larger scan of the outlet. (e) Selected 1d curves corresponding to the positions marked in (d). Along the reaction path (position 1 to 4), a transition from an rather aggregated state (1, 2) to a co-existing multilamellar state can be observed. | ||
The darkfield maps and the SAXS curves reveal the limitations of the configuration: high background and limited q-range. Aside from background generated by the chamber itself, the micro-focusing by compound refractive lenses (CRL) and the relatively large beam path in air both compromise the SAXS quality. While the strong multilamellar signals can still be extracted under these conditions, the much weaker signal of unilamellar vesicles (see the vesicle inlet in the darkfield map) does not reveal much structural information. For this reason, the second experiment at ID02/ESRF used a much more optimized configuration for SAXS, and keeping air paths at minimum, albeit sacrificing spatial and hence also temporal resolution.
Fig. 6 and 7 presents examples of SAXS data recorded in this configuration. In this setting, it became possible to study vesicle adhesion of DOPC:DOPS mixtures at varied molar ratios mixing with CaCl2. Fig. 6 shows the results obtained by microfluidic SAXS for DOPC:DOPS (1:1) vesicles mixed with a 4 mM CaCl2 solution suspended in ultra-pure water. The samples were injected through the diagonal inlets as indicated in (a) by the darkfield obtained by scanning SAXS of the microfluidic device. The flow rates were 100 μl h−1 and 0 μl h−1 for the diagonal and the vertical inlets, respectively. For a point-wise background subtraction, the device was previously measured with only ultra-pure water being injected in the channels. (b) shows an example of a background corrected SAXS signal corresponding to the position [1] highlighted in the darkfield. The background corrected SAXS signal were analyzed by fitting the docking model to the SAXS data as exemplified in (c) for three SAXS signals, corresponding to the positions [1], [2] and [3] highlighted in the darkfield. For the positions [1] and [3] no reaction with CaCl2 is expected, while position [2] corresponds to the mixing region. The fraction of adhered bilayers quantified by ν is slightly increased for the SAXS signal from position [2] (ν = 0.04 at position [2], compared to ν = 0.01 at position [1], and [3]), indicating that a small adhesion-reaction can be observed. The water spacing dw ≈ 1.7 nm is well in line with the results obtained by flow-through and stopped-flow SAXS discussed above.
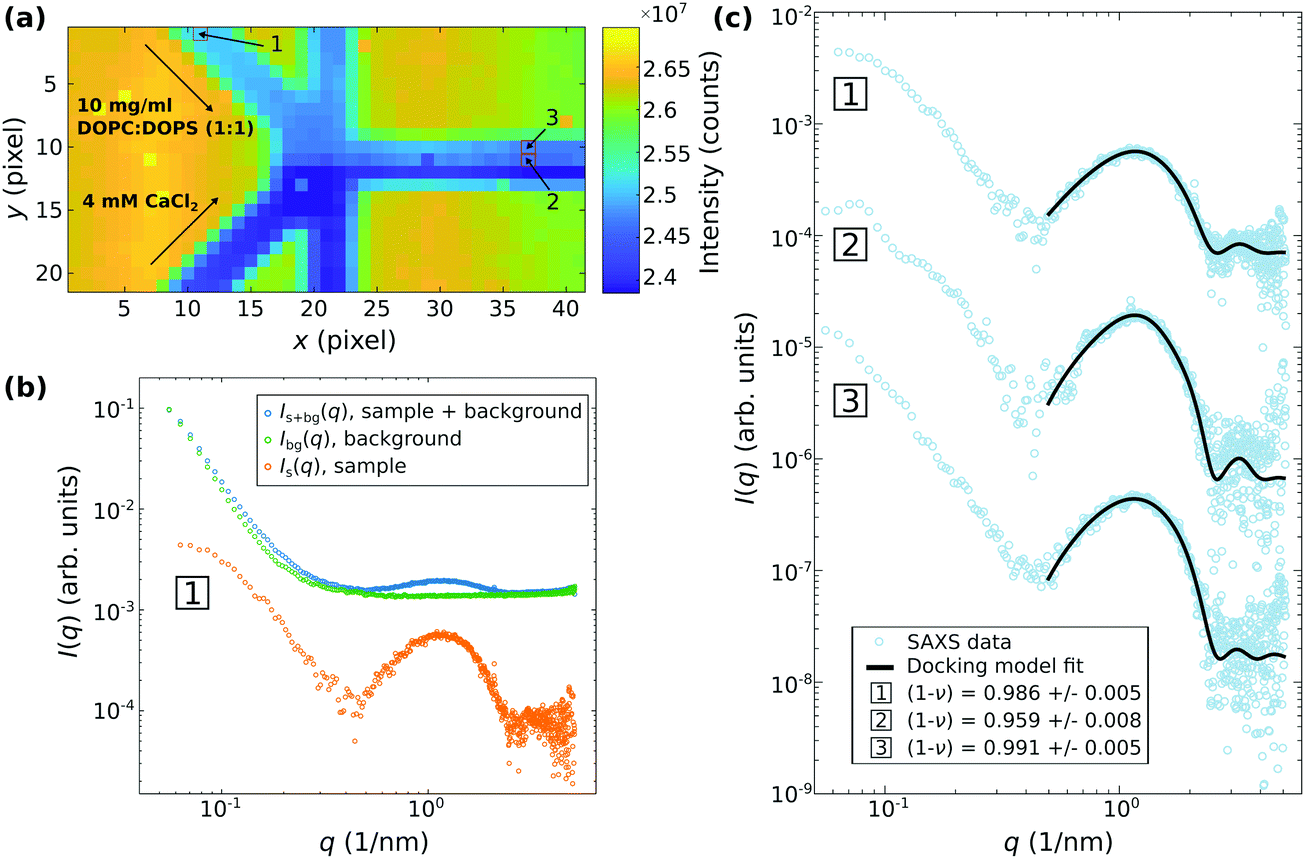 | ||
| Fig. 6 Scanning-SAXS combined with microfluidics for the investigation of the reaction of 10 mg ml−1 DOPC:DOPS (1:1) vesicles with 4 mM CaCl2, both suspended in ultra-pure water, in a microfluidic flow. (a) Darkfield of the microfluidic device obtained by scanning-SAXS. The exposure time was 1 s for each pixel. The value shown in each pixel is the integrated intensity of the two dimensional SAXS pattern recorded at the respective position. The flow rates are 100 μl h−1 and 0 μl h−1 for the diagonal and the vertical inlets, respectively. The inlets of the DOPC:DOPS (1:1) vesicles and the CaCl2 solutions are as indicated. (b) Example of a background corrected SAXS signal I(q) = Is+bg(q) − Ibg(q) obtained from DOPC:DOPS (1:1) vesicles. The background (ultra-pure water) was measured separately by scanning SAXS in the same microfluidic device, so that background correction can be performed at the same position. (c) Docking model fits to SAXS data corresponding to the positions [1], [2] and [3] highlighted in the darkfield in (a). The structural parameter (1 − ν) is significantly lower for the SAXS data from position [2], indicating adhesion of vesicles in the mixing region. | ||
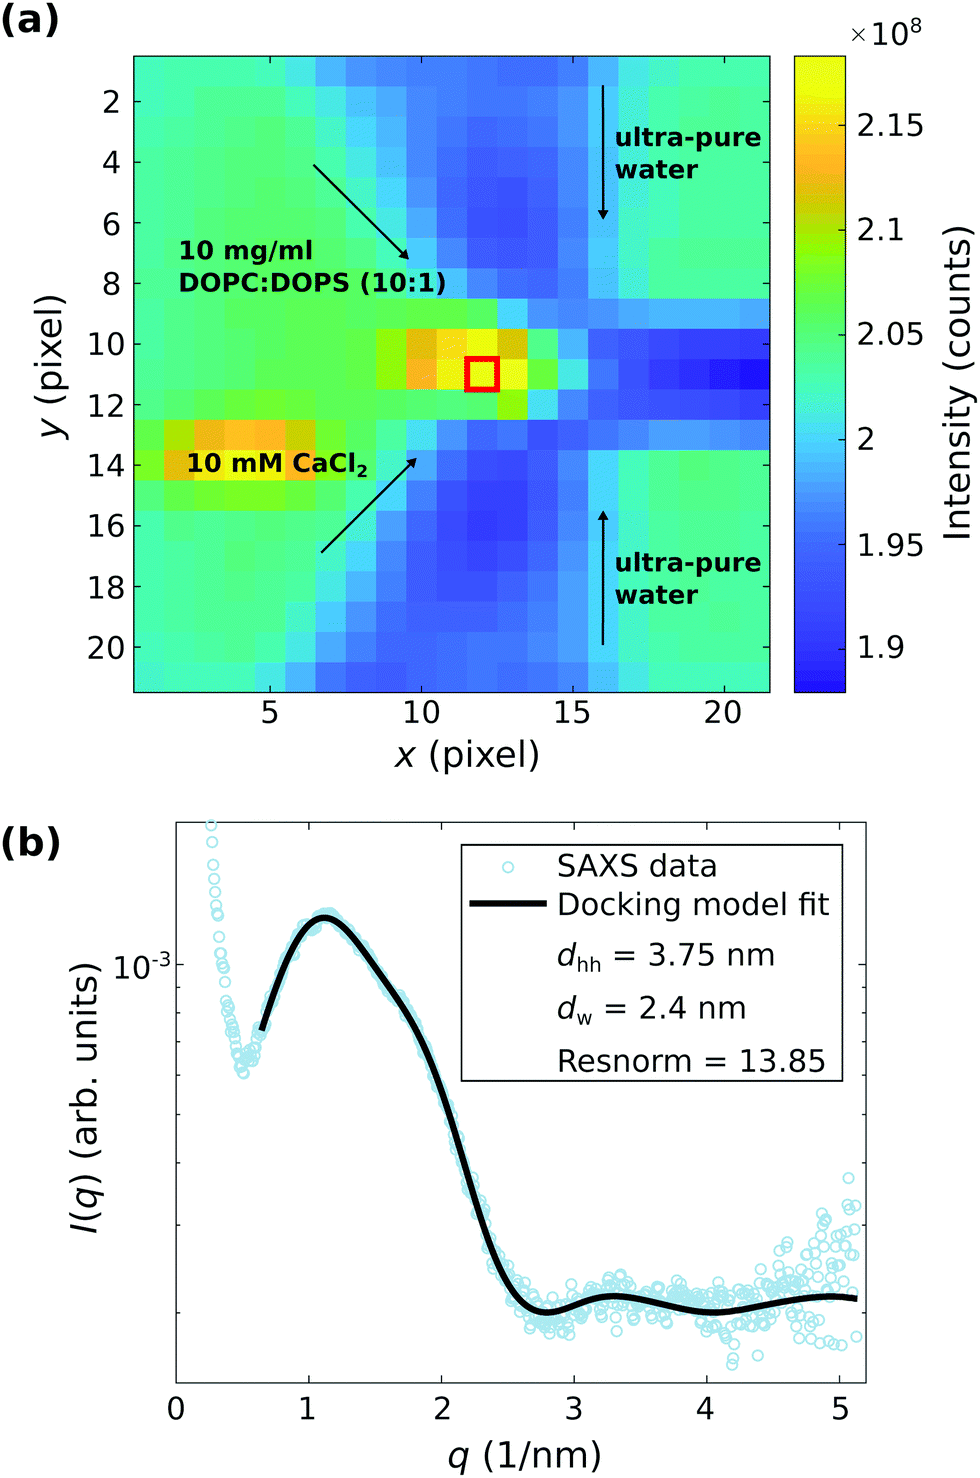 | ||
| Fig. 7 Scanning-SAXS combined with microfluidics for the investigation of the reaction of 10 mg ml−1 DOPC:DOPS (10:1) vesicles with 10 mM CaCl2, both suspended in ultra-pure water, in a microfluidic flow, with a particular focus on the point of stagnation. (a) Darkfield of the microfluidic device obtained by scanning-SAXS. The exposure time was 1 s for each pixel. The value shown in each pixel is the integrated intensity of the two dimensional SAXS pattern recorded at the respective position. The flow rates are 50 μl h−1 and 100 μl h−1 for the diagonal and the vertical inlets, respectively. The inlets of the DOPC:DOPS (10:1) vesicles and the CaCl2 solutions are as indicated. (b) Docking model fit to the background corrected SAXS curve I(q) vs. q corresponding to the position highlighted in (a) by the red rectangle. | ||
Fig. 7 shows much stronger evidence for the adhesion state for DOPC:DOPS (10:1) vesicles and 10 mM CaCl2, again along with the corresponding least-square fits. However, this signal is observed only at the stagnation point (almost zero flow rate), and not at other points in the channel with higher flow rates, see the darkfield map in (a) with the point of stagnation highlighted by a red box. The scattering curves I(q) vs. q taken from the point of stagnation show indeed the characteristic structure factor modulations corresponding to adhesion of the vesicles, which is exemplified in (b) by the background corrected SAXS signal corresponding to the position marked in (a). The docking model analysis reveals an interbilayer spacing of dw = 2.4 nm, which is in good agreement with the results obtained by the stopped-flow SAXS data and the theory of strong coupling, as discussed above.
5 Conclusions
We conclude that time-resolved SAXS with a stopped-flow chamber reveals a transient adhesion state induced by divalent ions for vesicles with high charge density before the system transforms to a multilamellar phase. This transient state could not have been observed with static SAXS, and gives important clues about the conditions of arrested adhesion, i.e. meta-stable vesicle binding versus topological transformation into multilamellar vesicles. The first scenario, which we have already observed before by static SAXS, applies to low and moderate charge density, and is associated with only a small adhesion zone (low parameter ν). Contrarily, the full reaction to a multilamellar state is preceded by a large surface of adhesion, presumingly providing the energy required to overcome the barriers of vesicle rupture. At the same time the water layer thickness in the adhesion zone is in both cases governed by strong electrostatic interaction.The current study has also solidified and extended the experimental basis of this very interesting effect of like-charge attraction, predicted by the theory of strong coupling. For the first time, the surface charge density of the bilayers and hence the coupling parameter was varied to study the corresponding variation in water layer distance. To this end, different molar ratios of the DOPC:DOPS mixtures were probed. Our previous study of vesicle adhesion in a DOPC:DOPS (1:1) mixture20 was also extended concerning the type of divalent ions used. As we have shown, adhesion is induced not only by CaCl2 and MgCl2, but also by SrCl2 and ZnCl2. Importantly, variation of ions results only in small changes of the water layer thickness, as expected from strong coupling theory. Whether ion radius and polarizability can account for these differences remains to be investigated. The interbilayer spacings for different surface charge densities, i.e. for different coupling parameters ranging from Ξ ≈ 4… 30, were in good agreement with the strong coupling theory. Deviations between the experiments and the simulations of the strong coupling theory could eventually be attributed to a change of the effective dielectric constant of water, which was kept constant (ε = 80) for all coupling parameters. Recent water-explicit numerical simulations of nanometer-separated charged surfaces revealed a surface charge-induced reorientation of hydration water, which modifies the dielectric constant of water as well as the hydration repulsion.39
Concerning experimental settings of the microfluidics experiments, we conclude that the signal quality of scanning SAXS with focused beams, while desirable in terms of temporal and spatial resolution, strongly compromises data quality at the present configurations. Future improvements will address more options for cleaning of the beam as well as a configuration with tightly evacuated flight paths. Further reduction of the chamber background scattering for example by thinner windows (presently 120 μm total thickness), and possibly also by the processing protocol are also important. Finally, a layout with 5 inlets would be well suited to avoid a stagnation point, which often led to unwanted formation of large lipid aggregates which in turn impeded proper microfluidic flow.
With all of these improvements in place, we anticipate that both microfluidics and stopped flow experiments will enable kinetic studies of vesicle transformation and reactions in a complementary manner. Already in the present proof-of-concept study and under current parameters, the time-resolved SAXS data has allowed us to probe the structure of a transient adhesion state of highly charged vesicles induced by calcium injection. Importantly, the binding of like-charged vesicles in this state results in a spacing which is in very good agreement with strong binding theory, predicted more than fifteen years ago. This example demonstrates, that transient vesicle states can not only be evidenced but that the corresponding structures can be described in quantitative terms. This opens up an interesting perspective in applications of this approach for biological vesicles undergoing shape transformations and functionally important transitions. Understanding the docking and fusion reaction of synaptic vesicles (SVs), for example, is of significant interest in view of a quantitative understanding of chemical synapses. To this end, we include a first test exposure of SVs in a microfluidic device, comparing the present data quality with respect to static SAXS (Fig. S3, ESI†).
Conflicts of interest
There are no conflicts to declare.Acknowledgements
We thank Theyencheri Narayanan and Michael Sprung for excellent working conditions and advice at beamlines ID02/ESRF and P10/PETRAIII (DESY), respectively, and Theyencheri Narayanan in particular for the introduction to the stopped-flow instrumentation. We acknowledge Diego Pontoni and Pierre Lloria for sharing their resources and expertise and the entire support provided in the framework of the Partnership for Soft Condensed Matter (PSCM) before and during our beamtimes at ESRF. We thank Yihui Xu, Kilian Frank and Max Scheu, for support during beamtimes, and Susanne Hengst for help in sample preparation. We also thank Julia Preobraschenski, Marcelo Ganzella and Reinhard Jahn for a related collaboration on synaptic vesicle SAXS, which has motivated some of the technical aspects of this study, and which will be reported in a forthcoming publication. Further, we acknowledge ESRF and DESY photon science for beamtime. This work was supported financially by Sonderforschungsbereich 803 “Functionality Controlled by Organization in and between Membranes”, and by Sonderforschungsbereich 1286 “Quantitative Synaptology”, funded by Deutsche Forschungsgemeinschaft.References
- J. N. Israelachvili, Intermolecular and Surface Forces: With Applications to Colloidal and Biological Systems, Academic Press, 1992 Search PubMed.
- D. Andelman, Electrostatic properties of membranes: the Poisson–Boltzmann theory, Handbook of biological physics, 1995, vol. 1, pp. 603–642 Search PubMed.
- T. Markovich, D. Andelman and R. Podgornik, Charged membranes: Poisson–Boltzmann theory, dlvo paradigm and beyond, 2016, ArXiv e-prints.
- S. Takamori, M. Holt, K. Stenius, E. A. Lemke, M. Grønborg, D. Riedel, H. Urlaub, S. Schenck, B. Brügger, P. Ringler, S. A. Müller, B. Rammner, F. Gräter, J. S. Hub, B. L. De Groot, G. Mieskes, Y. Moriyama, J. Klingauf, H. Grubmüller, J. Heuser, F. Wieland and R. Jahn, Molecular anatomy of a trafficking organelle, Cell, 2006, 127(4), 831–846 CrossRef CAS PubMed.
- R. Jahn and R. H. Scheller, SNAREs: engines for membrane fusion, Nat. Rev. Mol. Cell Biol., 2006, 7(9), 631–643 CrossRef CAS PubMed.
- J. M. Hernandez, A. Stein, E. Behrmann, D. Riedel, A. Cypionka, Z. Farsi, P. J. Walla, S. Raunser and R. Jahn, Membrane fusion intermediates via directional and full assembly of the snare complex, Science, 2012, 336(6088), 1581–1584 CrossRef CAS PubMed.
- J. Diao, P. Grob, D. J. Cipriano, M. Kyoung, Y. Zhang, S. Shah, A. Nguyen, M. Padolina, A. Srivastava, M. Vrljic, A. Shah, E. Nogales, S. Chu and A. T. Brunger, Synaptic proteins promote calcium-triggered fast transition from point contact to full fusion, eLife, 2012, 1, e00109 CrossRef PubMed.
- A. Grafmüller, J. Shillcock and R. Lipowsky, The fusion of membranes and vesicles: Pathway and energy barriers from dissipative particle dynamics, Biophys. J., 2008, 96(7), 2658–2675 CrossRef PubMed.
- H. Jelger Risselada and H. Grubmüler, How snare molecules mediate membrane fusion: recent insights from molecular simulations, Curr. Opin. Struct. Biol., 2012, 22(2), 187–196 CrossRef PubMed.
- U. Seifert, K. Berndl and R. Lipowsky, Shape transformations of vesicles: Phase diagram for spontaneous- curvature and bilayer-coupling models, Phys. Rev. A: At., Mol., Opt. Phys., 1991, 44, 1182–1202 CrossRef CAS PubMed.
- V. Adrian Parsegian, van der Waals Forces: A Handbook for Biologists, Chemists, Engineers, and Physicists, Cambridge University Press, Cambridge, 2005 Search PubMed.
- R. R. Netz and R. Lipowsky, Unbinding of symmetric and asymmetric stacks of membranes, Phys. Rev. Lett., 1993, 71, 3596–3599 CrossRef CAS PubMed.
- R. R. Netz, Electrostatistics of counter-ions at and between planar charged walls: From Poisson-Boltzmann to the strong-coupling theory, Eur. Phys. J. E: Soft Matter Biol. Phys., 2001, 5(1), 557–574 CrossRef CAS.
- A. G. Moreira and R. R. Netz, Binding of similarly charged plates with counterions only, Phys. Rev. Lett., 2001, 87, 078301 CrossRef CAS PubMed.
- A. G. Moreira and R. R. Netz, Simulations of counterions at charged plates, Eur. Phys. J. E: Soft Matter Biol. Phys., 2002, 8(1), 33–58 CrossRef CAS PubMed.
- A. Naji, S. Jungblut, A. G. Moreira and R. R. Netz, Electrostatic interactions in strongly coupled soft matter, Phys. A., 2005, 352(1), 131–170 CrossRef.
- Z. K. Issa, C. W. Manke, B. P. Jena and J. J. Potoff, Ca2+ bridging of apposed phospholipid bilayers, J. Phys. Chem. B, 2010, 114(41), 13249–13254 CrossRef CAS PubMed.
- H.-H. Gavin Tsai, W.-X. Lai, H.-D. Lin, J.-B. Lee, W.-F. Juang and W.-H. Tseng, Molecular dynamics simulation of cation-phospholipid clustering in phospholipid bilayers: Possible role in stalk formation during membrane fusion, Biochim. Biophys. Acta, Biomembr., 2012, 1818(11), 2742–2755 CrossRef PubMed.
- M. Pannuzzo, D. H. De Jong, A. Raudino and S. J. Marrink, Simulation of polyethylene glycol and calcium-mediated membrane fusion, J. Chem. Phys., 2014, 140(12), 124905 CrossRef PubMed.
- K. Komorowski, A. Salditt, Y. Xu, H. Yavuz, M. Brennich, R. Jahn and T. Salditt, Vesicle adhesion and fusion studied by small-angle X-ray scattering, Biophys. J., 2018, 114(8), 1908–1920 CrossRef CAS PubMed.
- L. Fink, A. Steiner, O. Szekely, P. Szekely and U. Raviv, Structure and interactions between charged lipid membranes in the presence of multivalent ions, Langmuir, 2019, 35(30), 9694–9703 CrossRef CAS PubMed.
- T. Mukhina, A. Hemmerle, V. Rondelli, Y. Gerelli, G. Fragneto, J. Daillant and T. Charitat, Attractive interaction between fully charged lipid bilayers in a strongly confined geometry, J. Phys. Chem. Lett., 2019, 10(22), 7195–7199 CrossRef CAS PubMed.
- G. Pabst, M. Rappolt, H. Amenitsch, S. Bernstorff and P. Laggner, X-ray kinematography of temperature-jump relaxation probes the elastic properties of fluid bilayers, Langmuir, 2000, 16(23), 8994–9001 CrossRef CAS.
- Z. Varga, A. Wacha and A. Bóta, Osmotic shrinkage of sterically stabilized liposomes as revealed by time-resolved small-angle X-ray scattering, J. Appl. Crystallogr., 2014, 47(1), 35–40 CrossRef CAS.
- A. Yaghmur, B. Sartori and M. Rappolt, The role of calcium in membrane condensation and spontaneous curvature variations in model lipidic systems, Phys. Chem. Chem. Phys., 2011, 13(8), 3115–3125 RSC.
- A. Yaghmur, P. Laggner, B. Sartori and M. Rappolt, Calcium triggered l alpha-h2 phase transition monitored by combined rapid mixing and time-resolved synchrotron saxs, PLoS One, 2008, 3(4), e2072 CrossRef PubMed.
- S. Köster and T. Pfohl, X-ray studies of biological matter in microfluidic environments, Mod. Phys. Lett. B, 2012, 26(26), 1230018 CrossRef.
- A. Ghazal, M. Gontsarik, J. P. Kutter, J. P. Lafleur, A. Labrador, K. Mortensen and A. Yaghmur, Direct monitoring of calcium-triggered phase transitions in cubosomes using small-angle X-ray scattering combined with microfluidics, J. Appl. Crystallogr., 2016, 49(6), 2005–2014 CrossRef CAS.
- A. Ghazal, M. Gontsarik, J. P. Kutter, J. P. Lafleur, D. Ahmadvand, A. Labrador, S. Salentinig and A. Yaghmur, Microfluidic platform for the continuous production and characterization of multilamellar vesicles: A synchrotron small-angle X-ray scattering (saxs) study, J. Phys. Chem. Lett., 2017, 8(1), 73–79 CrossRef CAS . PMID: 27936765.
- A. S. Poulos, M. Nania, P. Lapham, R. M. Miller, A. J. Smith, H. Tantawy, J. Caragay, J. Gummel, O. Ces, E. S. J. Robles and J. T. Cabral, Microfluidic saxs study of lamellar and multilamellar vesicle phases of linear sodium alkylbenzenesulfonate surfactant with intrinsic isomeric distribution, Langmuir, 2016, 32(23), 5852–5861 CrossRef CAS PubMed.
- M. Denz, G. Brehm, C. Y. J. Hemonnot, H. Spears, A. Wittmeier, C. Cassini, O. Saldanha, E. Perego, A. Diaz, M. Burghammer and S. Koster, Cyclic olefin copolymer as an X-ray compatible material for microfluidic devices, Lab Chip, 2018, 18(1), 171–178 RSC.
- E. Samson, J. Marchand and K. A. Snyder, Calculation of ionic diffusion coefficients on the basis of migration test results, Mater. Struct., 2003, 36(3), 156–165 CrossRef CAS.
- T. Narayanan, M. Sztucki, P. Van Vaerenbergh, J. Léonardon, J. Gorini, L. Claustre, F. Sever, J. Morse and P. Boesecke, A multipurpose instrument for time-resolved ultra-small-angle and coherent X-ray scattering, J. Appl. Crystallogr., 2018, 51(6), 1511–1524 CrossRef CAS PubMed.
- T. Salditt, M. Osterhoff, M. Krenkel, R. N. Wilke, M. Priebe, M. Bartels, S. Kalbfleisch and M. Sprung, Compound focusing mirror and X-ray waveguide optics for coherent imaging and nano-diffraction, J. Synchrotron Radiat., 2015, 22(4), 867–878 CrossRef CAS PubMed.
- T. Narayanan, J. Gummel and M. Gradzielski, in Chapter seven – probing the self-assembly of unilamellar vesicles using time-resolved saxs, ed. A. Iglič and C. V. Kulkarni, Advances in Planar Lipid Bilayers and Liposomes, Academic Press, 2014, vol. 20, pp. 171–196 Search PubMed.
- B. Angelov, A. Angelova, M. Drechsler and S. Lesieur, Rapid mixing stopped-flow small-angle X-ray scattering study of lipoplex formation at beamline id02@esrf, J. Surf. Invest.: X-Ray, Synchrotron Neutron Tech., 2015, 9(1), 105–110 CrossRef CAS.
- F. A. Heberle, J. Pan, R. F. Standaert, P. Drazba, N. Kucerka and J. Katsaras, Model-based approaches for the determination of lipid bilayer structure from small-angle neutron and X-ray scattering data, Eur. Biophys. J., 2012, 41(10), 875–890 CrossRef CAS PubMed.
- M. R. Brzustowicz and A. T. Brunger, X-ray scattering from unilamellar lipid vesicles, J. Appl. Crystallogr., 2005, 38(1), 126–131 CrossRef CAS.
- A. Schlaich, A. P. dos Santos and R. R. Netz, Simulations of nanoseparated charged surfaces reveal charge-induced water reorientation and nonadditivity of hydration and mean-field electrostatic repulsion, Langmuir, 2019, 35(2), 551–560 CrossRef CAS PubMed.
Footnote |
| † Electronic supplementary information (ESI) available. See DOI: 10.1039/d0sm00259c |
| This journal is © The Royal Society of Chemistry 2020 |