Open Access Article
This Open Access Article is licensed under a
Creative Commons Attribution 3.0 Unported Licence

Correction: Crystal structure and metallization mechanism of the π-radical metal TED

Yuka Kobayashi *a, Kazuto Hirata a, Samantha N. Hood b, Hui Yang b, Aron Walsh *b, Yoshitaka Matsushita a and Kunie Ishioka a
aNational Institute for Materials Science (NIMS), Sengen 1-2-1, Tsukuba, Ibaraki, Japan. E-mail: kobayashi.yuka@nims.go.jp
bDepartment of Materials, Imperial College London, Exhibition Road, London SW7 2AZ, UK. E-mail: a.walsh@imperial.ac.uk

Received 15th October 2020 , Accepted 15th October 2020

First published on 22nd October 2020


Abstract

Correction for ‘Crystal structure and metallization mechanism of the π-radical metal TED’ by Yuka Kobayashi et al., Chem. Sci., 2020, DOI: 10.1039/d0sc03521a.


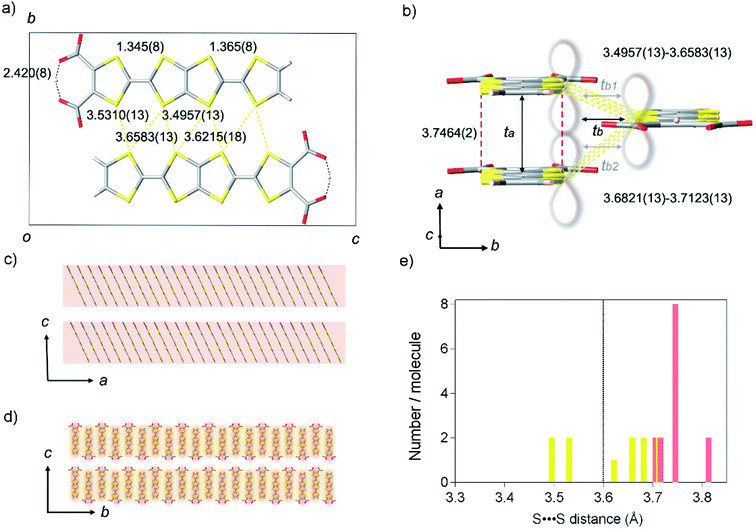
The authors regret an error in Fig. 2e where the dotted line, acting as a guide to readers, was in the incorrect position. The corrected version is included here.
image file: d0sc90231d-f2.tif
Fig. 2 Crystal structure of TED. (a) A unit cell projected on the a-axis, represented with black square, consisting of two TED molecules with intermolecular distances of S⋯S contacts (yellow dotted line) and intramolecular hydrogen bond (black dotted line) in unit of Ångstrom. (b) A molecular stacking unit along the a and b-axes. Red break and yellow dotted lines show face-to-face and side-by-side intermolecular distances of S⋯S contacts, where π-orbital orbitals overlap longitudinally along the a-axis and transversely along the b-axis, respectively, as is guided with the lobe image. Black arrows display the transfer integrals ta (599 meV), tb (60 meV), which is averaged [tb = (tb1 (69 meV) + tb2 (51 meV))/2]. (c and d) Super-structures of the TED molecular units crossing the c-axis; (c) stacking along the a direction; electric conduction occurs predominantly within the TED molecular layer, (d) stacking along the b direction. Red and yellow shadows show the anisotropic conduction pathways with ta and tb, respectively, in contrast, inter-layer conductions along the c-axis are much lower with tc ∼ 0. (e) Distribution of S⋯S distance in one molecule with an indication of van der Waals sum distance (black dotted line). Only one site was counted in the nearest neighbors with the same symmetry operation. Red and yellow bars show the contact along the a-axis and the b-axis, respectively.

The correction of Fig. 2e does not influence further discussion, or the conclusions of the article.

The Royal Society of Chemistry apologises for these errors and any consequent inconvenience to authors and readers.


This journal is © The Royal Society of Chemistry 2020