 Open Access Article
Multi-objective de novo molecular design of organic structure-directing agents for zeolites using nature-inspired ant colony optimization†
Koki
Muraoka‡
 ,
Watcharop
Chaikittisilp§
 * and
Tatsuya
Okubo
 *
*
Department of Chemical System Engineering, The University of Tokyo, 7-3-1 Hongo, Bunkyo-ku, Tokyo 113-8656, Japan. E-mail: okubo@chemsys.t.u-tokyo.ac.jp
First published on 20th July 2020
Abstract
Organic structure-directing agents (OSDAs) are often employed for synthesis of zeolites with desired frameworks. A priori prediction of such OSDAs has mainly relied on the interaction energies between OSDAs and zeolite frameworks, without cost considerations. For practical purposes, the cost of OSDAs becomes a critical issue. Therefore, the development of a computational de novo prediction methodology that can speed up the trial-and-error cycle in the search for less expensive OSDAs is desired. This study utilized a nature-inspired ant colony optimization method to predict physicochemically and/or economically preferable OSDAs, while also taking molecular similarity and heuristics of zeolite synthesis into consideration. The prediction results included experimentally known OSDAs, candidates having structures closely related to known OSDAs, and novel ones, suggesting the applicability of this approach.
Introduction
The deployment of materials in commercial products needs to satisfy multiple requirements including properties, durability, economic efficiency, and environmental regulations. A class of microporous silicate-based materials known as zeolites has overcome the valley of death to be adapted in several applications such as catalysis and separation.1 Zeolites can be synthesized under hydrothermal conditions, where inorganic and/or organic cations, together with water molecules, fit within the interior spaces of the anionic silicate-based frameworks to direct the crystallization of specific crystalline phases.2 Diversification and tuning of organic structure-directing agents (OSDAs), which are typically organic cations, have been a major driving force in expanding the number of available zeolite structures to over 240.3,4 The use of OSDAs can, however, increase the production cost of zeolites and entails additional processes for removal of OSDAs (mostly combustion) and wastewater treatment.In fact, industrially important zeolites such as FAU, FER, MOR, LTA and LTL zeolites can be produced without using OSDAs.5 On the other hand, structures including *BEA, CHA, AEI, and CON zeolites, which typically need OSDAs for their syntheses, have also gathered interest due to their remarkable catalytic properties.6–8 In order to advance the implementation of such cost-intensive materials, modification of typical synthetic routes is necessary. A previous research study proposed three strategies for the cost reduction of synthesis of zeolites with OSDAs, namely, OSDA-free synthesis, recycling of OSDAs, and replacement of OSDAs.9
Conventional OSDA-free synthesis has been explored for decades under a wide range of synthesis conditions to produce about 30 aluminosilicate zeolites.5 The recent expansion of OSDA-free synthetic routes has mainly been driven by the use of seed crystals, which are synthesized from conventional routes using OSDAs.10 The secondary use of the synthesized product as seeds can substantially reduce the amount of OSDAs required for synthesis,11 although the number of applicable systems seems to be limited. In the second strategy, OSDAs in zeolites are recycled by breaking and reuniting cyclic ketal groups in OSDA molecules.12 However, the implementation of recyclable functional groups significantly limits the freedom of OSDA design, limiting the applicability of the approach.
Replacement of complex and expensive OSDAs with simpler ones has been successful in several cases.9,13–17 Furthermore, instead of relying on time-consuming trial-and-error experiments to find reasonable alternative OSDAs, molecular modeling can tackle the problem. An OSDA's ability to direct the crystallization of zeolites is well understood to be mainly derived from van der Waals interactions and charge compensation between OSDAs and inorganic zeolite frameworks. Even though crystallization of zeolites is strongly governed by kinetics,18 computational modeling of the host–guest interactions can accurately describe the outcomes from hydrothermal synthesis,19–24 selectivity against competing phases,25,26 configurations of OSDAs,27–29 and location of Al in zeolites with OSDAs.30
Employment of the host–guest interactions as the objective function has been realized in de novo molecular design methodologies for zeolite–OSDA systems. The first example of the methodology demonstrated that stochastic algorithms can grow organic molecules inside the zeolite frameworks.19 However, the growth algorithm also yields organic molecules that are difficult or impossible to synthesize. This issue was solved in recent studies by Deem and his co-workers,31 where an evolutionary algorithm treats an array of readily available reagents and known chemical reactions as a genetic sequence for producing candidate OSDAs. The method can predict OSDAs along with synthetic pathways and stabilization energies, which are useful to verify in zeolite synthesis.16,22,26,32,33 However, this evolutionary algorithm may sometimes predict trivial, unrealistic, and/or economically less advantageous candidates.31,33
Design of OSDAs is a multi-objective problem. Several issues, including stabilization energy, cost of reagents, synthetic pathways, and environmental compatibility, must be considered simultaneously, making it a complicated Pareto optimization problem. The difficulty is apparent in the network of organic chemistry where molecules are regarded as nodes and chemical reactions are regarded as edges.34,35 The exploration of the large chemical network to find the optimal compound is computationally demanding and requires meta-heuristic approaches that are particularly suited for network-based problems.
The present study solves the multi-objective problem of OSDA design using a nature-inspired ant colony optimization (ACO) algorithm.36 The methodology can optimize stabilization energy of zeolite–OSDA systems by considering the cost of reagents and molecular similarity, thus screening the large database of available reagents. The stabilization energy and/or cost of the predicted results surpass those of current state-of-the-art OSDAs, proving the efficiency of the method used.
Results and discussion
Although synthesis of OSDAs occasionally requires multiple synthetic steps using various organic reactions, most of the practically achievable OSDAs are produced by alkylation of amines with organic halides. If we focus on particular organic reactions, de novo design algorithms including ACO can be efficiently used. Therefore, the scope of OSDAs considered here is limited to the products of alkylation of commercially available amines and halides.The library of available organic compounds was retrieved from commercial suppliers.37–40 This dataset containing 97![[thin space (1/6-em)]](https://www.rsc.org/images/entities/char_2009.gif) 132 compounds was reduced by eliminating molecules with elements other than carbon, hydrogen, nitrogen, chlorine, bromine, and iodine. Molecules unable to participate in the alkylation reaction were taken out of consideration. After removing duplicated entries, 1241 halides and 5144 amines are present in our database. The combination of 6
132 compounds was reduced by eliminating molecules with elements other than carbon, hydrogen, nitrogen, chlorine, bromine, and iodine. Molecules unable to participate in the alkylation reaction were taken out of consideration. After removing duplicated entries, 1241 halides and 5144 amines are present in our database. The combination of 6![[thin space (1/6-em)]](https://www.rsc.org/images/entities/char_2009.gif) 383
383![[thin space (1/6-em)]](https://www.rsc.org/images/entities/char_2009.gif) 704 is too large for one-by-one molecular dynamics (MD) simulations.
704 is too large for one-by-one molecular dynamics (MD) simulations.
To tackle the massive number of combinations, we use ACO, which is a general meta-heuristic optimization algorithm inspired by nature. When a biological ant tries to take food to its nest, it tracks the pheromones deposited on the route that were secreted by other ants. At first, ants move randomly because they do not know the overall network information composed of the places (nodes) and the routes (edges). By just following the high-pheromone path, they will eventually find the best route because efficient routes tend to be frequently visited in the past. To computationally mimic such behavior, ACO uses “artificial ant agents” that track “pheromones” on a network.36 In ACO, pheromones are numerical information that is assigned to edges in the network. An ant agent stochastically selects the next edge with the probability proportional to the number of pheromones. The amount of pheromone is updated for each run from scores of the objective function to be optimized.
The ability of ACO to find the best route from a network is suited for solving network-based problems such as the traveling salesman problem.41 ACO has also been applied to chemical networks, for instance, to reductive amination for construction of predictive models of structure–activity relationships.42,43 The efficiency of ACO in chemical networks was demonstrated in the implementation of the de novo design in automated synthesis and assay systems.
Fig. 1 schematically represents a single step of our ACO. Firstly, we create 10 ant agents that form called a colony. Each ant agent selects an amine with the probability proportional to the corresponding pheromone amount. Then, it selects a halide in the same way. A virtual alkylation reaction is performed from the selected amine and halide. If reactive orbitals remain in the resulting molecule, a further alkylation reaction is applied using the selected amine or halide (i.e., partial alkylation was not allowed here). The resulting quaternary ammonium cation is subsequently evaluated using multiple filters. If the candidate molecule satisfies the criteria, MD simulation is conducted to evaluate the stabilization energy, which becomes the score of the ant agent. After running 10 ants, the pair of nodes visited by the best ant receives pheromones. As is well known, structurally similar OSDAs sometimes crystallize the same zeolites.44 This algorithm gives an additional amount of pheromone to the reagents that are structurally similar to the globally best reagent. This single step is repeated multiple times.
The first filter eliminates cyclic ammoniums with significant distortions. Unlike actual organic synthesis, the virtual reaction can produce highly distorted rings such as three or four-membered rings and five membered-rings containing triple bonds. To reject candidates with these significant distortions, we counted the numbers and types of bonds in an ammonium ring (see the Computational methods section for details). The second filter is the degree of hydrophobicity of cations. It is generally accepted that OSDAs need to have a moderate hydrophobicity to be dissolved in aqueous solutions and to interact with hydrophobic zeolite frameworks.45 The hydrophobicity of OSDAs can be determined by a partitioning experiment that evaluates the degree of phase transfer of OSDA salts from water to the organic solvent, mostly chloroform or octanol. The chloroform–water partition coefficients have been correlated with C/N+ atomic ratios of efficient OSDAs.46 Using this knowledge, we reject candidates with too low (≤5) and too high (≥18) C/N+.
The rotational freedom of OSDAs is another effective metric to screen candidate molecules. Molecules with many rotatable bonds should be avoided because their conformations can be changed at high temperature in hydrothermal synthesis, which can reduce the selectivity of zeolite crystallization.46 The number of rotatable bonds is restricted to less than 3 in accordance with a previous report.46
If the candidate satisfies the above criteria, we apply a newly developed algorithm to estimate locations of OSDAs in a given zeolite. First, we perform Voronoi tessellation of the zeolite to approximate its inner porous structure as a set of spheres with different volumes using Zeo++ software.47 Among the coordinates of these spheres, the location with small steric hindrance for the molecule is identified by counting the number of atoms too close to each other. After finding the best location, the molecule is randomly rotated in 100 different angles to minimize the steric hindrance. This procedure is repeated by adding another molecule in the unit cell until no more molecules can be added without significant steric hindrance. Thus, candidates that are too large to fit in the given zeolite are rejected at this step.
The obtained zeolite–OSDA complex is used as the input of MD simulations. To compare with the previous studies,16,33 we use the same setting for MD simulations; see Computational methods for details. Most of the computational time is consumed in the MD runs. Since independent processes run each ant, distributed processing will significantly increase the performance, although multi-core desktop machines are enough for this purpose.
The efficiency of the ACO algorithm was tested with the design of OSDAs for several industrially important zeolites. Small-pore zeolites in which the porous cavities are limited by the apertures composed of eight oxygens and eight tetrahedral atoms are suitable for chemical processes related to relatively small species, including methanol-to-olefin catalytic conversion48 and selective catalytic reduction of NOx.7 Among numerous small-pore zeolites, the CHA zeolite is at a high technology readiness level by virtue of its superior hydrothermal stability and preferable cage size.49 One of the major hurdles to deployment is the cost of OSDAs.50–52 To quantitatively confirm this, we calculated the cost parameter η that correlates with the US dollar per mole for chemicals, with consideration of scale merit.34 As summarized in Table 1, the cost parameter of typical reagents used for OSDA-free synthesis of zeolites ranges from 0.0087–5.5, which is far smaller than the value of 190 for N,N,N-trimethyl-1-adamantammonium (1), the typical OSDA for the synthesis of the high-silica aluminosilicate CHA.53 Even though the amount of OSDAs required for the crystallization of CHA can be about one order of magnitude smaller than the amount of Si,14,54 it inevitably increases the overall cost of production. Table S1† presents the experimentally proven OSDAs and the corresponding stabilization energies that range from −9.4 to −16.8 kJ molSi−1. Among them, 1 is the best, confirming the strong experimentally observed structure-directing ability to crystallize CHA.55,56 Note that the stabilization energy of 1 for CHA (−16.8 kJ molSi−1) calculated here is very close to the reported value in a previous study (−16.7 kJ molSi−1).16
| Source | Reagent | η |
|---|---|---|
| a Calculated from the cost of amines and halides. b Calculated from tetramethylammonium hydroxide pentahydrate. c Calculated from tetraethylammonium hydroxide solution (35 wt% in H2O). d Calculated from tetrapropylammonium hydroxide solution (20 wt% in H2O). | ||
| Si | Colloidal silica (LUDOX AS-40) | 0.036 |
| Fumed silica | 0.055 | |
| Tetraethyl orthosilicate | 0.11 | |
| Al | Aluminum foil | 1.6 |
| Aluminum hydroxide | 0.052 | |
| Sodium aluminate | 0.031 | |
| Alkali cation | Sodium hydroxide | 0.0087 |
| Potassium hydroxide | 0.048 | |
| Rubidium hydroxide | 5.5 | |
| OSDA | Tetramethylammonium | 1.3a (2.0b) |
| Tetraethylammonium | 14a (0.50c) | |
| Tetrapropylammonium | 32a (4.8d) | |
| 1 | 190a | |
Considering the high cost parameter η of 1, we explored the chemical network using ACO to find alternative OSDAs that can direct CHA crystallization. While some of the meta-heuristic algorithms are virtually black box, the adaptive process of ACO is easily interpretable by tracking the amount of pheromone deposited on reagents. Fig. 2 shows the trajectory of the normalized pheromone amount in the typical first 100 steps for CHA. As can be seen, all reagents started from an equivalent amount of pheromone, which exponentially decayed as ACO optimization progressed. After 10 steps, one ant agent selected A1 to produce a candidate OSDA that outperformed the others. At this point, the candidate OSDA synthesized by A1 was a global optimum that could receive an extra amount of pheromone, fostering the exploration of the other candidates that use A1 as a building block.
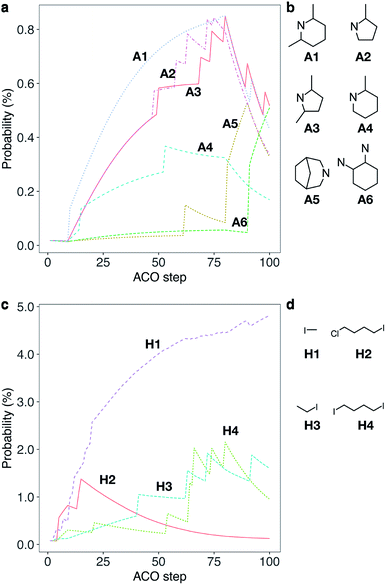 | ||
| Fig. 2 Typical trajectory of a normalized amount of pheromone (i.e., probability) deposited on reagents for a single run for CHA without considering the cost of chemicals (a cost adjustable parameter, β = 0) during the first 100 steps. (a) Trajectory of probability that an amine is selected. Some selected examples of amines, A1–A6, are shown for clarity; see Fig. S1a† for all chemicals. (b) Molecular structures of A1–A6. (c) Trajectory of probability that a halide is selected. Some selected examples of halides, H1–H4, are shown for clarity; see Fig. S1b† for all chemicals. (d) Molecular structures of H1–H4. | ||
One of the common straightforward approaches for molecular design is the use of structurally similar molecules. To mimic this design strategy, we implemented a function to consider molecular similarity.57 Amines that are structurally similar to A1, such as A2, A3 and A4, received different amounts of extra pheromones after A1 became the global best. With the increased probability as the step proceeded, candidate OSDAs derived from A2, A3 and A4 were selected by ant agents and won within colonies as shown in the sharp uptakes of the normalized amounts of pheromones (i.e., probabilities) until step 80. At step 80, A5, the amine that had increased its amount of pheromone at step 58, became the global best by reacting with H1, resulting in the decrease of A1–A4 and the increase of A5 and its structurally related amines until step 90, where the combination of A6 and H1 outperformed the previous global best. In the corresponding trajectory for halides, H1 remained the global best, although other halides (H2, H3, and H4) were frequently selected and won local ant colonies. Due to the max–min functionality, repeated winnings of the global best did not show uptakes, although the additional pheromone derived from molecular similarity increased the probability of being selected. Thus, ACO can sample candidate OSDAs both similar to and different from known ones.43
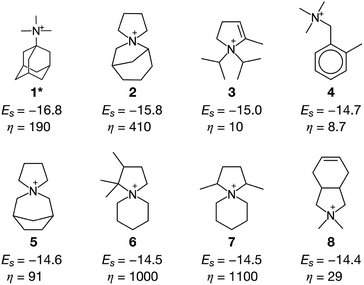
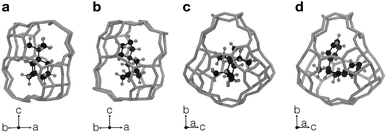
Fig. 3 summarizes some of the computationally predicted OSDAs for CHA. The automated filling algorithm introduced three molecules per unit cell in most cases, which is consistent with experimental observations56 and the number of cages in CHA.3 Obviously, the ACO algorithm can propose candidate OSDAs comparable with the experimentally proven OSDAs, summarized in Table S1†, in terms of stabilization energies. The fact that ACO identified experimentally proven OSDAs for CHA such as 1 suggests the excellent prediction ability of the computational protocol. The most stabilized structure of the zeolite–OSDA complex shown in Fig. 4a corroborates the strong stabilization of the system where symmetric 1 structurally fits with the cylindrical cage of CHA. OSDA 4 is structurally related to benzyltrimethylammonium, which can be used to reduce the amount of 1 required for the synthesis of CHA.9 OSDAs 2 and 5 are slightly smaller than an experimentally proven OSDA, 34 (see Table S1†). The most stabilized complex of CHA and 2 shown in Fig. 4b indicates that the candidate OSDA is tightly confined in the cage of CHA. The only difference between predicted 8 and known 37 (see Table S1†) is the two bridging carbons, which makes 37 slightly larger. As was implemented, all predicted candidates had moderate hydrophobicity and rigid frameworks in terms of C/N+ and the number of rotatable bonds, respectively, which are essential for successful crystallization of zeolites as explained earlier.46 The stabilization energy of 3 was comparable with those of experimentally known OSDAs and its cost parameter was significantly more advantageous than that of 1, the typically used OSDA for CHA, suggesting the possibility of improving economic efficiency.
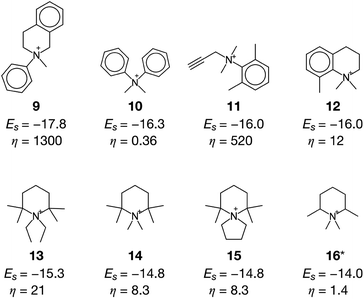
The current methodology is applicable to any zeolites as long as the structure has an inner space to host OSDAs. To demonstrate this, we applied the de novo OSDA design framework to another small-pore zeolite, AEI, which is structurally related to CHA.3 Compared to the cylindrical nature of the cage of CHA, the cage of AEI has an unsymmetrical avocado-like structure as shown in Fig. 4c and d, which is one of the reasons why different OSDAs are required for the crystallization of CHA and AEI. As summarized in Table S2†, several OSDAs have been used to direct the crystallization of AEI by filling the distinct cage shown in Fig. 4c and d. According to a previous study, the stabilization energies of experimentally proven OSDAs for AEI range from −13.2 to −16.9 kJ molSi−1.33 The ACO algorithm found comparable candidate OSDAs as summarized in Fig. 5. Among them, the stabilization energy of 9 was more negative than −16.9 kJ molSi−1.33 The unsymmetrical molecular structure of 9 seems to be appropriate for the avocado-like cage of AEI as shown in Fig. 4d. ACO also found experimentally proven OSDAs for AEI such as 16, supporting the broad applicability of the present computational protocol. An illustrative outcome of the functionality to consider molecular similarity was 13, 14, and 15 in which they are similar to experimentally known OSDAs such as 16, 50, and 51 (see Table S2†). Note that the stabilization energy of 14 for AEI calculated by another group (−15.2 kJ molSi−1)33 was slightly different from the value in Fig. 5, likely because of the different configurations of the zeolite–OSDA complex.
A notable issue of candidate OSDAs predicted in Fig. 3 and 5 is the high cost parameter η, which can be problematic once the zeolites are subjected to large-scale experiments or industrial applications. In the case of CHA, even though some of the candidates including 3 and 4 are economically more efficient than 1, other candidates such as 2, 6, and 7 show prohibitively high cost parameters (see Fig. 3). This can cause convergence to physicochemically appropriate but economically unrealistic candidates. In order to consider the cost of chemicals, we return to the fundamental equation to run ACO. Previous studies employing ACO for adaptive molecular design used an identical “distance” between all reagents.42,43 As depicted in Fig. 1, our current study uses the cost parameter η as the “distance” to increase the probability that an ant agent selects lower cost reagents upon optimizing the stabilization energies. This distance can be adjusted using another parameter, β. When β is set to 0, ACO runs without cost consideration (i.e., uniform distance), as shown above in Fig. 3 and 5. Conversely, the cost parameter fully represents the “distance” when β = 1 (see details in Computational methods).
Fig. 6 shows the mapping of candidate OSDAs predicted by a typical run of ACO for AEI with different β values to control the degree of consideration of the cost parameter. With β = 0, ant agents sampled both economically reasonable and expensive chemicals to find appropriate candidates based solely on the host–guest interactions. As a result, the prediction produced candidates that can be prohibitively too expensive to be alternatives (vide supra). A slight consideration of the cost parameter with larger β values reduced the frequency of expensive reagents, as shown in Fig. 6b. This results in less negative stabilization energies, likely due to fewer chances to sample expensive but physicochemically preferable chemicals. A further increase of β highly limited the chance to sample cost intensive reagents as evident from the scarcity of samplings with η > 500 (Fig. 6c and d).
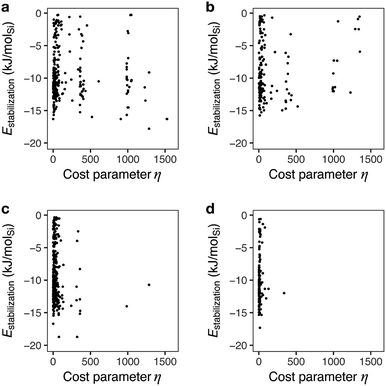 | ||
| Fig. 6 Stabilization energies and cost parameters of predicted candidate OSDAs for AEI at different cost adjustable parameters, β. (a) β = 0, (b) β = 0.1, (c) β = 0.5, and (d) β = 1. | ||
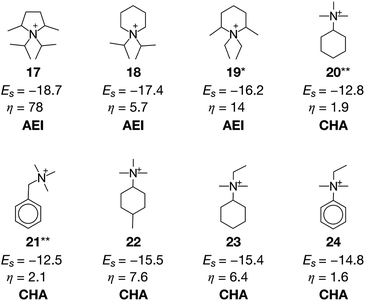
A previous study pointed out that the restriction of applicable reactions sometimes yields superior molecules compared to predictions with more freedom.31 This seemed to hold for the case with β = 0.5, where 17 exhibited a stabilization energy of −18.7 kJ molSi−1 (Fig. 7), outperforming all candidate OSDAs predicted with lower β (Fig. 5) and all experimentally proven OSDAs for AEI (Table S2†). A further increase of β to 1 limited the possibility of selecting cost intensive reagents more tightly, which resulted in less negative stabilization energy, except for 18 shown in Fig. 7 which outperforms all experimentally proven OSDAs for AEI (Table S2†) in terms of the host–guest interactions. The cost parameter η of the predicted OSDAs with β = 1 was notably smaller than the candidates identified without considering the economic efficiency, while the stabilization energies were comparable to experimentally proven OSDAs and predicted OSDAs without cost consideration. Notably, 19 predicted with β = 1 is one of the experimentally proven OSDAs for AEI that is physicochemically and economically preferable (Fig. 7). Accordingly, our proposed algorithm traced experimental efforts to explore physicochemically and economically reasonable OSDAs for the synthesis of zeolites by tuning the cost parameter β.
At cost parameter β = 0.5, ACO generated some experimentally proven OSDAs for CHA, including 20 (ref. 14) and 21 (ref. 9) (Fig. 7). However, 20 and 21 require another OSDA such as 1 for successful crystallization of CHA, presumably owing to their weaker structure-directing abilities9,14 as indicated by their less negative stabilization energies. Despite this, 20 and 21 are significantly more advantageous than 1 in terms of economic efficiency as is evident from their lower η values. The function to consider molecular similarity was effective again for the current case, where the algorithm predicted structurally similar but more physicochemically preferable candidate OSDAs including 22, 23, and 24 in the same run.
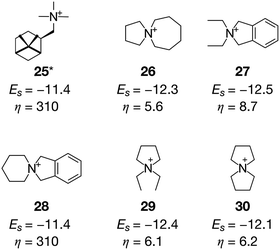
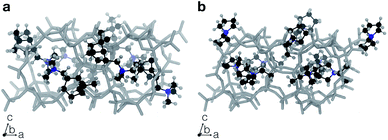
Another zeolite that suffers from the high cost of OSDAs is CON,17 which is a three-dimensional medium- and large-pore zeolite with excellent catalytic performance in methanol-to-olefin reactions.8 The OSDA that can crystallize pure CON zeolite, 25 (ref. 58), has a cost parameter of 310 (Fig. 8), which is extremely expensive. Unlike the systems where isolated OSDAs are geometrically fitted within the cages as shown in Fig. 4, more than one OSDA seems to fill the intersection of the multidimensional channels in CON.17,59 We ran systematic MD simulations for 25, finding that four molecules can be accommodated in the unit cell of CON (see Table S3†), which is consistent with a previous study.59Fig. 9a shows that a pair of 25 interacted with each other through van der Waals interactions. The ACO run for CON with β = 0 successfully predicted 25 (Fig. 8).
With a larger β of 0.5, more reasonable candidates were sampled. In the cases of 26, 27, and 28, four molecules were filled in the unit cell of CON to stabilize the zeolite–OSDA complexes. It is known that π–π interactions between OSDAs can create supramolecular self-assemblies to fill large cavities in porous materials.60 The π systems in 27 and 28 have a potentially positive impact on creating molecular aggregates in inorganic cavities to direct the crystallization of CON. Smaller molecules such as 29 and 30 also showed superior stabilization energies compared to the experimentally proven 25. Six molecules filled the unit cell of CON in the cases of 29 and 30 (Fig. 9b). Very recently, our group reported the successful crystallization of CON in the presence of tetraethylammonium and seed crystals.17 The only difference between the predicted OSDAs (29 and 30) and tetraethylammonium is the C–C bonds that connect ethyl groups at the terminals. Since the current methodology rejects molecules like tetraethylammonium owing to the high rotational freedom, very similar but more rigid molecules such as 29 and 30 were predicted as the alternative candidate OSDAs for CON, which are promising from both physicochemical and economic viewpoints.
Although the current study assumed that sufficiently negative stabilization energy in MD simulations is the indicator of promising structure directing properties, competition with other zeolite phases can be remarkably critical.16,25,26,31 In such situations, the mixing of different OSDAs (i.e., the use of more than one OSDA)9 and the use of seed crystals17 can lead to successful crystallization, which may economically outperform the existing preparation protocols. Further, the MD simulation, the most computationally expensive step in our ACO, can be replaced or performed together with simplified geometry optimization,61 topological analysis of OSDAs,62 and recently developed machine-learning models,63 which is promising to accelerate OSDA design.
An alternative metric to evaluate the cost of organic synthesis is the number of steps to achieve the desired molecule.16 Although the current methodology focused only on the alkylation reaction, other reactions with multiple steps can feasibly be considered by using a larger network of organic chemistry and potential “distance” information stored on each node (chemical) and each edge (reaction), including cost, safety and yield,35 which offers the chance to optimize the production of zeolites from multiple aspects.
It is of note that the applicability of this methodology is not limited to existing zeolites but covers computationally generated, so-called hypothetical, zeolites.64,65 Application of our OSDA design methodology to theoretically feasible hypothetical zeolites would predict candidate OSDAs that can direct the crystallization of new zeolites, although this is beyond the scope of the current study.
Conclusions
Organic structure-directing agents (OSDAs) have massively contributed to the development of zeolite science as they seem to accelerate the discovery of new zeolite materials and to optimize existing zeolites for certain applications. However, these organic molecules can become an economic burden once zeolites are subjected to large-scale experiments and/or industrial applications as quantified by the cost parameters. Although computational methods can relieve the cost of screening a large number of possible molecules, it can suggest unfeasible, prohibitively expensive, unrealistic, and/or trivial candidates. To design OSDAs, this study employed a nature-inspired ant colony optimization (ACO) de novo design algorithm with implementation of chemical heuristics and molecular similarity to construct the design framework for optimization of physicochemical objective functions with consideration of economic efficiency. The predicted candidates contain experimentally proven OSDAs, molecules similar to experimentally proven ones, and novel molecules owing to the unique advantage of ACO molecular design of simultaneously sampling structural analogues of known molecules and completely new ones.43 Several recent studies have revealed that OSDAs can control morphology,27 chirality,26 and atomic configurations30,66 of zeolites, which can be evaluated by computational methodologies. It is therefore anticipated that multi-objective design of OSDAs to simultaneously optimize these zeolite properties can be achieved by ACO in the near future.Computational methods
The prices and the purity of chemical compounds were retrieved from Aldrich Market Select and websites accessed from Japan.37–40 The cost parameter, η, was estimated from an empirical model described in a previous study34 and multiplied by the purity and molar weight of the corresponding chemicals. Virtual reactions were encoded using MarvinSketch67 and conducted until saturation. The resulting molecule was structurally optimized using a universal force field.68 The volume,69 the number of orbitals, and the number of rotatable bonds of a molecule were calculated using RDKit software.70To avoid MD for unrealistically distorted candidates, molecules were rejected if one of the constituting rings having N+ (hereafter, the N-ring) was too small (three-membered ring or four-membered ring). If a candidate molecule contained an N-ring with triple bonds, it was also rejected because such molecules may be difficult to form in organic synthesis or not suitable as OSDAs for hydrothermal synthesis of zeolites. In addition, if the N-ring contained one-and-a-half bonds (i.e., bonds in conjugated systems) and/or double bonds, it was rejected if it satisfied the empirically derived equation:
| 3n2 + 4.5n3 ≥ n1 |
Crystallographic information of idealized zeolites was retrieved from a database provided by the International Zeolite Association.3 Following a previous study,31 structural optimization and multi-step MD simulation were performed on GULP71 under periodic boundary conditions. A charge-less dreiding force field72 was applied to consider the rapid motion of organic molecules2 and vibration of zeolite frameworks at 343 K on an NVT ensemble. If the connectivity of the model was changed during the MD run, the candidate OSDA was rejected. An empty zeolite and a free molecule were also subjected to the MD run with the same settings except that the molecule was simulated as a discrete model. The values of the last 5 ps of the final MD run with a production time of 30 ps were averaged to calculate representative energies.31 Stabilization energy Es was computed from the following equation:
| Es = Ecomplex − nEOSDA − Ezeolite |
In ACO, an ant agent at node i selects the next node j with the following probability:
Reagents that participate in the locally best path receive additional pheromone according to the following equation:
| τij(t + 1) = ρτij(t) + Δτbestij |
| Δτ = exp(−0.3s) |
A max–min filter74 was applied for all pheromones. The maximum amount of pheromone τmax and the minimum amount of pheromone τmin were calculated according to the following equations:
where τglobal best is the amount of pheromone of the global best and n is the number of amines or the number of halides. The amount of pheromone was updated when at least one ant agent among a colony could calculate the stabilization energy from MD.
Conflicts of interest
There are no conflicts to declare.Acknowledgements
This work was supported in part by the JSPS through a Grant-in-Aid for Young Scientists (B) (KAKENHI: 16K18284). K. M. received financial support from the JSPS (DC1) and the Program for Leading Graduate Schools, “Global Leader Program for Social Design and Management (GSDM)”, by the MEXT. Some of the calculations were conducted with the computational resources provided by the Supercomputer Center at the Institute for Solid State Physics (ISSP) of The University of Tokyo.References
- M. E. Davis, Nature, 2002, 417, 813–821 CrossRef CAS PubMed.
- R. F. Lobo, S. I. Zones and M. E. Davis, J. Inclusion Phenom. Mol. Recognit. Chem., 1995, 21, 47–78 CAS.
- C. Baerlocher and L. B. McCusker, Database of Zeolite Structures, http://www.iza-structure.org/databases/, last accessed March 2020 Search PubMed.
- M. Moliner, F. Rey and A. Corma, Angew. Chem., Int. Ed., 2013, 52, 13880–13889 CrossRef CAS PubMed.
- M. D. Oleksiak and J. D. Rimer, Rev. Chem. Eng., 2014, 30, 1–49 CAS.
- M. Moliner, C. Franch, E. Palomares, M. Grill and A. Corma, Chem. Commun., 2012, 48, 8264–8266 RSC.
- A. M. Beale, F. Gao, I. Lezcano-Gonzalez, C. H. F. Peden and J. Szanyi, Chem. Soc. Rev., 2015, 44, 7371–7405 RSC.
- M. Yoshioka, T. Yokoi and T. Tatsumi, ACS Catal., 2015, 5, 4268–4275 CrossRef CAS.
- S. I. Zones, Microporous Mesoporous Mater., 2011, 144, 1–8 CrossRef CAS.
- K. Iyoki, K. Itabashi and T. Okubo, Microporous Mesoporous Mater., 2014, 189, 22–30 CrossRef CAS.
- Y. Kamimura, W. Chaikittisilp, K. Itabashi, A. Shimojima and T. Okubo, Chem.–Asian J., 2010, 5, 2182–2191 CrossRef CAS PubMed.
- H. Lee, S. I. Zones and M. E. Davis, Nature, 2003, 425, 385–388 CrossRef CAS PubMed.
- J. G. Moscoso and D.-Y. Jan, US Pat., 7922997, 2011.
- T. M. Davis, S. A. Elomari and S. I. Zones, US Pat., 20140147378, 2014.
- N. Martín, M. Moliner and A. Corma, Chem. Commun., 2015, 51, 9965–9968 RSC.
- T. M. Davis, A. T. Liu, C. M. Lew, D. Xie, A. I. Benin, S. Elomari, S. I. Zones and M. W. Deem, Chem. Mater., 2016, 28, 708–711 CrossRef CAS.
- S. Sogukkanli, K. Muraoka, K. Iyoki, S. P. Elangovan, Y. Yanaba, W. Chaikittisilp, T. Wakihara and T. Okubo, Cryst. Growth Des., 2019, 19, 5283–5291 CrossRef CAS.
- P. Wagner, Y. Nakagawa, G. S. Lee, M. E. Davis, S. Elomari, R. C. Medrud and S. I. Zones, J. Am. Chem. Soc., 2000, 122, 263–273 CrossRef CAS.
- D. W. Lewis, D. J. Willock, C. R. A. Catlow, J. M. Thomas and G. J. Hutchings, Nature, 1996, 382, 604–606 CrossRef CAS.
- G. Sastre, A. Cantin, M. J. Diaz-Cabañas and A. Corma, Chem. Mater., 2005, 17, 545–552 CrossRef CAS.
- R. Simancas, D. Dari, N. Velamazan, M. T. Navarro, A. Cantin, J. L. Jorda, G. Sastre, A. Corma and F. Rey, Science, 2010, 330, 1219–1222 CrossRef CAS PubMed.
- J. E. Schmidt, M. W. Deem and M. E. Davis, Angew. Chem., Int. Ed., 2014, 53, 8372–8374 CrossRef CAS PubMed.
- D. Jo and S. B. Hong, Angew. Chem., Int. Ed., 2019, 58, 13845–13848 CrossRef CAS PubMed.
- X. Hong, W. Chen, G. Zhang, Q. Wu, C. Lei, Q. Zhu, X. Meng, S. Han, A. Zheng, Y. Ma, A. N. Parvulescu, U. Müller, W. Zhang, T. Yokoi, X. Bao, B. Marler, D. E. De Vos, U. Kolb and F. S. Xiao, J. Am. Chem. Soc., 2019, 141, 18318–18324 CrossRef CAS PubMed.
- A. W. Burton, G. S. Lee and S. I. Zones, Microporous Mesoporous Mater., 2006, 90, 129–144 CrossRef CAS.
- S. K. Brand, J. E. Schmidt, M. W. Deem, F. Daeyaert, Y. Ma, O. Terasaki, M. Orazov and M. E. Davis, Proc. Natl. Acad. Sci. U.S.A., 2017, 114, 5101–5106 CrossRef CAS PubMed.
- S. H. Keoh, W. Chaikittisilp, K. Muraoka, R. R. Mukti, A. Shimojima, P. Kumar, M. Tsapatsis and T. Okubo, Chem. Mater., 2016, 28, 8997–9007 CrossRef CAS.
- J. E. Schmidt, D. Fu, M. W. Deem and B. M. Weckhuysen, Angew. Chem., Int. Ed., 2016, 55, 16044–16048 CrossRef CAS PubMed.
- S. Smeets, L. B. McCusker, C. Baerlocher, S. Elomari, D. Xie and S. I. Zones, J. Am. Chem. Soc., 2016, 138, 7099–7106 CrossRef CAS PubMed.
- K. Muraoka, W. Chaikittisilp, Y. Yanaba, T. Yoshikawa and T. Okubo, Angew. Chem., Int. Ed., 2018, 57, 3742–3746 CrossRef CAS PubMed.
- R. Pophale, F. Daeyaert and M. W. Deem, J. Mater. Chem. A, 2013, 1, 6750–6760 RSC.
- B. W. Boal, J. E. Schmidt, M. A. Deimund, M. W. Deem, L. M. Henling, S. K. Brand, S. I. Zones and M. E. Davis, Chem. Mater., 2015, 27, 7774–7779 CrossRef CAS.
- J. E. Schmidt, M. W. Deem, C. Lew and T. M. Davis, Top. Catal., 2015, 58, 410–415 CrossRef CAS.
- M. Kowalik, C. M. Gothard, A. M. Drews, N. A. Gothard, A. Weckiewicz, P. E. Fuller, B. A. Grzybowski and K. J. M. Bishop, Angew. Chem., Int. Ed., 2012, 51, 7928–7932 CrossRef CAS PubMed.
- S. Szymkuć, E. P. Gajewska, T. Klucznik, K. Molga, P. Dittwald, M. Startek, M. Bajczyk and B. A. Grzybowski, Angew. Chem., Int. Ed., 2016, 55, 5904–5937 CrossRef PubMed.
- M. Dorigo, V. Maniezzo and A. Colorni, IEEE Trans. Syst. Man Cybern. B Cybern., 1996, 26, 29–41 CrossRef CAS PubMed.
- Sigma-Aldrich, https://www.sigmaaldrich.com, last accessed November 2017.
- The Specs.net chemistry database, http://www.specs.net, last accessed November 2017 Search PubMed.
- ChemBridge, http://www.chembridge.com, last accessed November 2017.
- Maybridge, http://www.maybridge.com, last accessed November 2017.
- J. Yang, X. Shi, M. Marchese and Y. Liang, Prog. Nat. Sci., 2008, 18, 1417–1422 CrossRef.
- M. Reutlinger, T. Rodrigues, P. Schneider and G. Schneider, Angew. Chem., Int. Ed., 2014, 53, 4244–4248 CrossRef CAS PubMed.
- T. Rodrigues, N. Hauser, D. Reker, M. Reutlinger, T. Wunderlin, J. Hamon, G. Koch and G. Schneider, Angew. Chem., Int. Ed., 2015, 54, 1551–1555 CrossRef CAS PubMed.
- S. I. Zones, A. W. Burton, G. S. Lee and M. M. Olmstead, J. Am. Chem. Soc., 2007, 129, 9066–9079 CrossRef CAS PubMed.
- S. L. Burkett and M. E. Davis, Chem. Mater., 1995, 7, 1453–1463 CrossRef CAS.
- Y. Kubota, M. M. Helmkamp, S. I. Zones and M. E. Davis, Microporous Mater., 1996, 6, 213–229 CrossRef CAS.
- T. F. Willems, C. H. Rycroft, M. Kazi, J. C. Meza and M. Haranczyk, Microporous Mesoporous Mater., 2012, 149, 134–141 CrossRef CAS.
- P. Tian, Y. Wei, M. Ye and Z. Liu, ACS Catal., 2015, 5, 1922–1938 CrossRef CAS.
- M. Dusselier and M. E. Davis, Chem. Rev., 2018, 118, 5265–5329 CrossRef CAS PubMed.
- L. Ren, Y. Zhang, S. Zeng, L. Zhu, Q. Sun, H. Zhang, C. Yang, X. Meng, X. Yang and F.-S. Xiao, Chin. J. Catal., 2012, 33, 92–105 CrossRef CAS.
- H. Imai, N. Hayashida, T. Yokoi and T. Tatsumi, Microporous Mesoporous Mater., 2014, 196, 341–348 CrossRef CAS.
- Y. Ji, M. A. Deimund, Y. Bhawe and M. E. Davis, ACS Catal., 2015, 5, 4456–4465 CrossRef CAS.
- S. I. Zones, US Pat., 4544538, 1985.
- M. Kumar, H. Luo, Y. Román-Leshkov and J. D. Rimer, J. Am. Chem. Soc., 2015, 137, 13007–13017 CrossRef CAS PubMed.
- R. Martínez-Franco, M. Moliner, J. R. Thogersen and A. Corma, ChemCatChem, 2013, 5, 3316–3323 CrossRef.
- T. Umeda, H. Yamada, K. Ohara, K. Yoshida, Y. Sasaki, M. Takano, S. Inagaki, Y. Kubota, T. Takewaki, T. Okubo and T. Wakihara, J. Phys. Chem. C, 2017, 121, 24324–24334 CrossRef CAS.
- P. Willett, J. M. Barnard and G. M. Downs, J. Chem. Inf. Comput. Sci., 1998, 38, 983–996 CrossRef CAS.
- R. F. Lobo and M. E. Davis, J. Am. Chem. Soc., 1995, 117, 3766–3779 CrossRef CAS.
- B. H. Toby, N. Khosrovani, C. B. Dartt, M. E. Davis and J. B. Parise, Microporous Mesoporous Mater., 2000, 39, 77–89 CrossRef CAS.
- A. Corma, F. Rey, J. Rius, M. J. Sabater and S. Valencia, Nature, 2004, 431, 287–290 CrossRef CAS PubMed.
- M. Gálvez-Llompart, A. Cantín, F. Rey and G. Sastre, Z. Kristallogr. Cryst. Mater., 2019, 234, 451–460 Search PubMed.
- M. Gálvez-Llompart, J. Gálvez, F. Rey and G. Sastre, J. Chem. Inf. Model., 2020, 60, 2819–2829 CrossRef PubMed.
- F. Daeyaert, F. Ye and M. W. Deem, Proc. Natl. Acad. Sci. U. S. A., 2019, 116, 3413–3418 CrossRef CAS PubMed.
- R. Pophale, P. A. Cheeseman and M. W. Deem, Phys. Chem. Chem. Phys., 2011, 13, 12407 RSC.
- Y. Li, X. Li, J. Liu, F. Duan and J. Yu, Nat. Commun., 2015, 6, 8328 CrossRef CAS PubMed.
- J. R. Di Iorio, S. Li, C. B. Jones, C. T. Nimlos, Y. Wang, E. Kunkes, V. Vattipalli, S. Prasad, A. Moini, W. F. Schneider and R. Gounder, J. Am. Chem. Soc., 2020, 142, 4807–4819 CrossRef CAS PubMed.
- MarvinSketch, Calculation module developed by ChemAxon, http://www.chemaxon.com/products/marvin/marvinsketch/, 2017 Search PubMed.
- A. K. Rappe, C. J. Casewit, K. S. Colwell, W. A. Goddard and W. M. Skiff, J. Am. Chem. Soc., 1992, 114, 10024–10035 CrossRef CAS.
- J. A. Grant and B. T. Pickup, J. Phys. Chem., 1995, 99, 3503–3510 CrossRef CAS.
- RDKit, Open-Source Cheminformatics Software, http://www.rdkit.org, 2017 Search PubMed.
- J. D. Gale, J. Chem. Soc., Faraday Trans., 1997, 93, 629–637 RSC.
- S. L. Mayo, B. D. Olafson and W. A. Goddard, J. Phys. Chem., 1990, 94, 8897–8909 CrossRef CAS.
- D. Rogers and M. Hahn, J. Chem. Inf. Model., 2010, 50, 742–754 CrossRef CAS PubMed.
- T. Stützle and H. H. Hoos, Futur. Gener. Comput. Syst., 2000, 16, 889–914 CrossRef.
Footnotes |
| † Electronic supplementary information (ESI) available: Typical trajectory of a normalized amount of pheromone, molecular structures and stabilization energies of experimentally proven OSDAs for three zeolites, and structures of zeolites after molecular dynamics simulation. See DOI: 10.1039/d0sc03075a |
| ‡ Present address: Energy Technologies Area, Lawrence Berkeley National Laboratory, 1 Cyclotron Road, Berkeley, CA 94720, USA. |
| § Present address: Research and Services Division of Materials Data and Integrated System (MaDIS), National Institute for Materials Science (NIMS), 1-1 Namiki, Tsukuba, Ibaraki 305-0044, Japan. E-mail: E-mail: CHAIKITTISILP.Watcharop@nims.go.jp |
| This journal is © The Royal Society of Chemistry 2020 |


