 Open Access Article
Diagnosing surface versus bulk reactivity for molecular catalysis within metal–organic frameworks using a quantitative kinetic model†
Ben A.
Johnson
 * and
Sascha
Ott
 *
*
Department of Chemistry, Ångström Laboratory, Uppsala University, Box 523, 751 20 Uppsala, Sweden. E-mail: ben.johnson@kemi.uu.se; sascha.ott@kemi.uu.se
First published on 26th June 2020
Abstract
Metal–organic frameworks (MOFs) are becoming increasingly popular as heterogenous support matrices for molecular catalysts. Given that reactants, or potentially holes/electrons, need to diffuse into the porous framework as the reaction proceeds, the reaction can possibly take place within the bulk of the particle or be confined to a thin layer at the surface due to transport limitations. Herein, a simple steady-state reaction-diffusion kinetic model is developed to diagnose these two mutually exclusive behaviors in MOF-based systems. The oxygen evolution reaction (OER) driven by a chemical oxidant is presented as an example mechanism. Quantitative metrics for assigning either bulk or surface reactivity are delineated over a wide variety of conditions, and numerical simulations are employed to verify these results. For each case, expressions for the turnover frequency (TOF) are outlined, and it is shown that surface reactivity can influence measured TOFs. Importantly, this report shows how to transition from surface to bulk reactivity and thus identifies which experimental parameters to target for optimizing the efficiency of MOF-based molecular catalyst systems.
Introduction
Metal–organic frameworks (MOFs) are rapidly being explored as potential catalysts for a variety of important chemical transformations. Their high internal surface area could indeed result in extraordinarily high concentration of active sites. Furthermore, incorporation of highly active and selective molecular catalysts into MOF structures, via a variety of post-synthetic methods,1,2 is possible due to the modularity of the organic linkers. This is advantageous as it can stabilize the molecular catalyst and avoid undesired bimolecular decomposition reactions, while providing a heterogeneous support matrix with a high density of anchoring sites. MOF-supported molecular catalysis has been previously demonstrated for energy related processes3–6 including proton reduction,7–9 CO2 reduction,10–14 and water oxidation,15–20 as well as a variety of organic transformations with high-value products.21–25However, given the interfacial nature of the reactions occurring in MOFs, mass and charge transport by a diffusional process are required to shuttle reactants, substrates, as well as electrons or holes to the molecular active sites in the MOF interior. As a result, situations arise where the catalytic reaction may be confined to the first few molecular layers or possibly even the surface of the particle. Determining where the reaction is occurring and what fraction of the imbedded molecular catalysts are active during the reaction is a prerequisite in order to take advantage of the high internal surface area displayed by MOF materials. Clearly, transport-limited or surface confined reactions would severely underutilize the large number of active sites within the MOF interior. Overcoming these limitations is of utmost importance not only to the efficiency but also to the performance (observed rate) and applicability of these materials to large-scale catalytic processes.26 Transport phenomena are often overlooked in kinetic studies of MOF-based catalysis. Indeed, only a handful of remarkable reports16,27–29 have accounted for these effects.30 Moreover, kinetic models integrating diffusional processes along with mechanistic details for the immobilized molecular catalysts are lacking. As a result, whether the reaction occurs exclusively near the surface of the particle due to transport limitations or throughout the bulk of the particle remains an open question for many MOF-catalysed reactions.
Choosing the oxygen evolution reaction (OER) driven by a (photo)chemical oxidant as an example, herein we develop a quantitative reaction-diffusion kinetic model to diagnose either surface or bulk reactivity occurring with a molecular catalyst homogenously dispersed inside MOF particles. To the best of our knowledge, the present study is the first of its kind that summarizes the vast array of possible kinetic behaviours, and discusses means to distinguish between these different scenarios.
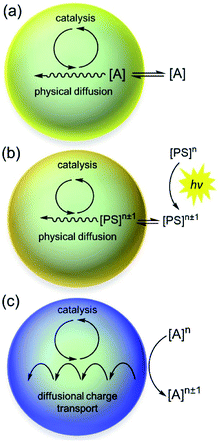
MOF-catalyst materials have been utilized extensively as micro-crystalline powders (particle sizes ranging from approximately 0.1 to 2 μm) suspended in solution. For energy related applications, a sacrificial chemical reagent (usually a strong oxidant or reductant) drives the reaction,16,18,19 or in a photochemical assay,9–11,14 a reducing or oxidizing photosensitizer is generated by quenching from a sacrificial donor or acceptor, respectively. In either case the oxidant or reductant must either physically diffuse through the pores or initiate a charge hopping process31,32 that delivers electrons or holes to the catalytic sites in the interior of the particles to generate the active form of the catalyst. It is well-known that such a charge hopping process is formally diffusional, obeying Fick's laws.33,34 Therefore, regardless of the pore structure of the MOF, substrates, chemical reagents, and/or electrons or holes will need to diffuse through the particles as the catalytic reaction proceeds (relevant scenarios are shown in Fig. 1). The resulting balance between reaction and diffusion will determine the overall rate and the surface vs. bulk reactivity of the MOF-catalyst construct (i.e., the location and size of the boundary layer in the particle where the reaction occurs). With diffusion present, the interplay of a large number of variables determines the overall kinetic behaviour, often leading to non-intuitive results. Consequently, by qualitative reasoning alone, it may not be apparent how a single variable, such as the concentration of a specific reactant or the size of the particle, affects the observed catalytic activity and efficiency.
In the present example, we define a small number of dimensionless parameters, which make it possible to identify which variables control the balance between chemical reactions and diffusion in each case and thus control the overall performance of the catalyst particle. We then elucidate quantitative relationships between the observed catalytic rate and the particle size, catalyst loading, and oxidant concentration. Numerical simulations are employed to confirm these relationships. Furthermore, we use these diagnostic criteria to illustrate how to assign the kinetic regime as: (1) surface reactivity, or (2) bulk reactivity. This allows one not only to extract relevant kinetic data (rate constants and diffusion coefficients) but to also identify which experimental variables to change in order to optimize the system for the highest efficiency and performance. We apply these tools and concepts to the present problem of supported molecular OER catalysis taking place within MOF particles, building on precedent from heterogenous catalysis and chemical reaction engineering. For example, efficiency, commonly quantified by the “effectiveness factor,”35,36 is a measure of catalyst utilization, i.e., what percentage of the immobilized molecular catalysts within the MOF particle participate in the reaction (vide infra). When diffusional transport limitations give rise to surface reactivity, the efficiency of the MOF-catalyst will become less than unity. Particular attention will be paid to the contribution of catalyst oxidation/activation by the external oxidant to the overall rate law. As will be shown, the concentration of oxidant or holes (via charge hopping) may be depleted within the particle significantly, which will decelerate these reactions to the point where they become rate-determining. Furthermore, we demonstrate that different values for the turnover frequency (TOF) can be obtained in the limit of either surface reactivity or bulk reactivity. The scenario where the oxidant can penetrate and diffuse into the MOF pores is examined first, followed by the case where the pore aperture size of the MOF is small and the oxidant is excluded from entering the particle. In case of the latter, a heterogeneous reaction at the particle–solution interface initiates the diffusional charge hopping process that supplies holes to the molecular catalyst.
The oxygen evolution reaction is used as an example; however, the fundamental principles of reaction-diffusion arising in catalytic MOF particles outlined here for diagnosing surface or bulk activity can be easily extended to other mechanisms involving fuel forming reactions (hydrogen evolution, CO2 reduction) or a variety of catalytic organic transformations where there exists a sacrificial or limiting reactant.
Results and discussion
(Photo)chemically driven OER
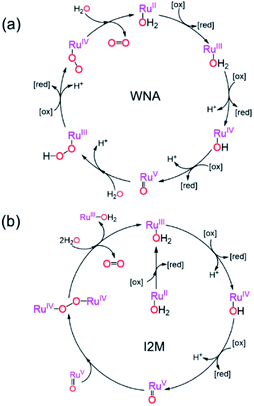
Two mechanistic pathways (Fig. 2) are most often proposed for molecular water oxidation catalysis: water nucleophilic attack (WNA) and radical coupling (I2M). Additionally, the most active molecular catalysts to-date are ruthenium-based transition metal complexes, typically featuring polypyridyl ligands.37–39 Therefore, the two respective mechanisms displayed in Fig. 2, determined previously for homogeneous Ru-based catalysts,38,40,41 will serve as the basis for the analysis to follow considering reaction-diffusion when the molecular Ru-catalyst is incorporated into a MOF particle. These mechanisms are also relevant, since there have been several previous reports of molecular ruthenium catalyst incorporated into, for example, the MIL-101(Cr)19 or UiO-67 frameworks,18 which undergo OER in the presence of a chemical oxidant. There are also several notable examples of Ir-based catalysts in UiO frameworks.15,16 For brevity, only the WNA mechanism is described in detail; although, as shown in the ESI,† the I2M mechanism exhibits the same general reaction-diffusion behaviour. The latter is however less relevant in the context of MOFs where the catalysts are often integral parts of the material and will thus not engage in bimolecular encounters.Oxidant diffusion through the MOF pores
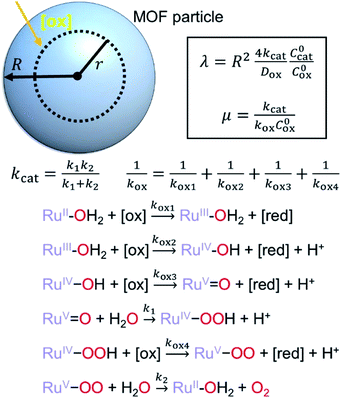
First we consider the situation where the aperture size of the MOF pores is sufficiently large to allow the oxidant (either a chemical oxidant or oxidized photosensitizer) to enter and diffuse through the MOF particles. The generalized reaction scheme for WNA is shown in Fig. 3. The concentration of oxidant in the solution (C0ox) is assumed to be constant over short times, i.e., when measuring initial rates. Wang et al. reported a reaction-diffusion model to account for consumption of the oxidant in the bathing solution over longer timescales (10–60 min.) in an experimental system with first order kinetics with respect to the oxidant.16 For the mechanisms displayed in Fig. 2, we will see in the present treatment how the order of reaction with respect to the oxidant can switch from between first order and zero order depending on both C0ox and the oxidant's concentration gradient within the particle. The total concentration of catalyst in the particle is C0cat (referred to as the “catalyst loading”), Dox is the diffusion coefficient of the oxidant inside the MOF particle, R is the particle radius (approximated as spherical), N is the total number of individual MOF particles (see ESI† for calculation of N), kox is the second order rate constant of the slowest oxidation reaction between the catalyst and oxidant (see ESI† for derivation), k1 is the pseudo-first order rate constant of the water nucleophilic attack step, and k2 is the first order rate constant for the oxygen release step. Fast coordination of a water molecule follows the first order decay of the RuV-OO intermediate, which closes the catalytic cycle (Fig. 3). The observed rate constant for the catalytic reaction steps (excluding the oxidation reactions to form the active catalyst) can be written as kcat = (k1k2)/(k1 + k2) in the case of WNA, where each step is first order with respect to the catalyst. Applying steady-state, as shown in the ESI,† the concentration of oxidant Cox(r) within the particle is a function of the radial distance r (with r = 0 taken as the centre of the particle and r = R defined as the particle surface).Two dimensionless parameters (μ and λ, Fig. 3) control the resulting concentration profile of oxidant inside the particle as well as the observed rate of the reaction, v in mol s−1 (measured as the production of O2). The competition between the rate of the catalytic reaction (kcat) and the rate of oxidation to form the catalytically active species is represented by μ = kcat/(koxC0ox). Importantly, λ = (4R2kcatC0cat)/(DoxC0ox) captures the influence of diffusion on the catalytic reaction and is defined as the ratio of the catalytic reaction rate to the diffusion rate of the oxidant inside the MOF particle.
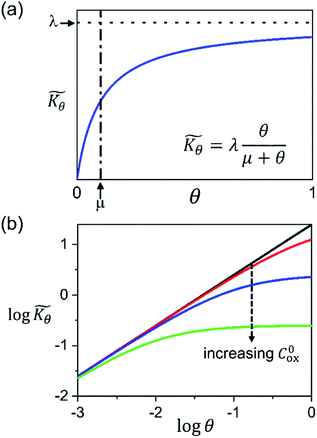
Interestingly, the system of coupled reactions (Fig. 3) results in kinetic behaviour that bears a strong resemblance to Michaelis–Menten kinetics42–44 (as shown in the ESI,† this is also the case for the I2M mechanism under certain conditions). At low concentrations, Cox(r) → 0, the reaction kinetics are first-order in oxidant. This shifts to zero-order with respect to Cox(r) at higher “saturating” concentrations, at which point the reaction rate approaches a maximum value. Analogous to the Michaelis–Menten constant, the magnitude of μ determines at what concentration of oxidant the system is “saturated.” This is shown in Fig. 4a, which plots the dimensionless kinetic rate expression  (see ESI† for derivation) as a function of the dimensionless oxidant concentration θ(r) = Cox(r)/C0ox inside the particle. This is analogous to the traditional solution-phase kinetic rate law for the coupled chemical reaction occurring in parallel with diffusion of the oxidant through the MOF pores. The saturating concentration of oxidant is indicated by the vertical dashed line where μ = θ(r) and the kinetics shift from first to zero-order. As θ(r) → 1, the rate approaches a maximum value (Fig. 4a, horizontal dashed line), which is approximately equal to the magnitude of λ (representing the intrinsic rate of the OER reaction attenuated by any interference from diffusion). If the solution oxidant concentration C0ox is increased significantly, for nearly all values of θ(r) the reaction kinetics become saturated or zero-order in oxidant (Fig. 4b, green line).
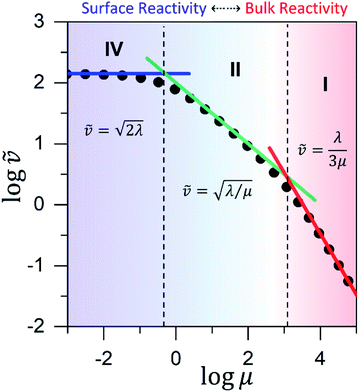
Approximate analytical solutions for the observed reaction rate (v), accounting for mass transport and the intrinsic kinetics of the oxidant/catalyst inside the MOF particle, can be obtained in various limiting situations by taking maximum or minimum values of the two dimensionless control parameters, λ and μ. For reference, each specific behaviour is assigned a zone (I to IV) with a corresponding closed-form expression for the observed rate. Numerical simulations are used to confirm the validity of the rate expressions.
 which takes the form of the classical Thiele modulus45 (eqn (1)).
 | (1) |
Two limits can be found depending on the magnitude of  When the activation of the catalyst by the oxidant, which is now the globally rate-determining chemical step, is slow compared to its diffusion rate through the MOF particle (reaction-controlled:
  ), bulk reactivity is observed, and the oxidant is present at a nearly constant concentration throughout the particle approximately equal to its value in the bathing solution. The observed rate is trivially (zone I)
 | (2) |
 ), the overall rate becomes
 | (3) |
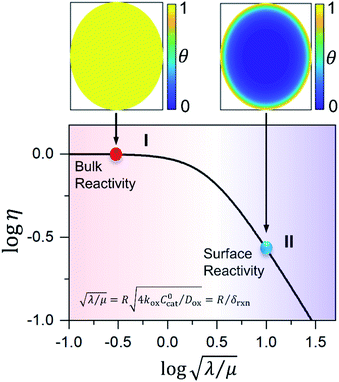
In this regime (zone II), Cox(r) is depleted near the particle surface, due to its fast consumption before the oxidant is able to diffuse into the centre of the particle. A boundary or reaction-diffusion layer is formed near the surface, with a thickness given by  Only catalytic sites contained within this thin layer are active, demonstrating surface reactivity as δrxn approaches the size of a monolayer. Using this definition of the boundary layer thickness, another way to characterize bulk reactivity is when the reaction-diffusion layer is equal to or larger than the particle size
  And in fact,
  is simply the ratio of these two length scales, i.e.,
These two behaviors can be easily differentiated experimentally by plotting the observed reaction rate (v) as a function of the catalyst loading (C0cat) or the particle size (R). For bulk reactivity (zone I), a plot of v vs. C0cat gives a linear relationship and indicates that the reaction is occurring throughout the particle. Whereas v vs. will be linear if the kinetics are controlled by transport and the reaction is contained near the particle surface (zone II).46,47 Similarly as expected, in the bulk reactivity regime the rate is proportional to R3, indicating a dependence on the MOF particle's volume. When transport limitations are present, the observed rate will display proportionality to R2, or the surface area of the particle.
In either case, the rate-determining chemical step is first order in Cox(r) (μ ≫ 1), making v linearly proportional to C0ox under both bulk reactivity (reaction-controlled) and surface reactivity (transport-controlled) conditions. These diagnostic relationships are summarized in Table 1 using the order of the reaction rate with respect to each experimental variable. Transitions between each kinetic regime are summarized in the zone diagram in Fig. 7.
The efficiency η, canonically referred to as the internal effectiveness factor,35,36,48 is defined as the ratio of the observed reaction rate to the maximum reaction rate (eqn (2)) in the absence of any diffusional gradients (see ESI eqn (S15) for further details†). This is a direct metric of how much of the catalyst is utilized or active in the reaction, as transport limitations fundamentally create boundary layers near the particle surface, outside of which the active catalyst concentration is essentially zero. Thus the primary effect of comparatively slow diffusion (when  is large) is that it reduces the total amount of catalyst participating in the reaction at steady-state – i.e., slow diffusion induces surface reactivity (η ≪ 1 for surface reactivity, Fig. 5 zone II; η = 1 for bulk reactivity, Fig. 5 zone I). This is indeed a function of the particle size, since the oxidant will have a longer characteristic diffusion time (tdiff ∼ R2/Dox) in particles with larger radii. The catalytic efficiency (or effectiveness factor) of the MOF particle as it varies with R is shown in Fig. 5.
 | (4) |
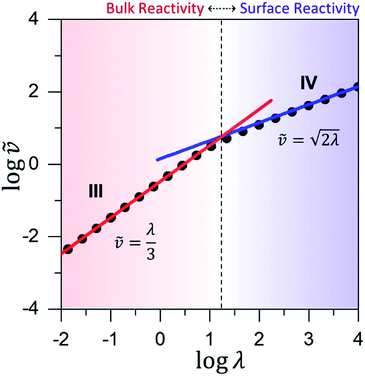 | ||
Fig. 6 Working curve for the observed reaction rate valid for catalyst limited kinetics when μ ≤ 10−2. The vertical axis plots the dimensionless reaction rate ![[small nu, Greek, tilde]](https://www.rsc.org/images/entities/i_char_e0e1.gif) = v/(NπRDoxC0ox), which varies as a function of λ = (4R2kcatC0cat)/(DoxC0ox). The vertical dashed-line shows the transition from surface reactivity (zone IV; shaded blue) to bulk reactivity (zone III; shaded red). The dimensionless rate expression for bulk reactivity with catalyst limited kinetics (solid red line; see eqn (4)) is plotted with the corresponding expression for surface reactivity (solid blue line; see eqn (5)). Results from the numerical simulations (black dots) are shown for comparison. = v/(NπRDoxC0ox), which varies as a function of λ = (4R2kcatC0cat)/(DoxC0ox). The vertical dashed-line shows the transition from surface reactivity (zone IV; shaded blue) to bulk reactivity (zone III; shaded red). The dimensionless rate expression for bulk reactivity with catalyst limited kinetics (solid red line; see eqn (4)) is plotted with the corresponding expression for surface reactivity (solid blue line; see eqn (5)). Results from the numerical simulations (black dots) are shown for comparison. | ||
When diffusion becomes limiting, for large particles or slow diffusion λ ≫ 1, again a boundary layer is present near the particle surface. The observed rate is shown in eqn (5) (zone IV; Fig. 6).
 | (5) |
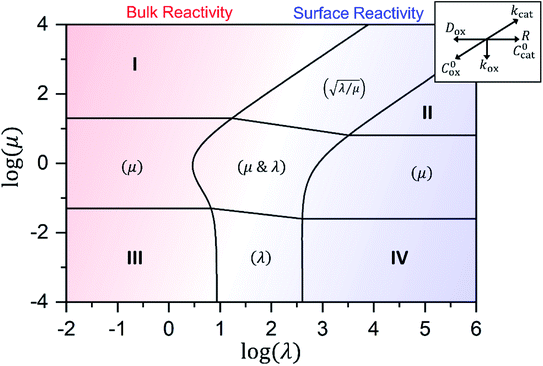 | ||
Fig. 7 Kinetic zone diagram for the case where oxidant is able to freely diffuse through the particle, with μ = kcat/(koxC0ox)and λ = (4R2kcatC0cat)/(DoxC0ox). Zones displaying bulk reactivity where nearly all the catalyst sites are active are shaded in red. Surface reactivity zones where a boundary layer ensues, which reduces the active catalyst, are shaded in blue. Each limiting zone, where the rate expression does not depend on either dimensionless parameter, is labelled with the corresponding numeral (I to IV; see Table 1 for rate equations). For intermediate cases, where the expression for ![[small nu, Greek, tilde]](https://www.rsc.org/images/entities/i_char_e0e1.gif) depends on one or more dimensionless parameters, the controlling parameter(s) are shown in parentheses. Numerical simulations were used to compute the observed rate in zones were no analytical solution exists (central zone). The compass in the upper right displays the direction in which increasing a given experimental variable will translate the system within the zone diagram. The boundaries between zones are based on 5% error in the value of the observed steady-state reaction rate ( depends on one or more dimensionless parameters, the controlling parameter(s) are shown in parentheses. Numerical simulations were used to compute the observed rate in zones were no analytical solution exists (central zone). The compass in the upper right displays the direction in which increasing a given experimental variable will translate the system within the zone diagram. The boundaries between zones are based on 5% error in the value of the observed steady-state reaction rate (![[small nu, Greek, tilde]](https://www.rsc.org/images/entities/i_char_e0e1.gif) ). ). | ||
Similar to above, modifying the particle size (i.e., varying λ) will allow one to transition from surface to bulk reactivity within the approximation of catalyst limited kinetics. This transition occurs around λ ∼ 20 and is shown in Fig. 6 for small values of μ (≤10−2). Surface reactivity (zone IV; Fig. 6) is observed when λ > 20, while for values of λ < 20, bulk reactivity persists (zone III; Fig. 6). Excellent agreement was found between the approximate analytical expressions for the observed rate in eqn (4) (Fig. 6, red line) or eqn (5) (Fig. 6, blue line) and the simulated results (Fig. 6, black dots).
 | (6) |
For large particles, when the reaction is confined at or near the surface of the particle (λ ≫ 1), the dimensionless rate becomes
 | (7) |
 bulk reactivity is recovered (zone I; Fig. 8) and eqn (7) is no longer valid. Again, excellent agreement is found between the approximate analytical rate expressions for each limiting zone (Fig. 8, solid lines) and the numerical simulations (Fig. 8, black dots).
An interesting effect is caused by the depletion of the oxidant over the reaction-diffusion layer when λ > 1 and μ ∼ 1. Nearest to the particle surface the oxidant is present at higher concentrations and the kinetics are saturated θ(r) > μ. Progressing into the particle interior, as the oxidant is depleted over the reaction-diffusion layer, a change to unsaturated kinetics occurs when θ(r) < μ. In effect this means that near the surface, the rate-determining step will reflect the catalytic reaction (kcat).
Conversely, within the interior of the particle the drop in oxidant concentration causes the oxidation of the catalyst to be rate-determining (kox). As a result, the nature of the rate-determining chemical reaction step will have a spatial dependence within the particle, simply because the concentration of one of the reactants changes significantly as a function of the distance from the surface.
Oxidant excluded from the MOF pores
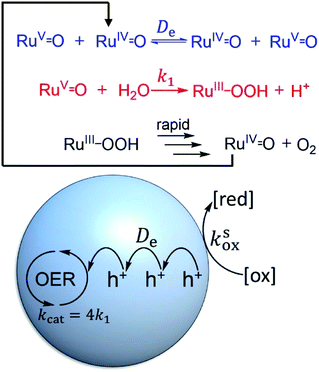
Next, we turn our attention to diagnosing surface or bulk reactivity when the oxidant is size excluded from diffusing into the pores of the MOF. It would seem that this would trivially always result in surface reactivity; however, considering the redox-activity of many molecular catalysts, it is possible that oxidation of the sites at the particle–solution interface can initiate a diffusional charge hopping processes that carries holes into the interior. In this case, the molecular catalysts inside the particle are responsible for carrying out charge propagation in addition to the catalytic reaction.To understand this situation in more detail we adopt a simplified mechanism (for WNA) displayed in Fig. 9. Here, the catalytic resting state, a nominal RuV![[double bond, length as m-dash]](https://www.rsc.org/images/entities/char_e001.gif) O intermediate, is generated by diffusional charge hopping. This intermediate typically reacts with H2O in a turnover limiting O–O bond formation step40,49 (k1 in s−1, Fig. 9). The substrate (H2O), as before, is assumed to maintain a constant concentration. Catalysis proceeds further by a sequence of follow-up reactions (either re-oxidation by charge hopping or purely chemical steps) that are considered to be fast and thus do not appear in the observed rate law. Accounting for the 4e− stoichiometry of the OER, the observed rate constant is kcat = 4k1.
O intermediate, is generated by diffusional charge hopping. This intermediate typically reacts with H2O in a turnover limiting O–O bond formation step40,49 (k1 in s−1, Fig. 9). The substrate (H2O), as before, is assumed to maintain a constant concentration. Catalysis proceeds further by a sequence of follow-up reactions (either re-oxidation by charge hopping or purely chemical steps) that are considered to be fast and thus do not appear in the observed rate law. Accounting for the 4e− stoichiometry of the OER, the observed rate constant is kcat = 4k1.
Taking into consideration the heterogeneous interfacial oxidation reaction and diffusional hole hopping inside the MOF particle requires defining two new dimensionless parameters. The first parameter reflects the classical Thiele modulus,
 | (8) |
 | (9) |
As shown in the ESI,† by taking into account the appropriate boundary conditions, limiting behaviours can be found for large or small values of λe and γ. The transition between these reciprocal kinetic regimes (labelled V through VII) is represented in the zone diagram in Fig. 10. Rate expressions and diagnostic criteria are summarized in Table 2.
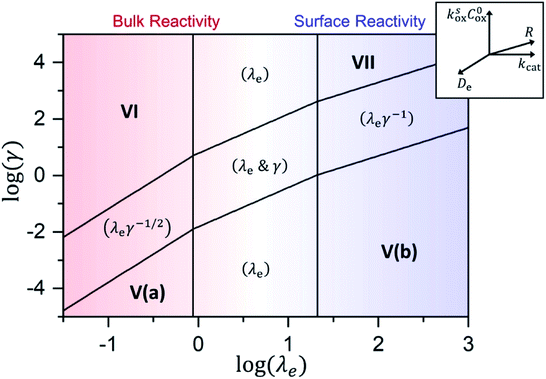 | ||
Fig. 10 Kinetic zone diagram for the case where oxidant is unable to enter particle due to size restrictions. The influence of the heterogeneous oxidation reaction by [ox] at the particle–solution interface is controlled by the dimensionless parameter γ = R(ksoxC0ox/De) on the vertical axis. The horizontal axis plots the classical Thiele modulus for the competition between the catalytic reaction and diffusional charge transport  Zones displaying bulk reactivity where nearly all the catalyst sites are active are shaded in red. Surface reactivity zones where a boundary layer ensues, which reduces the active catalyst, are shaded in blue. Each limiting zone, where the rate expression does not depend on either dimensionless parameter, is labelled with the corresponding numeral (V to VII; see Table 2 for rate equations). For intermediate cases, where the expression for Zones displaying bulk reactivity where nearly all the catalyst sites are active are shaded in red. Surface reactivity zones where a boundary layer ensues, which reduces the active catalyst, are shaded in blue. Each limiting zone, where the rate expression does not depend on either dimensionless parameter, is labelled with the corresponding numeral (V to VII; see Table 2 for rate equations). For intermediate cases, where the expression for ![[small nu, Greek, tilde]](https://www.rsc.org/images/entities/i_char_e0e1.gif) depends on one or more dimensionless parameters, the controlling parameter(s) are shown in parentheses. The compass in the upper right displays the direction in which increasing a given experimental variable will translate the system within the zone diagram. The boundaries between zones are based on 5% error in the value of the observed steady-state reaction rate ( depends on one or more dimensionless parameters, the controlling parameter(s) are shown in parentheses. The compass in the upper right displays the direction in which increasing a given experimental variable will translate the system within the zone diagram. The boundaries between zones are based on 5% error in the value of the observed steady-state reaction rate (![[small nu, Greek, tilde]](https://www.rsc.org/images/entities/i_char_e0e1.gif) ). ). | ||
A new case is established when the heterogeneous reaction rate to activate the catalyst, i.e. the hole injection into the particle, is slow compared to the rate of diffusional charge transport (zone V). It follows that γ → 0, and the observed rate is found to only depend on the interfacial reaction:
| v = 4NπR2ksoxC0oxC0cat | (10) |
As mentioned above, λe controls the variation between bulk and surface reactivity as diffusional charge transport becomes slower than the catalytic reaction and causes the oxidized form of the catalyst to be confined to a thin layer near the surface. The expression for the observed rate (as γ → ∞) under bulk reactivity (zone VI), and surface reactivity (zone VII), are displayed in eqn (11) and eqn (12) respectively.
 | (11) |
 | (12) |
When surface reactivity is observed, the reaction-diffusion layer thickness can be defined as  In both these cases, since diffusional charge transport carries holes into the MOF particle, the rate is independent of the solution concentration of the oxidant. Furthermore, as expected for bulk reactivity in the absence of other limiting factors (oxidation kinetics, diffusion), eqn (11) is identical to that for zone III (eqn (4)) when the oxidant can diffuse through the framework. In these limits, the system only depends on the intrinsic catalytic reaction, which is the ideal operating condition for applications and catalyst benchmarking. Nevertheless, one way to confirm if the oxidant is penetrating and diffusing within the particle or if it is excluded and a charge hopping mechanism is present is to systematically increase the particle size and traverse into a regime where diffusion begins to affect the kinetics (entering either zone IV or zone VII).
Surface vs. bulk reactivity and measured TOFs
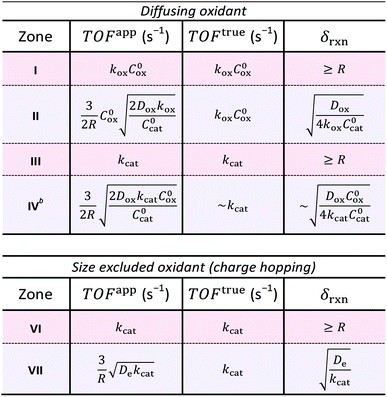
A typical metric used in the kinetic characterization of molecular catalysts incorporated into MOFs is the turnover frequency (TOF). The classical definition of TOF for homogeneous solution phase catalytic reactions is the moles of product generated per unit time divided by the total moles of catalyst present. We have shown here that the possibility of surface reactivity arises due to the coupling of the catalytic reaction to diffusion within the MOF particle, and the active catalytic species are then confined in a reaction layer near the particle surface. Therefore, TOFs obtained taking into account the total amount of catalyst may not reflect the actual activity of the incorporated molecular catalyst. In order to make this distinction more clear, two definitions of TOF need to be adopted,4,19 the apparent turnover frequency (TOFapp) and the true turnover frequency (TOFtrue): | (13) |
 | (14) |
The resulting expressions for TOFapp and TOFtrue are presented in Table 3 for each zone, either bulk or surface reactivity, within the case of a diffusing oxidant as well as that for diffusional charge hopping. Zone V is not displayed because the observed rate is limited by the heterogeneous oxidation reaction at the particle–solution interface rather than the reactions taking place within the interior of the particle. It is readily apparent that when the MOF-catalyst displays surface reactivity due to diffusional limitations on the reaction rate, TOFapp deviates from an intrinsic kinetic value and is a function of both the particle size (R) and a particular diffusivity (Dox or De). For example, it was found in every case of surface reactivity, TOFapp will decrease with increasing particle size (TOFapp ∝ R−1; zones II, IV, and VII), as an increasing proportion the catalysts are outside δrxn. In some situations where the oxidant freely diffuses through the particle, TOFapp may also even depend on the catalyst concentration itself (see zones II and IV). These results show that TOFapp is not ideal for characterizing intrinsic kinetics; however, observing a dependence of TOFapp on the particle size can be used as a diagnostic for surface reactivity. Conversely, by approximating the size of the reaction layer (δrxn), which depends on the reaction-diffusion behavior characteristic of each zone, TOFtrue reflects an intrinsic kinetic parameter even under conditions of surface reactivity. Finally, when the experimental variables are optimized and bulk reactivity is obtained, TOFapp will be independent of the particle size and approximately equal to TOFtrue. Under bulk reactivity, both these metrics reflect the kinetic properties of the molecular catalyst inside the MOF pore structure (Table 3; zones III, and VI).
| a Zones of bulk reactivity are shaded red, while surface reactivity zones are shaded blue. b Calculation of TOFtrue in zone IV is presented as an estimate, since the reaction layer thickness (δrxn) is not well-defined due to the non-linear chemical reaction kinetics. The expressions given here are first order approximations as indicated in the table (see ESI for details). |
|---|
|
These distinctions in TOF values are particularly important for benchmarking the activity of different MOF-based catalysts. The quantitative analysis presented here demonstrates that the most useful information can be obtained by comparing intrinsic kinetic parameters (TOFtrue) in combination with metrics for catalyst efficiency in terms of bulk versus surface reactivity (e.g., the effectiveness factor, η; Fig. 5). Furthermore, the microenvironment inside the MOF pore may have a significant influence on the activity of the incorporated molecular catalyst by augmenting its outer coordination sphere. Characterizing this effect may mean comparing the activity of the MOF-imbedded species to the homogeneous analogue, where the intrinsic rate of the catalyst (TOFtrue) in each environment, decoupled from mass and charge transport, is of the most value.
Conclusions
At present, quantitative kinetic studies of MOF-based catalysis are scarce. The interaction of a number of chemical processes including transport phenomena convolute the analysis, and simple predictions as to how the observed rate will respond to changes in reactant concentration, particle size etc. may become non-intuitive. However, as shown here, kinetic evaluation is a necessary step towards the productive utilization of MOFs as support matrices for molecular catalysts. Despite having the possibility for a high density of active sites in MOFs, this advantage may be underutilized under certain conditions. This is primarily because the reaction-diffusion characteristics of the MOF-catalyst construct determine how many of the imbedded catalysts within the particle participate in the reaction. In this report, taking OER as a target reaction mechanism, we have demonstrated a simple kinetic model to assess and diagnose bulk vs. surface reactivity. It was shown how to transition between these behaviours based on a small number of dimensionless parameters. By modifying certain quantities, for example the particle size,45 this allows one to take full advantage of the unique material and structural properties of MOFs for highly efficient molecular catalysis. Thus, the quantitative analysis presented here serves as an illustrative example for examining the reaction-diffusion challenge at the heart of MOF-based catalysis and opens the doors for future kinetic studies of catalytic MOFs with a fundamental understanding of the transport phenomena and chemical mechanisms at play.Conflicts of interest
There are no conflicts to declare.Acknowledgements
Financial support from the European Research Council via Project ERC-CoG2015-681895_MOFcat is gratefully acknowledged. B.A.J. acknowledges Dr Vincent C.-C. Wang, Mr Robin Tyburski, and Dr Lei Tian for, as always, very stimulating discussions on the matter at hand.Notes and references
- S. M. Cohen, J. Am. Chem. Soc., 2017, 139, 2855–2863 CrossRef CAS PubMed.
- M. Kim, J. F. Cahill, Y. Su, K. A. Prather and S. M. Cohen, Chem. Sci., 2012, 3, 126–130 RSC.
- C. A. Downes and S. C. Marinescu, ChemSusChem, 2017, 10, 4374–4392 CrossRef CAS PubMed.
- B. D. McCarthy, A. M. Beiler, B. A. Johnson, T. Liseev, A. T. Castner and S. Ott, Coord. Chem. Rev., 2020, 406, 213137 CrossRef CAS PubMed.
- M. B. Majewski, A. W. Peters, M. R. Wasielewski, J. T. Hupp and O. K. Farha, ACS Energy Lett., 2018, 3, 598–611 CrossRef CAS.
- T. Zhang and W. Lin, Chem. Soc. Rev., 2014, 43, 5982–5993 RSC.
- S. Roy, Z. Huang, A. Bhunia, A. Castner, A. K. Gupta, X. Zou and S. Ott, J. Am. Chem. Soc., 2019, 141, 15942–15950 CrossRef CAS PubMed.
- D. Micheroni, G. Lan and W. Lin, J. Am. Chem. Soc., 2018, 140, 15591–15595 CrossRef CAS PubMed.
- S. Pullen, H. Fei, A. Orthaber, S. M. Cohen and S. Ott, J. Am. Chem. Soc., 2013, 135, 16997–17003 CrossRef CAS PubMed.
- M. B. Chambers, X. Wang, N. Elgrishi, C. H. Hendon, A. Walsh, J. Bonnefoy, J. Canivet, E. A. Quadrelli, D. Farrusseng, C. Mellot-Draznieks and M. Fontecave, ChemSusChem, 2015, 8, 603–608 CrossRef CAS PubMed.
- T. Kajiwara, M. Fujii, M. Tsujimoto, K. Kobayashi, M. Higuchi, K. Tanaka and S. Kitagawa, Angew. Chem., Int. Ed., 2016, 55, 2697–2700 CrossRef CAS PubMed.
- N. Kornienko, Y. Zhao, C. S. Kley, C. Zhu, D. Kim, S. Lin, C. J. Chang, O. M. Yaghi and P. Yang, J. Am. Chem. Soc., 2015, 137, 14129–14135 CrossRef CAS PubMed.
- I. Hod, M. D. Sampson, P. Deria, C. P. Kubiak, O. K. Farha and J. T. Hupp, ACS Catal., 2015, 5, 6302–6309 CrossRef CAS.
- H. Fei, M. D. Sampson, Y. Lee, C. P. Kubiak and S. M. Cohen, Inorg. Chem., 2015, 54, 6821–6828 CrossRef CAS PubMed.
- C. Wang, Z. Xie, K. E. deKrafft and W. Lin, J. Am. Chem. Soc., 2011, 133, 13445–13454 CrossRef CAS PubMed.
- C. Wang, J.-L. Wang and W. Lin, J. Am. Chem. Soc., 2012, 134, 19895–19908 CrossRef CAS PubMed.
- S. Lin, Y. Pineda-Galvan, W. A. Maza, C. C. Epley, J. Zhu, M. C. Kessinger, Y. Pushkar and A. J. Morris, ChemSusChem, 2017, 10, 514–522 CrossRef CAS PubMed.
- S. Lin, A. K. Ravari, J. Zhu, P. M. Usov, M. Cai, S. R. Ahrenholtz, Y. Pushkar and A. J. Morris, ChemSusChem, 2018, 11, 464–471 CrossRef CAS PubMed.
- A. Bhunia, B. A. Johnson, J. Czapla-Masztafiak, J. Sá and S. Ott, Chem. Commun., 2018, 54, 7770–7773 RSC.
- B. A. Johnson, A. Bhunia and S. Ott, Dalton Trans., 2017, 46, 1382–1388 RSC.
- A. W. Stubbs, L. Braglia, E. Borfecchia, R. J. Meyer, Y. Román- Leshkov, C. Lamberti and M. Dincă, ACS Catal., 2018, 8, 596–601 CrossRef CAS.
- E. D. Metzger, C. K. Brozek, R. J. Comito and M. Dincă, ACS Cent. Sci., 2016, 2, 148–153 CrossRef CAS PubMed.
- V. Pascanu, G. González Miera, A. K. Inge and B. Martín-Matute, J. Am. Chem. Soc., 2019, 141, 7223–7234 CrossRef CAS PubMed.
- L. Ma, C. Abney and W. Lin, Chem. Soc. Rev., 2009, 38, 1248–1256 RSC.
- M. Yoon, R. Srirambalaji and K. Kim, Chem. Rev., 2012, 112, 1196–1231 CrossRef CAS PubMed.
- Report of the Basic Energy Sciences Roundtable on Liquid Solar Fuels, US Department of Energy, Rockville, Maryland, 2019, https://science.osti.gov/bes/Community-Resources/Reports Search PubMed.
- D. Yang, M. A. Ortuño, V. Bernales, C. J. Cramer, L. Gagliardi and B. C. Gates, J. Am. Chem. Soc., 2018, 140, 3751–3759 CrossRef CAS PubMed.
- D. Yang, C. A. Gaggioli, D. Ray, M. Babucci, L. Gagliardi and B. C. Gates, J. Am. Chem. Soc., 2020, 142(17), 8044–8056 CrossRef CAS PubMed.
- E. S. Gutterød, S. Øien-Ødegaard, K. Bossers, A.-E. Nieuwelink, M. Manzoli, L. Braglia, A. Lazzarini, E. Borfecchia, S. Ahmadigoltapeh, B. Bouchevreau, B. T. Lønstad-Bleken, R. Henry, C. Lamberti, S. Bordiga, B. M. Weckhuysen, K. P. Lillerud and U. Olsbye, Ind. Eng. Chem. Res., 2017, 56, 13206–13218 CrossRef.
- D. Yang and B. C. Gates, ACS Catal., 2019, 9, 1779–1798 CrossRef CAS.
- S. R. Ahrenholtz, C. C. Epley and A. J. Morris, J. Am. Chem. Soc., 2014, 136, 2464–2472 CrossRef CAS PubMed.
- S. Lin, P. M. Usov and A. J. Morris, Chem. Commun., 2018, 54, 6965–6974 RSC.
- C. P. Andrieux and J. M. Savéant, J. Electroanal. Chem. Interfacial Electrochem., 1980, 111, 377–381 CrossRef CAS.
- E. Laviron, J. Electroanal. Chem. Interfacial Electrochem., 1980, 112, 1–9 CrossRef CAS.
- H. S. Fogler, Elements of Chemical Reaction Engineering, Pearson Education Inc., 5th edn, 2016 Search PubMed.
- J. Kärger, D. M. Ruthven and D. N. Theodorou, Diffusion in Nanoporous Materials, Wiley-VCH Verlag GmbH & Co. KGaA, 2012 Search PubMed.
- B. Zhang and L. Sun, J. Am. Chem. Soc., 2019, 141, 5565–5580 CrossRef CAS PubMed.
- L. Duan, F. Bozoglian, S. Mandal, B. Stewart, T. Privalov, A. Llobet and L. Sun, Nat. Chem., 2012, 4, 418–423 CrossRef CAS PubMed.
- X. Sala, S. Maji, R. Bofill, J. García-Antón, L. Escriche and A. Llobet, Acc. Chem. Res., 2014, 47, 504–516 CrossRef CAS PubMed.
- D. W. Shaffer, Y. Xie and J. J. Concepcion, Chem. Soc. Rev., 2017, 46, 6170–6193 RSC.
- J. J. Concepcion, M.-K. Tsai, J. T. Muckerman and T. J. Meyer, J. Am. Chem. Soc., 2010, 132, 1545–1557 CrossRef CAS PubMed.
- P. N. Bartlett and K. F. E. Pratt, J. Electroanal. Chem., 1995, 397, 61–78 CrossRef.
- R. Swaminathan, K. Lakshmi Narayanan, V. Mohan, K. Saranya and L. Rajendran, Int. J. Electrochem. Sci., 2019, 2019, 3777–3791 CrossRef.
- M. E. G. Lyons, J. C. Greer, C. A. Fitzgerald, T. Bannon and P. N. Barlett, Analyst, 1996, 121, 715–731 RSC.
- E. W. Thiele, Ind. Eng. Chem., 1939, 31, 916–920 CrossRef CAS.
- R. M. Koros and E. J. Nowak, Chem. Eng. Sci., 1967, 22, 470 CrossRef CAS.
- R. J. Madon and M. Boudart, Ind. Eng. Chem. Fundam., 1982, 21, 438–447 CrossRef CAS.
- M. E. Davis and R. J. Davis, Fundamentals of Chemical Reaction Engineering, McGraw-Hill, New York, 1st edn, 2003 Search PubMed.
- Z. Chen, J. J. Concepcion, X. Hu, W. Yang, P. G. Hoertz and T. J. Meyer, Proc. Natl. Acad. Sci. U. S. A., 2010, 107, 7225–7229 CrossRef CAS PubMed.
- G. S. Mohammad-Pour, K. O. Hatfield, D. C. Fairchild, K. Hernandez-Burgos, J. Rodríguez-López and F. J. Uribe-Romo, J. Am. Chem. Soc., 2019, 141, 19978–19982 CrossRef CAS PubMed.
Footnote |
| † Electronic supplementary information (ESI) available: Glossary of terms, simulated results, and complete derivations of reaction-diffusion kinetic models. See DOI: 10.1039/d0sc02601h |
| This journal is © The Royal Society of Chemistry 2020 |

