
 Open Access Article
 This Open Access Article is licensed under a Creative Commons Attribution-Non Commercial 3.0 Unported Licence
Type I photosensitizers based on phosphindole oxide for photodynamic therapy: apoptosis and autophagy induced by endoplasmic reticulum stress†
Zeyan
Zhuang
a,
Jun
Dai
 b,
Maoxing
Yu
a,
Jianqing
Li
a,
Pingchuan
Shen
a,
Rong
Hu
a,
Xiaoding
Lou
c,
Zujin
Zhao
*a and
Ben Zhong
Tang
ad
b,
Maoxing
Yu
a,
Jianqing
Li
a,
Pingchuan
Shen
a,
Rong
Hu
a,
Xiaoding
Lou
c,
Zujin
Zhao
*a and
Ben Zhong
Tang
ad
aState Key Laboratory of Luminescent Materials and Devices, Guangdong Provincial Key Laboratory of Luminescence from Molecular Aggregates, South China University of Technology, Guangzhou 510640, China. E-mail: mszjzhao@scut.edu.cn
bDepartment of Obstetrics and Gynecology, Tongji Hospital, Tongji Medical College, Huazhong University of Science and Technology, Wuhan 430074, China
cEngineering Research Center of Nano-Geomaterials of Ministry of Education, Faculty of Materials Science and Chemistry, China University of Geosciences, Wuhan 430074, China
dDepartment of Chemistry, The Hong Kong University of Science & Technology, Kowloon, Hong Kong, China
First published on 2nd March 2020
Abstract
Photodynamic therapy (PDT) is considered a pioneering and effective modality for cancer treatment, but it is still facing challenges of hypoxic tumors. Recently, Type I PDT, as an effective strategy to address this issue, has drawn considerable attention. Few reports are available on the capability for Type I reactive oxygen species (ROS) generation of purely organic photosensitizers (PSs). Herein, we report two new Type I PSs, α-TPA-PIO and β-TPA-PIO, from phosphindole oxide-based isomers with efficient Type I ROS generation abilities. A detailed study on photophysical and photochemical mechanisms is conducted to shed light on the molecular design of PSs based on the Type I mechanism. The in vitro results demonstrate that these two PSs can selectively accumulate in a neutral lipid region, particularly in the endoplasmic reticulum (ER), of cells and efficiently induce ER-stress mediated apoptosis and autophagy in PDT. In vivo models indicate that β-TPA-PIO successfully achieves remarkable tumor ablation. The ROS-based ER stress triggered by β-TPA-PIO-mediated PDT has high potential as a precursor of the immunostimulatory effect for immunotherapy. This work presents a comprehensive protocol for Type I-based purely organic PSs and highlights the significance of considering the working mechanism in the design of PSs for the optimization of cancer treatment protocols.
Introduction
Photodynamic therapy (PDT)1–3 is emerging as a pioneering and effective clinical modality for cancer treatment because it has unique merits of noninvasive nature, spatiotemporal controllability, negligible drug resistance, low systemic toxicity and immunostimulatory activity, which enable it to circumvent the problems of conventional antitumor protocols. Generally, PDT is dependent on three nontoxic components, the photosensitizer (PS), light and oxygen (O2), to generate cytotoxic reactive oxygen species (ROS) that rapidly interact with biological matter and lead to antitumor effects including cell death, vascular damage and immune response. Although PDT has been undergoing clinical applications or trials targeted to a wide range of tumors, a tough challenge that limits its development remains, which is due to the fundamental paradox between the high O2 dependency of currently available PSs and the hypoxic (not anaerobic) nature of solid tumors caused by insufficient blood supply.4–6 Worse still, the photochemical consumption of O2 and microvascular damage during the PDT process aggravate the O2 shortage, making PDT self-limited with an unsatisfactory outcome, especially in continuous treatment.7,8 To address this issue, various approaches have been proposed,9,10 which can be roughly classified into two broad categories. One is improving the O2 supply, which can enhance PDT efficacy but often leads to detrimental side-effects, such as oxygen toxicity.11 And the other is reducing the O2 demand. The more tumoricidal Type I PDT is regarded as a direct strategy with stronger hypoxia tolerance to overcome the limitations of traditional PDT that dominantly relies upon the Type II mechanism.12,13The so-called Type I and Type II mechanisms frequently discussed in PDT refer to two competing photoreaction pathways of ROS generation.14–16 The former yields radical species (e.g. superoxide (O2˙−), peroxide (O22−) and hydroxyl (HO˙) radicals) from the reactions among excited PSs, various substrates (e.g. reduced coenzymes, amino acids, vitamins and nitrogenous bases)17,18 and O2 through electron transfer, while the latter features energy transfer and singlet oxygen (1O2) formation. Among these ROS, HO˙, originating from the cascade bioreactions (disproportionation reaction and Haber–Weiss/Fenton reaction) of O2˙− or one-step oxidation of water during the Type I process, is the most aggressive species with extremely high chemical reactivity to almost all biological molecules.19–21 Therefore, Type I PDT can achieve a better antihypoxia outcome. Up to now, several kinds of PSs following the Type I pathway have been reported to achieve significant advances, such as antennae–fullerene conjugates,12 inorganic nanocomposites,22,23 organometallic complexes24,25 and metal–organic frameworks.26,27 However, for these complicated materials, the severe immunotoxicity, poor reproducibility and complex pharmacokinetics hinder their clinical application to some degree. Under this consideration, organic small molecules are reasoned to be ideal candidates due to their advantages of optimal biosafety, structural diversity, flexible preparation, adjustable properties and robust reproducibility, although their capacity and efficiency are always underappreciated. Triarylmethanes, serving as typical representatives, have previously been reported to show Type I PDT activity but with extremely low yields.28,29 Encouragingly, some purely organic small-molecule PSs based on the Type I pathway have emerged recently.30–32 For example, Peng et al. reported benzophenothiazine analogues with high PDT activity against hypoxic conditions by generating O2˙−. These illuminating reports boost people's interest in the stalemated Type I-involved PDT based on purely organic small molecules, although there is much work ahead to create a clear mechanistic picture, generalize a universal molecular design principle and further achieve the desired treatment performance.
As described above, the antitumor effect of PDT involves not only eliminating the local primary tumor but also triggering systemic antitumor immunity, through inflammatory response or immunogenic cell death (ICD), against circulating, metastatic or recurrent tumors to meet the demand for long-term management.33–35 ICD is obligatorily and critically preceded by calreticulin exposure resulting from ROS-based endoplasmic reticulum (ER) stress.36,37 So, ICD inducers are classified into two categories: non-ER-targeting ones with collateral effects and ER-targeting ones with direct effects.38 The non-ER-targeting category covers most of the currently known ICD inducers including chemotherapeutic agents, proteasome inhibitors, certain cell components and some non-ER-targeting PSs,39,40 which is still not yet the ideal alternative due to the disequilibrium between the off-target effects and dose-limiting side effects.41 It is in this context that ER-focused PDT is considered an ideal modality to fit the criterion of ROS-based ER stress through the most simplified pathway.42,43 With the advances of PDT in recent decades, many functional PSs targeting specific subcellular structures have been developed.44–46 So far, however, except for the representative hypericin,47 few ER-targeting PSs have been reported because of the unclear targeting mechanism, which remains a challenge.24,48–50 Therefore, the development of ER-targeting PSs and the investigation of ER-mediated PDT are of great significance.
In previous work, we used a phosphindole oxide (PIO) core as an electron-accepting building block to construct donor–acceptor (D–A) fluorogens with aggregation-induced emission (AIE) attributes.51,52 These PIO-based fluorogens also offer the basic advantages of desirable chemical-, thermal- and photo-stability, good membrane permeability and low biotoxicity for the potential biological and medical applications.53 Other than these, the most attractive attribute of this PIO framework lies in its high electron affinity which endows PIO-based π-systems with the ability to attract and stabilize an external electron,54–56 resulting from the peculiar electronic structure features of poor aromaticity and the low-lying lowest unoccupied molecular orbital (LUMO).57–59 And taking the “heavy atom” effect of phosphorus which can promote intersystem crossing (ISC) into consideration,60 we envision that the PIO-based fluorogens should have promising potential as PSs for PDT via the Type I mechanism. To corroborate this hypothesis, herein, we report a rational design of two purely organic isomeric fluorogens comprising a PIO core and functional groups of triphenylamine (TPA) and pyridine (Py). Impressively, the obtained isomeric fluorogens achieve impressive ROS generation ability via the Type I mechanism but with different production efficiencies. As illustrated in Scheme 1A, the triplet PS transforms into a radical anion by accepting an electron from adjacent substrates and further donates the external electron to oxygen, yielding the reduction product of oxygen. We investigate the underlying photophysical and photochemical mechanisms to provide guidance for the development of new robust PSs based on the Type I route. Notably, as summarized in Scheme 1B, the PIO-based fluorogens can primarily internalize into a neutral lipid region, particularly in the ER, of living cells, and induce cell death by photoactivation. Further in vitro and in vivo evaluations reveal that the PIO-based fluorogens can provoke ER stress, subsequently trigger dual cell death modes of apoptosis and autophagy, and eventually present effective PDT potency to ablate the solid tumor, showing good promise as a precursor of the immunostimulatory effect for immunotherapy against circulating, metastatic and recurrent tumors.
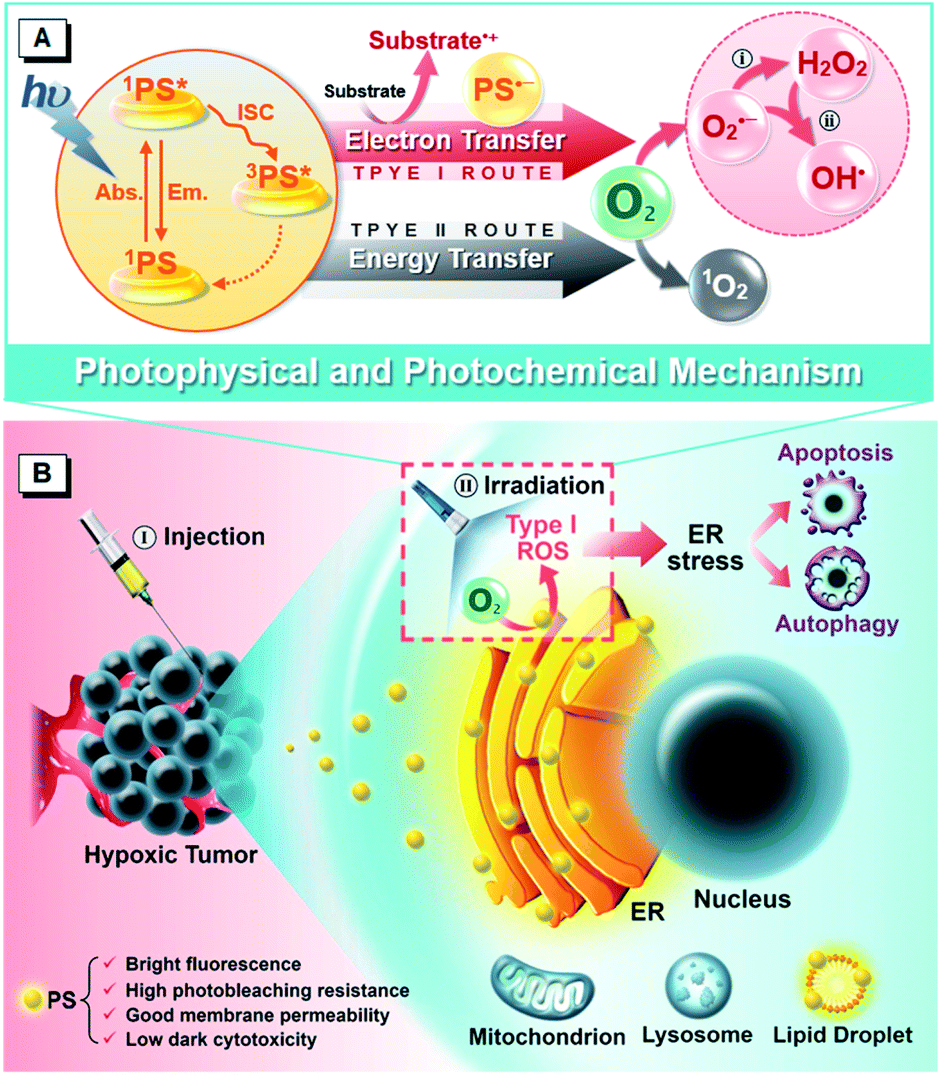 | ||
| Scheme 1 Schematic illustration of (A) photophysical and photochemical mechanisms and (B) the cytological process of PDT treatment mediated by PIO-based fluorogens. (i) Disproportionation reaction; (ii) Haber–Weiss/Fenton reaction. | ||
Results and discussion
Synthesis and characterization
The synthetic routes toward PIO-based fluorogens are illustrated in Fig. 1A. Intermediate 3 is smoothly obtained from the Sonogashira coupling of 4-ethynylpyridine (1) with 4-bromotriphenylamine (2) in a good yield and further undergoes oxidative cyclization with ethyl phenylphosphinate (4), catalyzed by silver oxide (Ag2O), to furnish two target isomeric molecules (α-TPA-PIO and β-TPA-PIO) simultaneously. α-TPA-PIO and β-TPA-PIO are isolated by chromatography (using petroleum ether/tetrahydrofuran (THF) = 4/1 and 2/1, v/v, respectively), because α-TPA-PIO has lower polarity than β-TPA-PIO. Detailed synthesis procedures and characterization data from NMR, high resolution mass spectroscopy (HRMS) and X-ray crystallography analysis are provided in the ESI (Fig. S1 and S2†). To confirm the molecular structures of the two isomers, their 1H NMR spectra are analyzed (Fig. S3†). The peaks assigned to the protons on TPA of α-TPA-PIO emerged at 7.30–6.80 ppm and are upfield-shifted relative to those of β-TPA-PIO (7.35–7.04 ppm), due to the larger electronic density at the α-position of PIO. The proton peaks of Py show the same trend. In addition, crystallography analysis of single crystals of α-TPA-PIO and β-TPA-PIO, cultured in methanol/dichloromethane (DCM) mixtures by slow solvent evaporation, confirms their molecular structures and configurations (Fig. 1B). For α-TPA-PIO, the electron-donating TPA at the α-position is well π-conjugated to the PIO core with a very small torsion angle of 11.2°, while Py is twisted out of the plane of PIO with a much larger torsion angle of 75.3° and thus contributes less to the π-conjugation. Conversely, β-TPA-PIO adopts a more twisted D–A conformation with torsion angles of 50.4° and 54.0° of the PIO core with TPA and Py, respectively.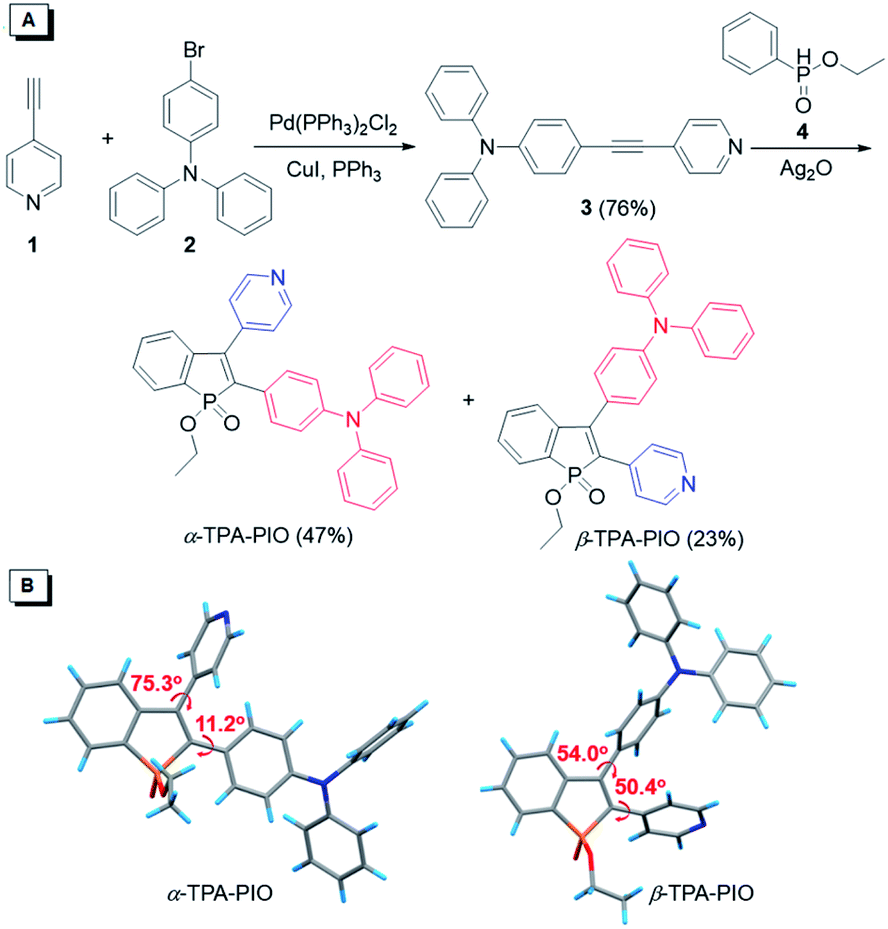 | ||
| Fig. 1 (A) Synthetic route and (B) crystal structures of α-TPA-PIO and β-TPA-PIO. | ||
Optical and electrochemical properties
The optical properties of α-TPA-PIO and β-TPA-PIO including absorption spectra, photoluminescence (PL) spectra and absolute fluorescence quantum yields (ΦFs) are recorded in various solvents with different polarities, in aggregates and in solid films, as summarized in Table S1.† The aggregates of α-TPA-PIO and β-TPA-PIO are obtained by dispersing their dimethylsulfoxide (DMSO) solutions (1 vol%) in phosphate buffered saline (PBS). The formed nanoparticles are of good stability and dispersity in aqueous media with average sizes of ∼91 and 79 nm, respectively, and a low polydispersity index of 0.08 (Fig. S4†), measured by dynamic light scattering.As shown in Fig. S5A and B,†α-TPA-PIO and β-TPA-PIO exhibit stable absorption spectra in various solvents. In DMSO, α-TPA-PIO exhibits two main absorption bands at about 300 and 415 nm, which can be ascribed to π–π* transition and charge transfer (CT) from TPA to PIO, respectively. β-TPA-PIO exhibits an intense absorption band at 300 nm associated with π–π* transition and shows a shoulder peak at about 400 nm associated with CT from TPA to PIO. The absorption band ascribed to the CT of α-TPA-PIO is red-shifted and much stronger (molar absorptivity: ∼1.8 × 10⁴ M−1 cm−1 in DMSO) compared to that of β-TPA-PIO (molar absorptivity: ∼0.8 × 10⁴ M−1 cm−1 in DMSO) (Fig. 2A), indicating that α-TPA-PIO exhibits stronger electronic coupling interaction in the ground state.
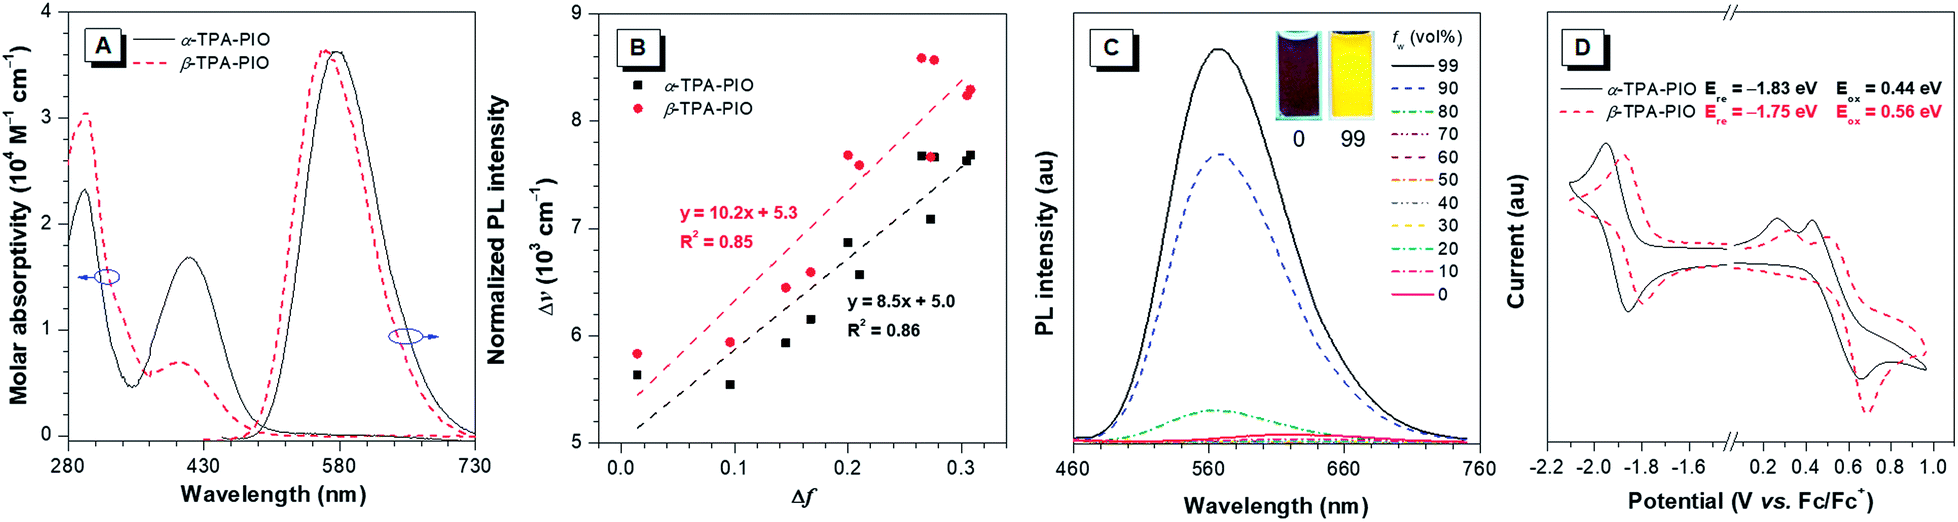 | ||
| Fig. 2 (A) Absorption spectra of α-TPA-PIO and β-TPA-PIO in DMSO and normalized PL spectra of α-TPA-PIO and β-TPA-PIO in PBS with 1 vol% DMSO excited at 415 nm and 400 nm, respectively (concentration: 10 μM). (B) Plots of the Stokes shift (Δν) of α-TPA-PIO and β-TPA-PIO in different solvents vs. the corresponding orientation polarizability (Δf) with the fitting lines (concentration: 10 μM). (C) PL spectra of β-TPA-PIO in DMSO/water mixtures with different fws, excited at 400 nm (concentration: 10 μM). Inset: Photos of solutions of β-TPA-PIO in DMSO/water mixtures (fw = 0 and 99 vol%) obtained under the illumination of a UV lamp (365 nm). (D) Cyclic voltammograms of α-TPA-PIO and β-TPA-PIO (concentration: 1 mM). | ||
The PL emissions of α-TPA-PIO and β-TPA-PIO are red-shifted and weaker with the increasing solvent polarities (Fig. S5C and D†) because of the CT process. α-TPA-PIO shows PL peaks from 534 nm in butyl ether to 607 nm in DMSO with ΦFs in the range of 12.5–50.2%, but β-TPA-PIO shows PL peaks from 511 nm to 614 nm with much lower ΦFs in the range of 1.6–12.4% under the same conditions. The larger PL wavelength variation and apparently decreased ΦFs of β-TPA-PIO reveal its stronger twisted intramolecular CT effect. In addition, Fig. 2B shows the plot of the Stokes shift (Δν = νa − νf) of α-TPA-PIO and β-TPA-PIO in different solvents against the corresponding orientation polarizability (Δf), according to the Lippert–Mataga equation. The fitted slope of α-TPA-PIO is smaller than that of β-TPA-PIO, confirming that β-TPA-PIO has a larger excited-state dipole moment, namely, a stronger CT effect in the excited state. In aggregates, α-TPA-PIO and β-TPA-PIO show PL peaks at 576 and 563 nm with ΦFs of 44.8% and 8.6%, respectively (Fig. 2A). The redder PL emission and higher ΦF of α-TPA-PIO are attributed to the better π-conjugation between TPA and PIO, in accordance with the crystal structure.
In addition, the AIE attributes of α-TPA-PIO and β-TPA-PIO are investigated in DMSO/water mixtures, by employing water as a poor solvent. For example, the PL intensity of β-TPA-PIO slightly decreases at a low water fraction (fw) because of the increasing solvent polarity and then starts to increase significantly (fw ≥ 80 vol%), where the molecules begin to aggregate, revealing the AIE nature (Fig. 2C and S6†). Nevertheless, when using THF, instead of DMSO, as a good solvent (Fig. S7†), the AIE properties of α-TPA-PIO and β-TPA-PIO become inconspicuous like those of many reported AIE luminogens with a D–A framework and are considered to arise from the competition between restriction of intramolecular motions (RIM) and the twisted intramolecular CT process.61,62
The electrochemical properties of α-TPA-PIO and β-TPA-PIO are investigated by cyclic voltammetry, with ferrocene (Fc) as the internal standard (Fig. 2D). α-TPA-PIO and β-TPA-PIO show similar electrochemical behaviors, presenting a reversible wave for reduction and a quasireversible oxidation event, which reflect the formation of the stable radical anion and unstable radical cation, respectively. Notably, β-TPA-PIO has a lower reduction potential with an onset potential at −1.75 eV (vs. Fc/Fc+) than α-TPA-PIO (−1.83 eV, vs. Fc/Fc+), demonstrating the stronger electron-accepting character of β-TPA-PIO, which endows β-TPA-PIO with the potential for photochemical activity for serving as a Type I PS.
Evaluation of ROS generation in aqueous media
To assess the Type I ROS generation capacities of α-TPA-PIO and β-TPA-PIO, bovine serum albumin (BSA) which can drive the formation of radical (or radical anions) intermediates is employed as the requisite substrate, and crystal violet (CV), a typical representative of triarylmethanes, is selected as a Type I reference (Scheme 1A).29,63,64 A commercial indicator that responds to any general types of ROS, 2,7-dichlorodihydrofluorescein (DCFH), is initially used (Fig. 3A and S8†). Upon exposure to white light irradiation of 20 mW cm−2, the non-emissive DCFH solution with 1 μM α-TPA-PIO or β-TPA-PIO exhibits increased PL intensity, reaching about 12- or 40-fold enhancement within 8 min, respectively, while the emission exhibited by CV under the same conditions is barely increased relative to that of the control. In the presence of 500 nM BSA, α-TPA-PIO and β-TPA-PIO show higher emission enhancements of about 20- and 110-fold, respectively, indicating substrate-promoted ROS generation, where BSA acts as an electron donor to assist the Type I process of PSs. CV shows similar behavior despite the low yield. However, superfluous BSA (5 μM) will compete with the indicator and scavenge the produced ROS, leading to only about 11-fold emission enhancement of β-TPA-PIO (Fig. S9†).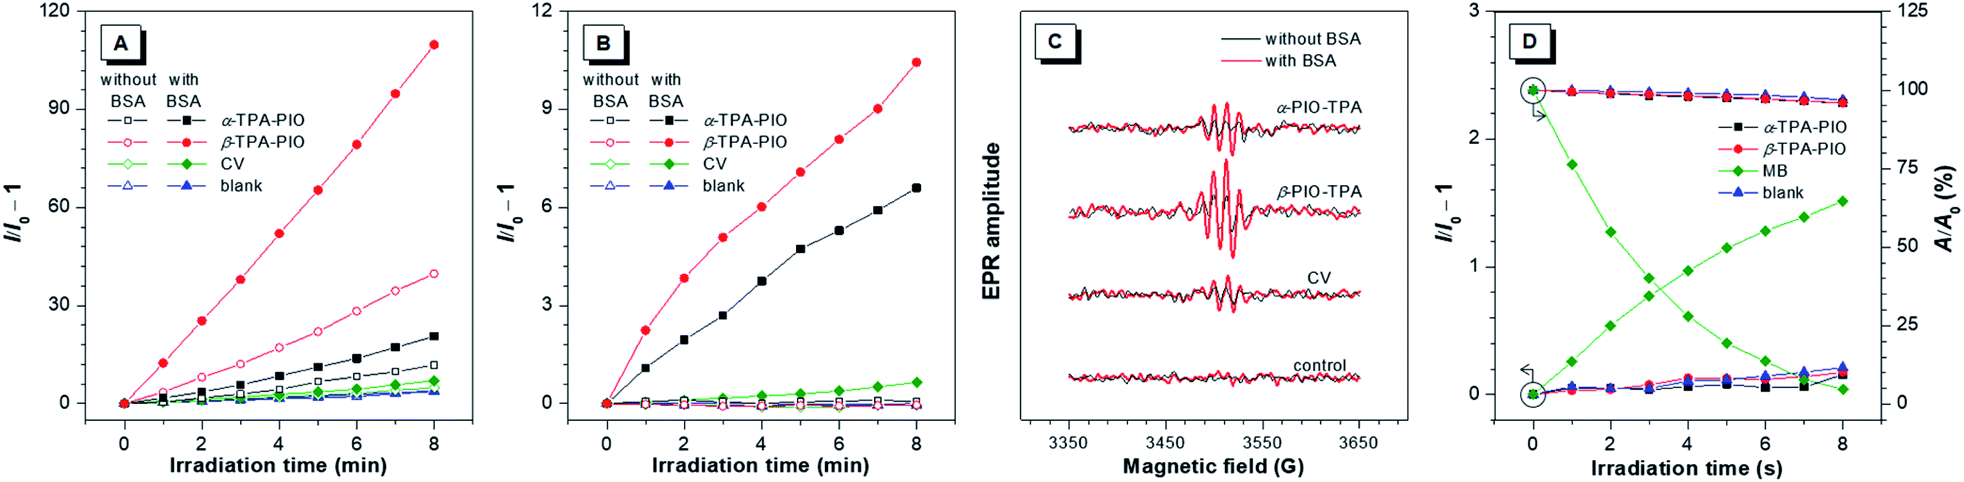 | ||
| Fig. 3 (A) Plots of relative PL intensity of DCFH (for general ROS detection) and (B) plots of relative PL intensity of HPF (for OH˙ detection) in the presence of 1 μM α-TPA-PIO, β-TPA-PIO or CV (without/with 500 nM BSA) in PBS with 1 vol% DMSO vs. irradiation time (white light, 20 mW cm−2). (C) EPR signals of BMPO (for Type I ROS detection) in the presence of 1 μM α-TPA-PIO, β-TPA-PIO or CV (without/with 500 nM BSA) in PBS with 1 vol% DMSO (white light, 100 mW cm−2). (D) Plots of relative PL intensity of SOSG and decomposition rates of ABDA (for 1O2 detection) in the presence of 1 μM α-TPA-PIO, β-TPA-PIO or MB in PBS with 1 vol% DMSO vs. irradiation time (white light, 20 mW cm−2). I0 and I are the PL intensities of the indicator before and after irradiation, respectively. A0 and A are the absorbances of ABDA before and after irradiation, respectively. | ||
In the preliminarily proven Type I route for α-TPA-PIO, β-TPA-PIO and CV, O2˙− is supposed to be the primary precursor that can be transformed to OH˙ through secondary reactions. To further verify the specific type of the produced ROS from α-TPA-PIO and β-TPA-PIO, we evaluate several commercially available fluorescent probes for ROS. DCFH, one of the most classic ROS probes but with no specificity, is reported to suffer from serious autoxidation caused by its high reactivity, so that DCFH itself is likely to serve as the substrate.65 Dihydrorhodamine 123 (DHR123) has been employed as a selective O2˙− indicator in several reported studies.24,30,31 But as a matter of fact, DHR123 has always been known as an non-selective probe that can react with various oxidizing species except for O2˙− (very low sensitivity).66–68 Dihydroethidium (DHE) is a widely used fluorescence assay for the detection of intracellular O2˙−.69,70 Actually, a well-established specific indicator for O2˙− in cell-free systems is commercially scarce.12 Accordingly, we decided to measure the secondary product, OH˙, using hydroxyphenyl fluorescein (HPF) to validate the Type I process.65 Delightfully, a dramatically boosted fluorescence signal is observed in the solution of HPF containing both 500 nM BSA and 1 μM α-TPA-PIO or β-TPA-PIO after 8 min of white light irradiation of 20 mW cm−2, while only slight fluorescence enhancement occurs for CV under the same conditions, indicating that α-TPA-PIO and β-TPA-PIO can distinctly and efficiently produce discernible OH˙ in the presence of a substrate (Fig. 3B and S10†).
In addition, electron paramagnetic resonance (EPR) spectroscopy using 5-tert-butoxycarbonyl-5-methyl-1-pyrroline-N-oxide (BMPO) as a spin-trap agent is carried out to monitor the formation of oxygenous radicals. Fig. 3C shows the typical EPR spectra of oxygenous radical adducts formed with BMPO after white light irradiation of 100 mW cm−2 for 5 min, which are in good agreement with those in the literature.71α-TPA-PIO, β-TPA-PIO and CV exhibit similar BSA-promoted signal enhancements, but β-TPA-PIO exhibits the strongest EPR signal intensity, indicative of its best generation ability of oxygenous radicals, namely Type I ROS.
To further identify the nature of the produced ROS, 9,10-anthracenediyl-bis(methylene) dimalonic acid (ABDA) and singlet oxygen sensor green (SOSG) are employed as specific 1O2 indicators. Methylene blue (MB) with no response to BSA (Fig. S11†) is selected as a Type II reference.72 As depicted in Fig. 3D, S12 and S13,† the 1O2 measurement results of α-TPA-PIO and β-TPA-PIO are similar to those of the blank sample without a detectable amount of 1O2, which is different from the apparent signal change of MB, when using either SOSG or ABDA as the indicator. These results reveal the poor 1O2 generation capacities of α-TPA-PIO and β-TPA-PIO.
On the basis of the above evidence, it is reasonable to conclude that α-TPA-PIO and β-TPA-PIO predominately follow the Type I pathway to generate Type I ROS. β-TPA-PIO is a potential candidate as an efficient Type I PS for PDT in view of its stronger capability for Type I ROS generation in comparison with α-TPA-PIO.
Photophysical and photochemical mechanisms
The in-depth photophysical and photochemical mechanisms of these two Type I ROS generators, α-TPA-PIO and β-TPA-PIO, and their different performances are important for a fundamental understanding and new molecule design. We carry out systematic theoretical studies by using the Gaussian 09, Multiwfn73 and Dalton programs. The ground states (S0) and excited states containing singlet and triplet states (S1, T1, and T2) are evaluated by performing density functional theory (DFT) and time-dependent density functional theory (TD-DFT) calculations at the level of M06-2X/6-311G (d,p), and the orthogonal coordinates of the optimized S0, S1, T1 and T2 structures are given in Table S2 and S3.† The transitions of the optimized states are analyzed based on the natural transition orbitals (NTOs) with atomic contribution to holes and electrons (Fig. S14–S18†). For simplicity, the well-visualized centroids of charges are depicted from two indexes, the center-to-center distance between holes and electrons (Dh,e) and the average distribution span of holes and electrons along the D–A direction (HCT) (Fig. 4A and S19†).74,75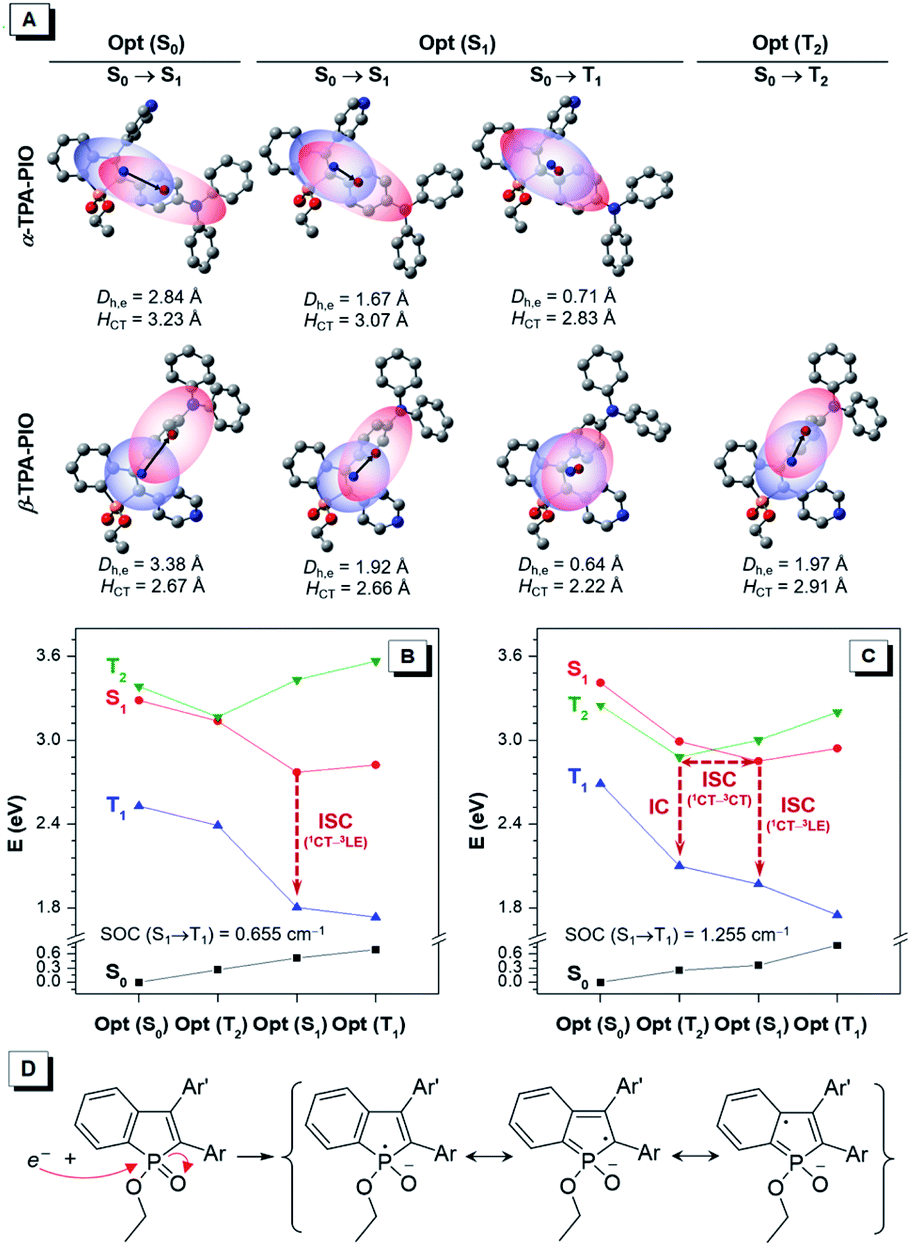 | ||
| Fig. 4 (A) Centroids of holes (red region) and electrons (blue region) of the corresponding transition at the optimized structures of α-TPA-PIO and β-TPA-PIO, with labels of the centers of holes (red point) and electrons (blue point) and two indexes, Dh,e and HCT. Calculated energy diagram at the optimized S0, S1, T1, and T2 state structures of (B) α-TPA-PIO and (C) β-TPA-PIO with labels of SOC values and the processes from excited singlets to triplets. (D) The proposed representative resonance structure of the PIO radical ions. | ||
Generally, the first singlet transitions of S0 and S1 states are related to the absorption maximum (Fig. S20†) and emission peak, respectively. Their charge distributions show the features of moderate orbital overlap between holes and electrons with spatial separation along the direction of the α- (or β-) axis of PIO for α-TPA-PIO (or β-TPA-PIO). These can be considered as CT transitions because of the large Dh,e, although the separation of holes and electrons is inadequate. It is clear that α-TPA-PIO has better conjugation but weaker CT character in comparison with β-TPA-PIO, as evidenced by the larger HCT and smaller Dh,e in both S0 and S1 states, which is consistent with the optical experiments.
To study the subsequent ISC process that serves as the photophysical basis of ROS generation, the calculated energy levels of singlet and triplet states of α-TPA-PIO and β-TPA-PIO at the optimized structures are drawn as a diagram (Fig. 4B and C). For α-TPA-PIO, an effective channel from S1 to T1 is found to mediate ISC. The first triplet transition at the optimized S1 state exhibits local orbital overlap with a small Dh,e, the so-called local excitation (LE) character. Based on the El-Sayed rule,76 the spin–orbit coupling (SOC)77 between 1CT and 3LE with a change in transition type is efficient. The calculated SOC value of α-TPA-PIO is 0.655 cm−1, and that of β-TPA-PIO is 1.255 cm−1. So, β-TPA-PIO holds a more efficient ISC process because of its larger SOC value. Besides, an additional ISC channel through the interaction between S1 and the high-lying triplet state T2 is found in β-TPA-PIO. Concerning the CT character of the T2 state with almost the same spatial orbital distribution as that of the S1 state, their SOC is inefficient. However, the energy splitting is minimized between 1CT and 3CT.60,78 The energy gap of S1 and T2 (ΔEST) is positive at the optimized S1 state but negative at the optimized T2 state, with very small absolute values of about 0.1 eV, indicating that an S1–T2 crossing point79 can exist. The crossing point allows for the mixing of S1 with T2 and activates hyperfine coupling (HFC) interactions80,81 to drive ISC, followed by an internal conversion to the lowest T1 state. The efficient ISC process through multichannel β-TPA-PIO plays a crucial role in its higher capability for Type I ROS generation.
In the process of Type I ROS generation, the triplet α-TPA-PIO and β-TPA-PIO will be transformed into intermediate radical anions, α-TPA-PIO˙− and β-TPA-PIO˙−, through electron transfer with adjacent substrates, because of the high electron affinity of the PIO framework. To confirm their structures, α-TPA-PIO˙− and β-TPA-PIO˙− are optimized to certain geometries, and the orthogonal coordinates are given in Table S4.† Observed from the structural parameters listed in Table S5,† the change of the bond length in the PIO moiety is most noticeable when the molecule accepts an electron. The bonds in the phosphole ring tend to become averaged in length (the double bonds become longer and single bonds become shorter), while those in the fused phenyl ring show the opposite trend in length after gaining an electron. In addition, the atomic charges calculated by the atomic dipole moment corrected Hirshfeld (ADCH)82 method (Table S6†) for α-TPA-PIO, β-TPA-PIO and their radical anions further verify that the negative charge is concentrated in the PIO moiety. Based on this, representative resonance structures of the radical ions are proposed. As illustrated in Fig. 4D, an external electron attacks the positive phosphorus center and breaks the P![[double bond, length as m-dash]](https://www.rsc.org/images/entities/char_e001.gif) O double bond, forming radical anions, which are stabilized by several resonance structures.54–56 Overall, PIO is an ideal moiety that can stabilize an external electron to form radical anion intermediates. So, PIO exhibits strong electron-accepting photochemical activity, which provides the photochemical basis of Type I ROS generation.
O double bond, forming radical anions, which are stabilized by several resonance structures.54–56 Overall, PIO is an ideal moiety that can stabilize an external electron to form radical anion intermediates. So, PIO exhibits strong electron-accepting photochemical activity, which provides the photochemical basis of Type I ROS generation.
Cellular study
The cellular imaging experiment is conducted by confocal laser scanning microscopy (CLSM) by using HeLa cells as a model. After incubation with the medium containing 1 μM α-TPA-PIO or β-TPA-PIO for 30 min, the fluorescence signals are collected in channel mode as well as lambda mode in which the signals of different wavelengths are colored and overlaid to restore the real color (Fig. S21†). Distinct reticular and punctate structures are observed spread all over the cells with vivid fluorescence located at 565 nm and 543 nm for α-TPA-PIO and β-TPA-PIO, respectively, which are recorded by fitting the signal intensity. The short incubation time and high signal intensity reveal that hydrophobic α-TPA-PIO and β-TPA-PIO can effectively penetrate through the lipid layer of the cell membrane.The subcellular distribution profiles of α-TPA and β-TPA are then assessed by co-localization analysis with several commercially available bioprobes for subcellular structures, ER-Tracker Red, Mito-Tracker Red, Lyso-Tracker Red and HCS LipidTOX™ Deep Red neutral lipid stain. Fig. S22† and 5A display the co-localization images for α-TPA-PIO and β-TPA-PIO, respectively, with the intensity profile of synchrony for the region of interest of two co-stained dyes. It is demonstrated that both α-TPA-PIO and β-TPA-PIO accumulate in the neutral lipid structure, particularly in the ER, as evidenced by the high overlay with HCS LipidTOX™ Deep Red neutral lipid stain (at the reticular and punctate pattern) and ER-Tracker Red (at the reticular pattern).
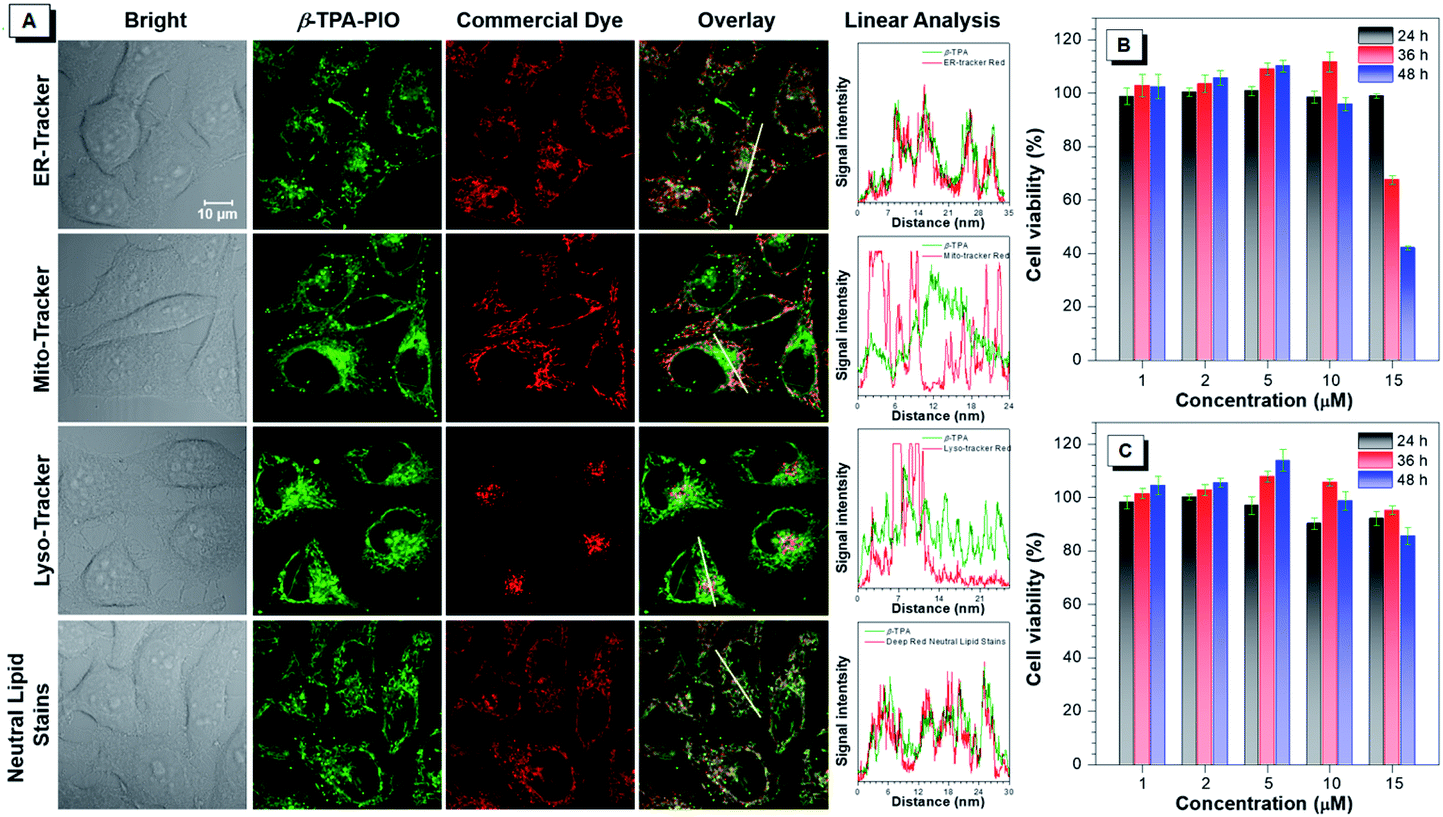 | ||
| Fig. 5 (A) Colocalization images of HeLa cells co-stained with β-TPA-PIO and ER-Tracker Red, Mito-Tracker Red, Lyso-Tracker Red or HCS LipidTOX™ Deep Red neutral lipid stain, with the intensity profile of synchrony for the white line. Cell viability after treatment with a range of concentrations of (B) α-TPA-PIO and (C) β-TPA-PIO for different time periods. Data are shown as mean ± SD (n = 6). | ||
The photobleaching resistance assay of α-TPA-PIO and β-TPA-PIO is performed under continuous excitation and sequential scanning by using a 405 nm laser with 10% power (Fig. S23†). After 15 scans with a total irradiation time of 15 min, negligible signal attenuation (the percentage of intensity loss relative to initial signal intensity) is observed for both α-TPA-PIO and β-TPA-PIO, indicating their excellent photobleaching resistance for application in image-guided PDT. It is also noted that the fluorescence of β-TPA-PIO becomes slightly increased and blue-shifted from 543 nm to 527 nm under irradiation, while the fluorescence of α-TPA-PIO remains almost constant. This change in β-TPA-PIO is probably due to the altered cell physiology and microenvironment caused by the PDT effect, which inspires us to further investigate the cytological mechanism of β-TPA-PIO mediated PDT in the following work.
The long-term cytotoxicity of α-TPA-PIO and β-TPA-PIO is quantitatively evaluated by the standard method of the 3-(4,5-dimethylthiazol-2-yl)-2,5-diphenyltetrazolium bromide (MTT) assay (Fig. 5B and C). The cytotoxicity of α-TPA-PIO is proved to be negligible after 24 h of incubation but becomes significant after a longer incubation time. The cell viability remains only 68% and 42%, after the cells are treated with 15 μM α-TPA-PIO for 36 h and 48 h, respectively. In contrast, β-TPA-PIO is found to have low cytotoxicity even after 48 h of incubation. The cell viability remains over 80% at a high concentration of 15 μM, confirming its better biocompatibility.
PDT in vitro
To access the PDT effect of α-TPA-PIO and β-TPA-PIO, the in situ Type I ROS generation capabilities in vitro are studied. After pre-treatment with the medium containing 10 μM α-TPA-PIO or β-TPA-PIO for 30 min, the cells stained with ROS indicators are observed by CLSM, followed by exposure to continuous irradiation using a 405 nm laser with 1% power within the designated area, and the signal intensity is recorded every 10 s (Fig. 6A). When using 2,7-dichlorodihydrofluorescein diacetate (DCFH-DA) as a universal indicator, the intracellular signal intensity of green fluorescence for β-TPA-PIO shows a sharp increase, which is superior to that for α-TPA-PIO. The DHE for intracellular O2˙− detection and HPF for intracellular OH˙ detection show a remarkably fast and effective increase of signal intensity for β-TPA-PIO, but a slight enhancement for α-TPA-PIO. These results are well consistent with the findings in aqueous media discussed above, suggesting that the two photo-activatable Type I ROS generators, especially β-TPA-PIO, can be utilized as PSs for PDT applications.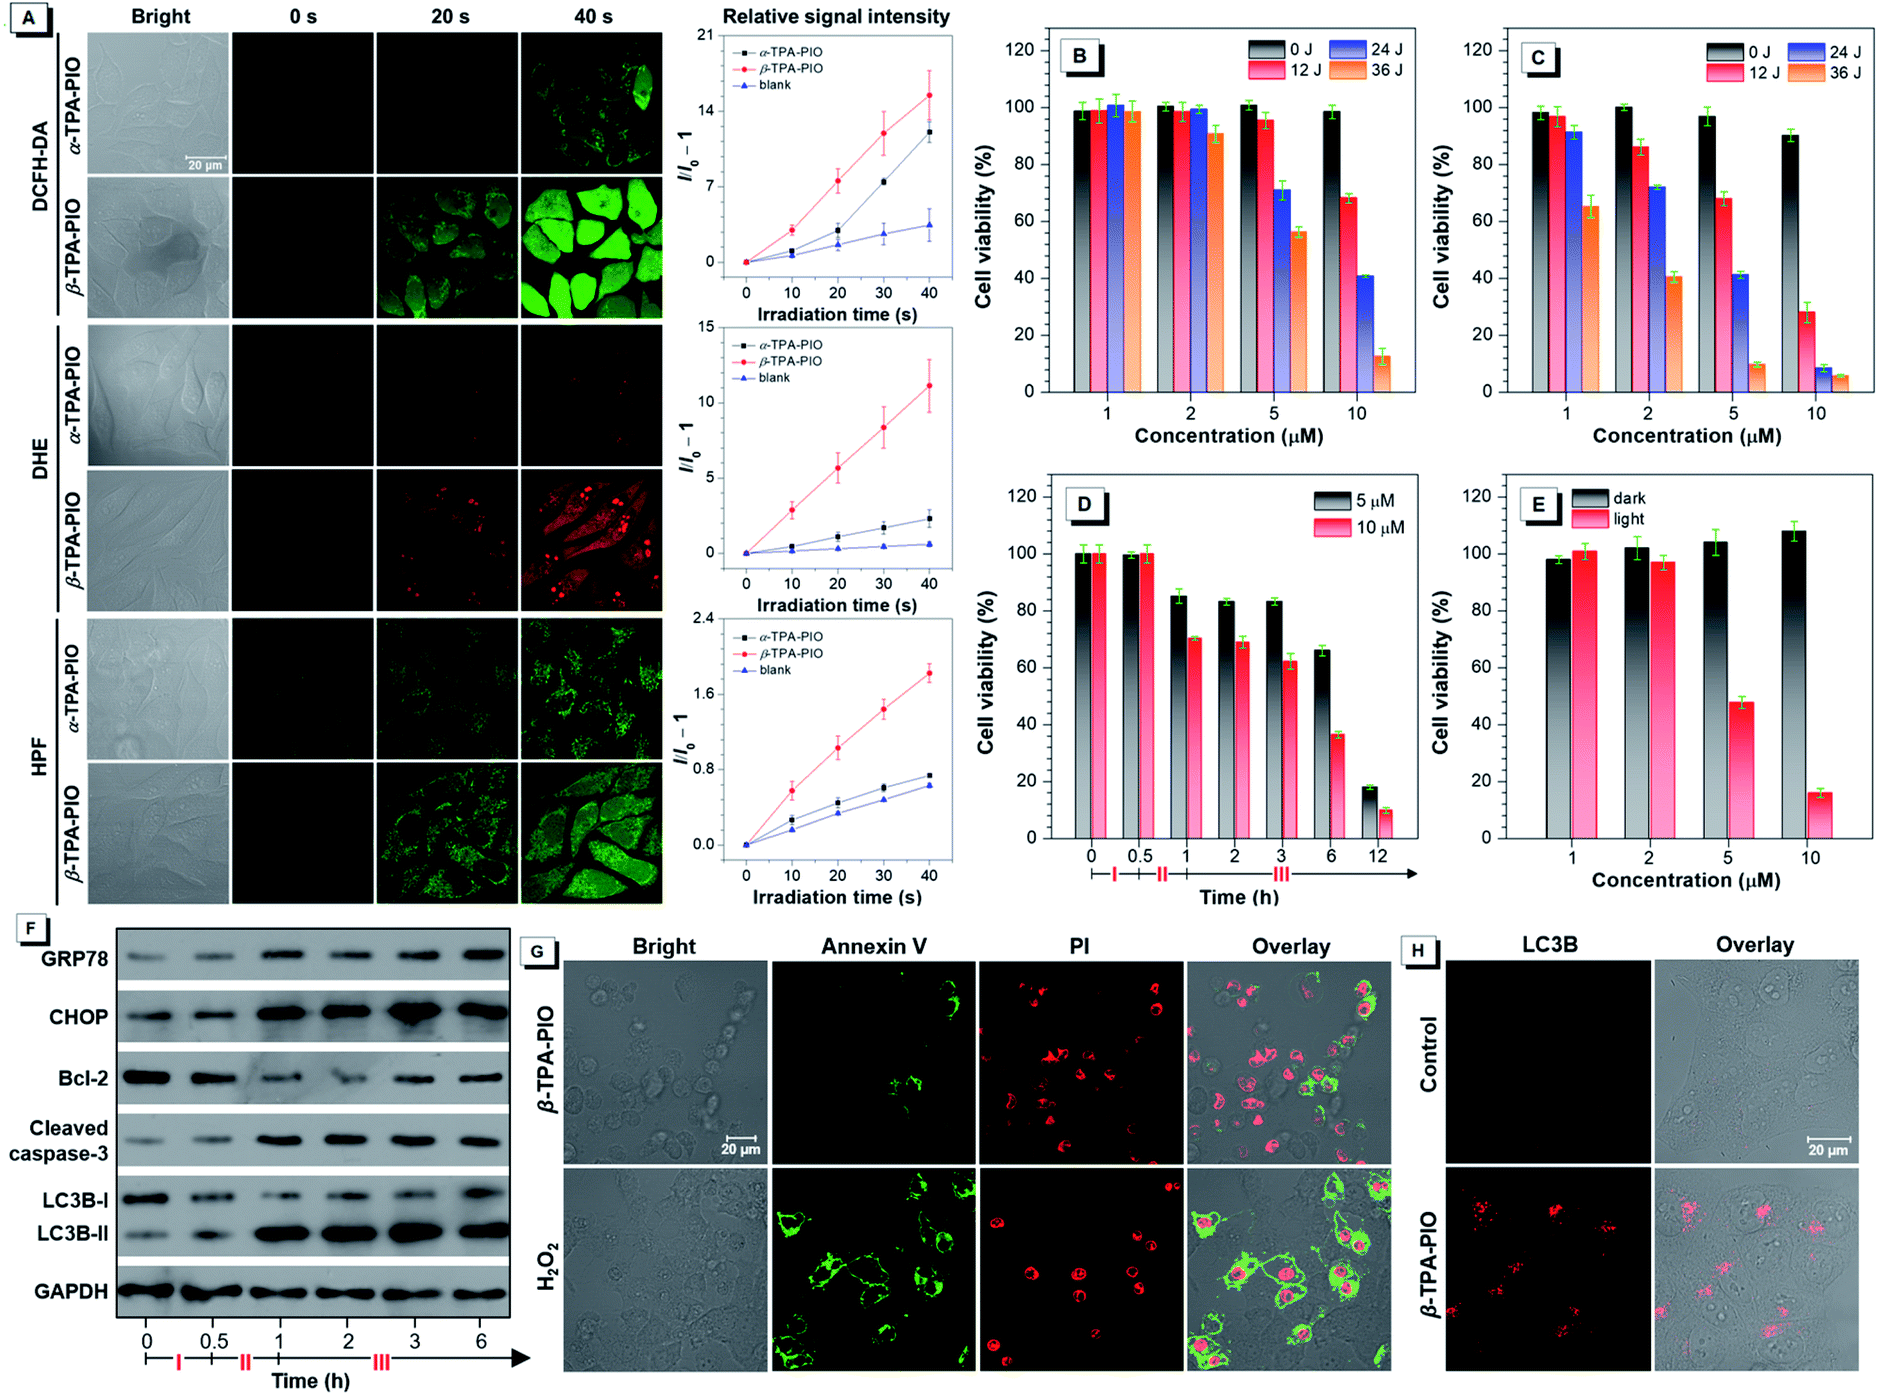 | ||
| Fig. 6 (A) General ROS, O2˙− and OH˙ generation of α-TPA or β-TPA in HeLa cells by using DCFH-DA, DHE and HPF as indicators, respectively, before and after exposure to 405 nm laser irradiation at 1% power with the plot of relative signal intensity of indicators against irradiation time. Data are shown as mean ± SD (n = 3). Cell viability after treatment with a range of concentrations and irradiation doses using (B) α-TPA-PIO or (C) β-TPA-PIO as the PS and white light irradiation of 20 mW cm−2 for 0, 10, 20 or 30 min. (D) Cell viability vs. time during the PDT treatment with β-TPA-PIO. (E) Viability of cells after treatment with a range of concentrations without or with white light irradiation of 20 mW cm−2 for 30 min under hypoxic conditions. Cell viability data are shown as mean ± SD (n = 6). (F) Western blot analysis of various protein expressions vs. time during PDT treatment with β-TPA-PIO. (G) Cell apoptosis analysis after treatment by PDT using 10 μM β-TPA-PIO as the PS (white light irradiation of 20 mW cm−2 for 30 min) and further culturing for 12 h or 880 μM H2O2 for 6 h, by staining with annexin V-Alexa Fluor™ 488 conjugate and PI as the indicator. (H) Immunofluorescence of HeLa cells after treatment with 10 μM β-TPA-PIO (white light irradiation of 20 mW cm−2 for 30 min) and further culturing for 2 h, using anti-LC3B antibody with an Alexa Fluor® 488-labeled secondary antibody as an autophagosome marker. Phase I: treatment with β-TPA-PIO in the dark for 30 min; Phase II: irradiation with white light of 20 mW cm−2 for 30 min; Phase III: further culturing in the dark. | ||
The PDT efficacy in vitro of α-TPA-PIO and β-TPA-PIO is evaluated by using white light irradiation of 20 mW cm−2. After pre-treatment with α-TPA-PIO or β-TPA-PIO for 30 min, different doses of irradiation (by adjusting irradiation time) are applied on HeLa cells followed by culturing for 24 h. The MTT assay shows that after 24 h incubation with α-TPA-PIO or β-TPA-PIO in the dark, high cell viabilities remain over 90%. But the cell viability exhibits a dramatic decrease under white light irradiation, which is dependent on the concentration of PSs and irradiation dose (Fig. 6B and C). Under irradiation of 36 J cm−2 energy, α-TPA-PIO and β-TPA-PIO at a concentration of 10 μM can cause severe cell death, as indicated by the low cell viabilities of only 12.6% and 5.9%, respectively. β-TPA-PIO displays much better therapeutic efficiency than α-TPA-PIO, owing to its superior Type I ROS generation ability. By using β-TPA-PIO, over 50% cell viability is lost at a low concentration of only 2 μM, and over 90% is lost at 5 μM. Then, by using β-TPA-PIO at concentrations of 5 μM and 10 μM, the changes of cell viability with time are further investigated (Fig. 6D). After incubation for 30 min and irradiation exposure for 30 min with white light of 20 mW cm−2, the cell viability shows a noticeable decline. In the subsequent hours, the cells gradually deteriorate and the viability is decreased below 20% within 12 h as the post-PDT time progressed.
Concerning the good performance of Type I ROS generation of β-TPA-PIO, an examination of its PDT efficacy in a hypoxic environment with 8% oxygen content supplied is carried out as well. As shown in Fig. 6E, β-TPA-PIO can still provide a good therapeutic effect because of the excellent antihypoxia activity, as proved by the evident decrease of cell viability.
Meanwhile, the live/dead cell co-staining assay is employed to intuitively confirm the cell destruction effect by using calcein-AM with green fluorescence for live cells and propidium iodide (PI) with red fluorescence for dead cells (Fig. S24†). Completely different from the control group in which only bright green fluorescence is observed, the groups after PDT treatment show dominant occurrence of red fluorescence, revealing the high cell mortality.
With the co-localization results in mind, the ER-accumulating nature of α-TPA-PIO and β-TPA-PIO, which can mainly cause direct photodamage to the ER because of the limited diffusion region of the produced ROS,83 inspires us to investigate the detailed cytological mechanism underlying the PDT effect of β-TPA-PIO. The ER-focused PDT is expected to induce ROS-based ER stress and further trigger cell death in specific mode. Western blot analysis is conducted to monitor the expression level of proteins related to ER stress during the PDT process of β-TPA-PIO (Fig. 6F). Glucose regulated protein (GRP) 78, a major ER chaperone, is well-documented as a key regulator of ER proteostasis and a mediator of macroautophagy, which is induced upon ER stress.84 In addition, C/EBP homologous protein (CHOP) is known as an ER-stress-inducible transcription factor that mediates the proapoptosis pathway through a B-cell lymphoma 2 (Bcl-2)-inhibitable mechanism.85 During the β-TPA-PIO-mediated PDT process, the expressions of both GRP78 and CHOP share a similar pattern: a marked increase soon after the irradiation treatment, in comparison with the untreated group or the β-TPA-PIO-alone group and a leveling off in the post-PDT process, which is considered an apparent response to the severe ER stress.
Furthermore, to estimate the pertinent cell death mechanism, apoptosis/autophagy-related proteins are also evaluated. It is obvious that apoptosis occurs in β-TPA-PIO-mediated PDT, as evidenced by the down-regulation of antiapoptosis proteins (Bcl-2)86 and the activation of an important apoptotic marker, cleaved caspase-3.87 Concurrently, the accumulation of an autophagosome marker, LC3B-II88 (LC3B-I to LC3B-II conversion), reflects that autophagy also exists and functions in the β-TPA-PIO-mediated PDT. In general, both apoptosis and autophagy can occur due to the photodamaged ER. In order to validate this, cell apoptosis analysis using annexin V-Alexa Fluor™ 488 conjugate and PI is performed to identify apoptotic cells (Fig. 6G). Different from the positive control group using H2O2 as the apoptosis inducer, in which a strong signal of Annexin V emerged surrounding the cell membrane, apoptotic characteristics are only observed in some of cells treated with PDT using β-TPA-PIO as the PS (white light irradiation of 20 mW cm−2 for 30 min). Immunofluorescence analysis is conducted by labeling LC3B protein for autophagosomal membranes to reflect the autophagic activity. As shown in Fig. 6H, after treatment with β-TPA-PIO and irradiation (white light, 20 mW cm−2, 30 min), autophagosomes are found to extensively form, indicating that autophagy plays a role in the response to photodamage. Meanwhile, real-time co-localization analysis of cells co-stained with β-TPA-PIO and Mito-Tracker Red is performed to monitor the autophagy process in situ. Fig. S25† displays a visualized portrayal of a range of variations of mitochondria and ER under continuous laser irradiation (405 nm laser at 1% power). The wire-like mitochondria show almost no coincidence with the reticular ER structure labeled with β-TPA-PIO at first, but they become wrapped by the ER89,90 and subsequently become swollen, which are the primary traits of macroautophagy.91 As a result of the ROS-based ER stress caused by β-TPA-PIO-mediated PDT, the involvement of apoptosis and/or autophagy may be a dynamic correlation process, whose balance is often a determinant of overall PDT efficacy.92
β-TPA-PIO-mediated PDT in vivo
Encouraged by its outstanding performance in cellular experiments, β-TPA-PIO is chosen as the PS in an SKOV3 subcutaneous tumor-bearing mouse model to assess the in vivo PDT efficacy. Firstly, we evaluate the imaging effect of β-TPA-PIO in vivo (Fig. 7A). Intense fluorescence at the tumor site can be observed after intratumoral injection of β-TPA-PIO (1 mM, 25 μL/50 mm3 tumor) for 24 h, which indicates that β-TPA-PIO has remarkable tumor retention properties and shows excellent potential in tumor imaging. Subsequently, the PDT efficacy of β-TPA-PIO is evaluated in vivo. After intratumoral injection of β-TPA-PIO (1 mM, 25 μL/50 mm3 tumor) for 24 h, the tumor sites of the mice are irradiated with white light of 200 mW cm−2 for 15 min, denoted as β-TPA-PIO (light +) groups. The mice treated with irradiation alone (using PBS instead of β-TPA-PIO) or β-TPA-PIO alone (without irradiation) are employed as the control groups, denoted as PBS (light +) and β-TPA-PIO (light −) groups, respectively. As showed in Fig. 7B and C, tumors in PBS (light +) and β-TPA-PIO (light −) groups grow rapidly, while the growth of tumors in the β-TPA-PIO (light +) group is remarkably inhibited, indicating the superior PDT outcome of β-TPA-PIO in vivo. To further verify the antitumor efficacy of β-TPA-PIO, tumors from the three groups are sliced and evaluated using hematoxylin and eosin (H&E) for histological analysis. The results reveal that the tumor cells in the control groups are closely aligned without obvious damage, while those in the β-TPA-PIO (light +) group are sparsely aligned with a great number of necrotic tumor cells, confirming the effective destruction of the tumor cells. Meanwhile, neither significant weight loss (Fig. 7D) nor appreciable lesions of the heart, liver, spleen, lungs and kidneys (Fig. S26†) are observed in all mice, indicative of the good biocompatibility of β-TPA-PIO. These preliminary results prove that β-TPA-PIO-mediated PDT is applicable to in vivo systems.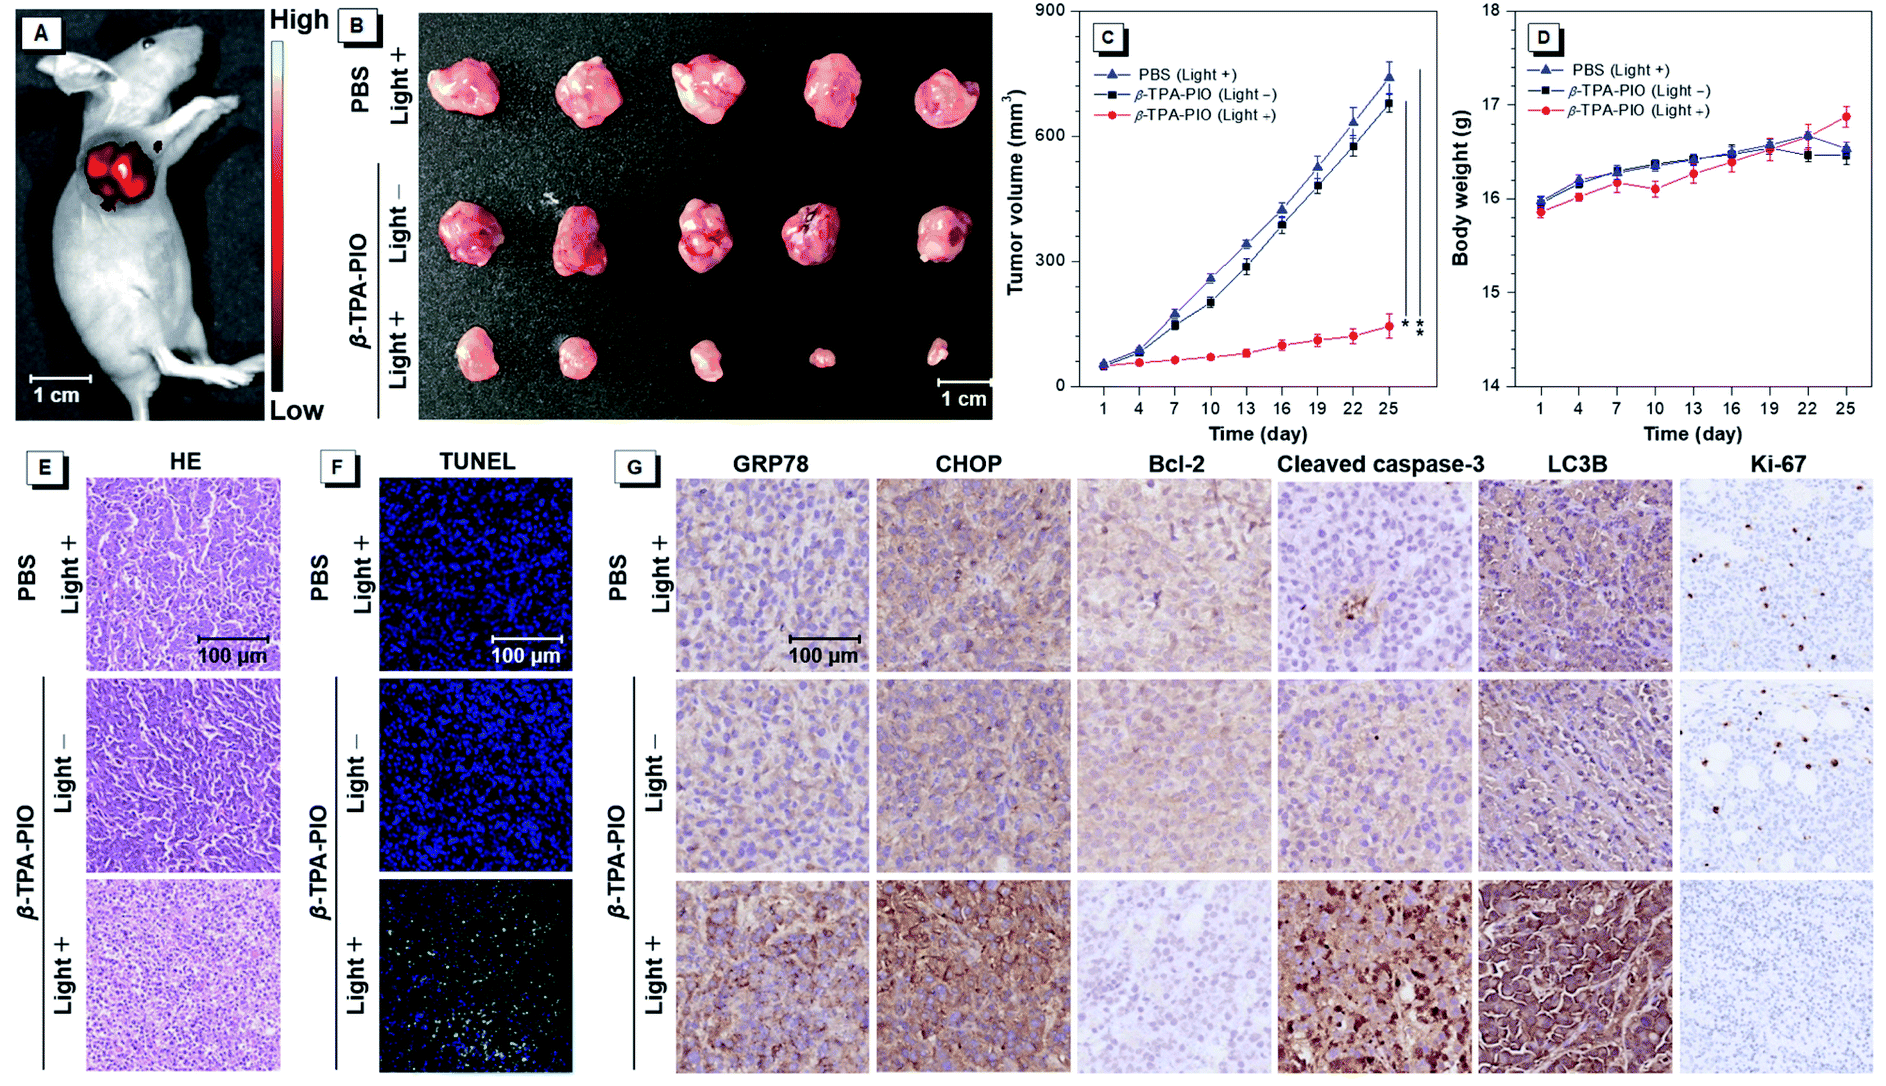 | ||
| Fig. 7 (A) Image of a mouse after intratumoral injection of β-TPA-PIO for 24 h. (B) Representative tumor images. (C) Tumor volume and (D) body weight curve of mice during PDT treatment employing β-TPA-PIO as the PS and white light irradiation of 200 mW cm−2 for 15 min at different time points post-treatment in different groups: PBS (light +), β-TPA-PIO (light −) and β-TPA-PIO (light +) groups. Data are shown as mean ± SD (n = 5, *P < 0.05, β-TPA-PIO (light +) groups vs. PBS (light +) group, **P < 0.01, β-TPA-PIO (light +) groups vs. β-TPA-PIO (light −) groups, determined by Student's t test). (E) H&E staining, (F) TUNEL staining, and (G) IHC staining of the tumor sections from mice after treatment. | ||
In order to elucidate the anti-tumor mechanism of β-TPA-PIO in mice, terminal deoxynucleotidyl transferase dUTP nick end labeling (TUNEL) staining and immunohistochemical (IHC) staining are performed on the tumor tissues. As illustrated in Fig. 7E, β-TPA-PIO mediated PDT is found to result in a significantly higher percentage of TUNEL-positive apoptotic cells (green fluorescence) than the control group. The IHC staining assays for the indicators of ER stress or cell death pathways are presented in Fig. 7F and are well consistent with the results from in vitro experiments. It can be observed in the PDT group that the expression of GRP78 and CHOP related to ER stress is apparently enhanced. The significant down-regulation of Bcl-2 and up-regulation of cleaved caspase-3 indicate cell apoptosis. The prominent up-regulation of LC3B implies cell apoptosis. Moreover, Ki-67, a marker for the proliferative activity assay,93 shows extremely low expression. These results reveal that β-TPA-PIO can activate both apoptotic and autophagic signaling pathways of tumor cells under light irradiation and suppress the proliferation signaling pathway, thus inhibiting the growth of tumors synergistically and effectively.
Conclusions
In summary, two isomeric fluorogens with a PIO core, α-TPA-PIO and β-TPA-PIO, are designed, synthesized and characterized. They are demonstrated to undergo the Type I pathway to generate Type I ROS in the presence of substrates, rather than 1O2, both in aqueous media and in vitro. β-TPA-PIO shows much better Type I ROS generation capability than α-TPA-PIO. The experimental and theoretical studies prove that tuning D–A structures to balance CT and LE states is an effective strategy to activate SOC and HFC, thus improving the yield of the triplet state, and that the PIO moiety is conducive to stabilizing an external electron to form a radical ion intermediate. It is rationalized that the efficient ISC and electron-accepting photochemical activity of PSs provide the photophysical and photochemical basis, respectively, of efficient Type I ROS generation, which are meaningful for further design of Type I PSs. In addition, in vitro experiments indicate that α-TPA-PIO and β-TPA-PIO can selectively accumulate in a neutral lipid region, particularly in the ER. In combination with the merits of bright fluorescence, good membrane permeability, high photobleaching resistance and low dark cytotoxicity revealed by biological study, α-TPA-PIO and β-TPA-PIO are competent as PSs for PDT application. The in vitro PDT results confirm that α-TPA-PIO and β-TPA-PIO have high phototoxicity toward HeLa cells, and the more efficient β-TPA-PIO even has ideal antihypoxia activity. The cytological mechanism indicates that by causing photodamage in the neutral lipid region (mainly in ER) of HeLa cells, ROS-based ER stress is triggered, leading to dual cell death modes of apoptosis and autophagy in the PDT process based on β-TPA-PIO. The in-depth in vivo evaluations further demonstrate that the β-TPA-PIO-mediated PDT can provoke ER stress and subsequently activate both apoptotic and autophagic signaling pathways, finally resulting in an effective PDT potency to the solid tumor in vivo. In addition, the ROS-based ER stress triggered by β-TPA-PIO-mediated PDT shows that it has good potential as a precursor of the immunostimulatory effect for immunotherapy. By presenting a comprehensive study protocol on Type I-based purely organic PSs for application in PDT, including photophysical, photochemical and cytological mechanisms, this work provides guidance for the development of new robust PSs to offer more efficient alternatives to conventional PSs for clinical PDT, arousing people's attention to the working mechanism in the design of PSs for the optimization of cancer treatment protocols in combination treatment and personalized medicine.Experimental section
Synthesis of 2-(4-(di(cyclohexa-2,4-dien-1-yl)amino)phenyl)-1-ethoxy-3-(pyridin-4-yl)-1H-phosphindole 1-oxide (α-TPA-PIO)
A mixture of 3 (3.46 g, 10 mmol), ethyl phenylphosphinate (3.40 g, 20 mmol), and Ag2O (4.62 g, 20 mmol) in DMF (60 mL) was stirred at 100 °C for 10 h under nitrogen. After cooling to room temperature, the mixture was passed through a plug of Celite to remove insoluble solids. The filtrate was washed with saturated brine three times and dried over anhydrous MgSO4. After filtration, the solvent was evaporated under reduced pressure, and the residue was purified by column chromatography on silica gel by using petroleum ether/THF (4/1 v/v) as the eluent to afford the product as a yellow solid in 47% yield (2.4 g). 1H NMR (500 MHz, CD2Cl2), δ (TMS, ppm): 8.68 (d, J = 4.5 Hz, 2H), 7.75–7.68 (m, 1H), 7.48–7.38 (m, 2H), 7.30–7.23 (m, 6H), 7.22–7.18 (m, 2H), 7.09–7.03 (m, 6H), 7.00–6.96 (m, 1H), 6.86–6.81 (m, 2H), 4.12–4.02 (m, 2H), 1.30–1.23 (m, 3H). 13C NMR (125 MHz, CD2Cl2), δ (TMS, ppm): 151.0, 148.5, 147.4, 143.7 (d, J = 29.0 Hz), 143.5 (d, J = 18.9 Hz), 141.6 (d, J = 34.0 Hz), 133.6 (d, J = 1.3 Hz), 131.4 (d, J = 123.5 Hz), 130.1 (d, J = 6.5 Hz), 129.8, 129.4 (d, J = 12.6 Hz), 128.1 (d, J = 8.8 Hz), 127.2 (d, J = 133.6 Hz), 125.69, 124.9 (d, J = 8.8 Hz) 124.32, 124.22, 123.5 (d, J = 12.6 Hz), 121.77, 62.69 (d, J = 6.3 Hz), 16.69 (d, J = 6.3 Hz). HRMS (C33H27N2O2P): m/z 514.1780 (M+, calcd 514.1810).Synthesis of 3-(4-(diphenylamino)phenyl)-1-ethoxy-2-(pyridin-4-yl)phosphindole 1-oxide (β-TPA-PIO)
The product was obtained through the procedure described for α-TPA-PIO by using petroleum ether/THF (2/1 v/v) as the eluent in column chromatography. Yellow solid, yield 23% (1.1 g). 1H NMR (500 MHz, CD2Cl2), δ (TMS, ppm): 8.48 (d, J = 5.0 Hz, 2H), 7.77–7.71 (m, 1H), 7.56–7.45 (m, 2H), 7.37–7.33 (m, 1H), 7.31 (m, 6H), 7.17–7.12 (m, 4H), 7.12–7.03 (m, 6H), 4.10–3.97 (m, 2H), 1.26–1.20 (m, 3H). 13C NMR (125 MHz, CD2Cl2), δ (TMS, ppm): 152.3 (d, J = 26.3 Hz), 150.2, 149.3, 147.5, 141.6 (d, J = 33.8 Hz), 141.4 (d, J = 8.8 Hz), 133.5 (d, J = 1.3 Hz), 130.2, 130.1 (d, J = 11.3 Hz), 129.9, 128.1 (d, J = 133.6 Hz), 128.0 (d, J = 8.8 Hz), 127.2 (d, J = 123.5 Hz), 125.9 (d, J = 17.6 Hz), 125.6, 125.0 (d, J = 1.3 Hz), 124.2, 123.7, 122.5, 62.7 (d, J = 6.3 Hz), 16.7 (d, J = 6.3 Hz). HRMS (C33H27N2O2P): m/z 514.1793 (M+, calcd 514.1810).Crystal data of α-TPA-PIO (CCDC 1945773)
C33H27N2O2P, MW = 514.53, triclinic, P![[1 with combining macron]](https://www.rsc.org/images/entities/char_0031_0304.gif) , a = 10.6898(7), b = 11.7750(8), c = 11.9913(7) Å, α = 71.708(2)°, β = 65.4407(19)°, γ = 89.239(2)°, V = 1291.40(15) Å3, Z = 2, Dc = 1.323 g cm−3, μ = 0.141 mm−1 (Mo Kα, λ = 0.71073), F(000) = 540, T = 173(2) K, 2θmax = 25.025° (99.9%), 4543 measured reflections, 4543 independent reflections, GOF on F2 = 1.038, R1 = 0.0899, wR2 = 0.1316 (all data), Δe 0.270 and −0.284 e Å−3.
, a = 10.6898(7), b = 11.7750(8), c = 11.9913(7) Å, α = 71.708(2)°, β = 65.4407(19)°, γ = 89.239(2)°, V = 1291.40(15) Å3, Z = 2, Dc = 1.323 g cm−3, μ = 0.141 mm−1 (Mo Kα, λ = 0.71073), F(000) = 540, T = 173(2) K, 2θmax = 25.025° (99.9%), 4543 measured reflections, 4543 independent reflections, GOF on F2 = 1.038, R1 = 0.0899, wR2 = 0.1316 (all data), Δe 0.270 and −0.284 e Å−3.
Crystal data of β-TPA-PIO (CCDC 1945775)
C33H27N2O2P, MW = 514.53, triclinic, P, a = 9.1957(6), b = 10.8410(7), c = 13.3381(8) Å, α = 100.850(2)°, β = 100.343(2)°, γ = 93.057(2)°, V = 1279.46(14) Å3, Z = 2, Dc = 1.336 g cm−3, μ = 0.142 mm−1 (Mo Kα, λ = 0.71073), F(000) = 540, T = 173(2) K, 2θmax = 25.353° (99.3%), 12![[thin space (1/6-em)]](https://www.rsc.org/images/entities/char_2009.gif) 612 measured reflections, 4637 independent reflections (Rint = 0.0725), GOF on F2 = 1.050, R1 = 0.1091, wR2 = 0.0961 (all data), Δe 0.282 and −0.272 e Å−3.
612 measured reflections, 4637 independent reflections (Rint = 0.0725), GOF on F2 = 1.050, R1 = 0.1091, wR2 = 0.0961 (all data), Δe 0.282 and −0.272 e Å−3.
All animal procedures were performed in accordance with the Guidelines for the Care and Use of Laboratory Animals of the “Huazhong University of Science and Technology” and experiments were approved by the Animal Ethics Committee of “Tongji Hospital, Tongji Medical College of Huazhong University of Science and Technology”.
Conflicts of interest
There are no conflicts to declare.Acknowledgements
This research was supported by the National Natural Science Foundation of China (21788102) and the Natural Science Foundation of Guangdong Province (2019B030301003).Notes and references
- D. E. Dolmans, D. Fukumura and R. K. Jain, Nat. Rev. Cancer, 2003, 3, 380–386 CrossRef PubMed.
- P. Agostinis, K. Berg, K. A. Cengel, T. H. Foster, A. W. Girotti, S. O. Gollnick, S. M. Hahn, M. R. Hamblin, A. Juzeniene, D. Kessel, M. Korbelik, J. Moan, P. Mroz, D. Nowis, J. Piette, B. C. Wilson and J. Golab, CA-Cancer J. Clin., 2011, 61, 250–281 CrossRef PubMed.
- D. V. Straten, V. Mashayekhi, H. S. Bruijn, S. Oliveira and D. J. Robinson, Cancers, 2017, 9, 19 CrossRef PubMed.
- J. D. Chapman, C. C. Stobbe, M. R. Arnfield, R. Santus, J. Lee and M. S. McPhee, Radiat. Res., 1991, 126, 73–79 CrossRef PubMed.
- P. Vaupel and A. Mayer, Cancer Metastasis Rev., 2007, 26, 225–239 CrossRef PubMed.
- Z. Zhou, J. Song, L. Nie and X. Chen, Chem. Soc. Rev., 2016, 45, 6597–6626 RSC.
- A. Curnow, J. C. Haller and S. G. Bown, J. Photochem. Photobiol., B, 2000, 58, 149–155 CrossRef.
- M. Krzykawska-Serda, J. M. Dąbrowski, L. G. Arnaut, M. Szczygieł, K. Urbańska, G. Stochel and M. Elas, Free Radical Biol. Med., 2014, 73, 239–251 CrossRef PubMed.
- J. Liu, W. Bu and J. Shi, Chem. Rev., 2017, 117, 6160–6224 CrossRef PubMed.
- X. Li, N. Kwon, T. Guo, Z. Liu and J. Yoon, Angew. Chem., Int. Ed., 2018, 57, 11522–11531 CrossRef.
- E. M. Camporesi, Undersea Hyperbaric Med., 2014, 41, 253–257 Search PubMed.
- Q. Li, C. Huang, L. Liu, R. Hu and J. Qu, Cytometry, Part A, 2018, 93, 997–1003 CrossRef.
- X. Li, B.-D. Zheng, X.-H. Peng, S.-Z. Li, J.-W. Ying, Y. Zhao, J.-D. Huang and J. Yoon, Coord. Chem. Rev., 2019, 379, 147–160 CrossRef.
- B. W. Henderson and T. J. Dougherty, Photochem. Photobiol., 1992, 55, 145–157 CrossRef.
- K. Plaetzer, B. Krammer, J. Berlanda, F. Berr and T. Kiesslich, Lasers Med. Sci., 2009, 24, 259–268 CrossRef.
- M. S. Baptista, J. Cadet, P. D. Mascio, A. A. Ghogare, A. Greer, M. R. Hamblin, C. Lorente, S. C. Nunez, M. S. Ribeiro, A. H. Thomas, M. Vignoni and T. M. Yoshimura, Photochem. Photobiol., 2017, 93, 912–919 CrossRef.
- J. Davila and A. Harriman, Photochem. Photobiol., 1989, 50, 29–35 CrossRef.
- D. R. Cardoso, D. W. Franco, K. Olsen, M. L. Andersen and L. H. Skibsted, J. Agric. Food Chem., 2004, 52, 6602–6606 CrossRef.
- C. M. Bergamini, S. Gambetti, A. Dondi and C. Cervellati, Curr. Pharm. Des., 2004, 10, 1611–1626 CrossRef.
- I. O. L. Bacellar, T. M. Tsubone, C. Pavani and M. S. Baptista, Int. J. Mol. Sci., 2015, 16, 20523–20559 CrossRef.
- B. Yang, Y. Chen and J. Shi, Chem. Rev., 2019, 119, 4881–4985 CrossRef.
- S. S. Lucky, N. M. Idris, Z. Li, K. Huang, K. C. Soo and Y. Zhang, ACS Nano, 2015, 9, 191–205 CrossRef.
- R. C. Gilson, K. C. L. Black, D. D. Lane and S. Achilefu, Angew. Chem., Int. Ed., 2017, 56, 10717–10720 CrossRef.
- J. S. Nam, M.-G. Kang, J. Kang, S.-Y. Park, S. J. C. Lee, H.-T. Kim, J. K. Seo, O.-H. Kwon, M. H. Lim, H.-W. Rhee and T.-H. Kwon, J. Am. Chem. Soc., 2016, 138, 10968–10977 CrossRef.
- Z. Lv, H. Wei, Q. Li, X. Su, S. Liu, K. Y. Zhang, W. Lv, Q. Zhao, X. Li and W. Huang, Chem. Sci., 2018, 9, 502–512 RSC.
- G. Lan, K. Ni, S. S. Veroneau, X. Feng, G. T. Nash, T. Luo, Z. Xu and W. Lin, J. Am. Chem. Soc., 2019, 141, 4204–4208 CrossRef.
- K. Zhang, Z. Yu, X. Meng, W. Zhao, Z. Shi, Z. Yang, H. Dong and X. Zhang, Adv. Sci., 2019, 6, 1900530 CrossRef.
- R. Docampo, S. Moreno, R. Muniz, F. Cruz and R. Mason, Science, 1983, 220, 1292–1295 CrossRef PubMed.
- K. Reszka, F. S. Cruz and R. Docampo, Chem.-Biol. Interact., 1986, 58, 161–172 CrossRef.
- M. Li, J. Xia, R. Tian, J. Wang, J. Fan, J. Du, S. Long, X. Song, J. W. Foley and X. Peng, J. Am. Chem. Soc., 2018, 140, 14851–14859 CrossRef.
- M. Li, T. Xiong, J. Du, R. Tian, M. Xiao, L. Guo, S. Long, J. Fan, W. Sun, K. Shao, X. Song, J. W. Foley and X. Peng, J. Am. Chem. Soc., 2019, 141, 2695–2702 CrossRef CAS.
- V.-N. Nguyen, S. Qi, S. Kim, N. Kwon, G. Kim, Y. Yim, S. Park and J. Yoon, J. Am. Chem. Soc., 2019, 141, 16243–16248 CrossRef CAS PubMed.
- A. P. Castano, P. Mroz and M. R. Hamblin, Nat. Rev. Cancer, 2006, 6, 535–545 CrossRef CAS.
- N. Maeding, T. Verwanger and B. Krammer, Cancers, 2016, 8, 91 CrossRef.
- S. Nath, G. Obaid and T. Hasan, Photochem. Photobiol., 2019, 95, 1288–1305 CrossRef CAS.
- L. Zitvogel, O. Kepp, L. Senovilla, L. Menger, N. Chaput and G. Kroemer, Clin. Cancer Res., 2010, 16, 3100–3104 CrossRef CAS.
- G. Kroemer, L. Galluzzi, O. Kepp and L. Zitvogel, Annu. Rev. Immunol., 2013, 31, 51–72 CrossRef CAS.
- A. M. Dudek, A. D. Garg, D. V. Krysko, D. De Ruysscher and P. Agostinis, Cytokine Growth Factor Rev., 2013, 24, 319–333 CrossRef CAS.
- C. Chen, X. Ni, S. Jia, Y. Liang, X. Wu, D. Kong and D. Ding, Adv. Mater., 2019, 31, 1904914 CrossRef CAS.
- K. Ni, T. Aung, S. Li, N. Fatuzzo, X. Liang and W. Lin, Chem, 2019, 5, 1892–1913 CAS.
- G. Minotti, P. Menna, E. Salvatorelli, G. Cairo and L. Gianni, Pharmacol. Rev., 2004, 56, 185–229 CrossRef CAS PubMed.
- A. D. Garg, D. V. Krysko, P. Vandenabeele and P. Agostinis, OncoImmunology, 2012, 1, 786–788 CrossRef.
- A. D. Garg and P. Agostinis, Photochem. Photobiol. Sci., 2014, 13, 474–487 RSC.
- W.-H. Chen, G.-F. Luo and X.-Z. Zhang, Adv. Mater., 2019, 31, 1802725 CrossRef PubMed.
- P. Gao, W. Pan, N. Li and B. Tang, ACS Appl. Mater. Interfaces, 2019, 11, 26529–26558 CrossRef CAS.
- M. Lan, S. Zhao, W. Liu, C. Lee, W. Zhang and P. Wang, Adv. Healthcare Mater., 2019, 8, 1900132 CrossRef.
- T. Kiesslich, B. Krammer and K. Plaetzer, Curr. Med. Chem., 2006, 13, 2189–2204 CrossRef CAS PubMed.
- S. Banerjee, A. Dixit, R. N. Shridharan, A. A. Karande and A. R. Chakravarty, Chem. Commun., 2014, 50, 5590–5592 RSC.
- L. Yu, Q. Wang, K.-W. Yeung, W.-P. Fong and P.-C. Lo, Chem.–Asian J., 2018, 13, 3509–3517 CrossRef CAS PubMed.
- J.-S. Ni, M. M. S. Lee, P. Zhang, C. Gui, Y. Chen, D. Wang, Z.-Q. Yu, R. T. K. Kwok, J. W. Y. Lam and B. Z. Tang, Anal. Chem., 2018, 91, 2169–2176 CrossRef PubMed.
- F. Bu, E. Wang, Q. Peng, R. Hu, A. Qin, Z. Zhao and B. Z. Tang, Chem.–Eur. J., 2015, 21, 4440–4449 CrossRef CAS.
- Z. Zhuang, F. Bu, W. Luo, H. Peng, S. Chen, R. Hu, A. Qin, Z. Zhao and B. Z. Tang, J. Mater. Chem. C, 2017, 5, 1836–1842 RSC.
- E. Yamaguchi, C. Wang, A. Fukazawa, M. Taki, Y. Sato, T. Sasaki, M. Ueda, N. Sasaki, T. Higashiyama and S. Yamaguchi, Angew. Chem., Int. Ed., 2015, 54, 4539–4543 CrossRef CAS PubMed.
- Y. Dienes, M. Eggenstein, T. Kárpáti, T. C. Sutherland, L. Nyulászi and T. Baumgartner, Chem.–Eur. J., 2008, 14, 9878–9889 CrossRef CAS PubMed.
- Y. Matano, A. Saito, T. Fukushima, Y. Tokudome, F. Suzuki, D. Sakamaki, H. Kaji, A. Ito, K. Tanaka and H. Imahori, Angew. Chem., Int. Ed., 2011, 50, 8016–8020 CrossRef CAS PubMed.
- T. Baumgartner, Acc. Chem. Res., 2014, 47, 1613–1622 CrossRef CAS PubMed.
- W. Scháfer, A. Schweig and F. Mathey, J. Am. Chem. Soc., 1976, 98, 407–414 CrossRef.
- Y. Matano, T. Miyajima, T. Fukushima, H. Kaji, Y. Kimura and H. Imahori, Chem.–Eur. J., 2008, 14, 8102–8115 CrossRef CAS PubMed.
- Y. Matano and H. Imahori, Org. Biomol. Chem., 2009, 7, 1258–1271 RSC.
- M. Segal, M. Singh, K. Rivoire, S. Difley, T. Van Voorhis and M. A. Baldo, Nat. Mater., 2007, 6, 374–378 CrossRef CAS PubMed.
- R. Hu, E. Lager, A. Aguilar-Aguilar, J. Liu, J. W. Y. Lam, H. H. Y. Sung, I. D. Williams, Y. Zhong, K. S. Wong, E. Peña-Cabrera and B. Z. Tang, J. Phys. Chem. C, 2009, 113, 15845–15853 CrossRef CAS.
- Z. Zhao, B. Chen, J. Geng, Z. Chang, L. Aparicio-Ixta, H. Nie, C. C. Goh, L. G. Ng, A. Qin, G. Ramos-Ortiz, B. Liu and B. Z. Tang, Part. Part. Syst. Charact., 2014, 31, 481–491 CrossRef CAS.
- M. S. Baptista and G. L. Indig, J. Phys. Chem. B, 1998, 102, 4678–4688 CrossRef CAS.
- E. G. A. Owusu, A. J. MacRobert, I. Naasani, I. P. Parkin, E. Allan and E. Yaghini, ACS Appl. Mater. Interfaces, 2019, 11, 12367–12378 CrossRef CAS PubMed.
- K. Setsukinai, Y. Urano, K. Kakinuma, H. J. Majima and T. Nagano, J. Biol. Chem., 2003, 278, 3170–3175 CrossRef PubMed.
- L. M. Henderson and J. B. Chappell, Eur. J. Biochem., 1993, 217, 973–980 CrossRef PubMed.
- M. Wrona, K. Patel and P. Wardman, Free Radical Biol. Med., 2005, 38, 262–270 CrossRef.
- S. L. Hempel, G. R. Buettner, Y. Q. O'Malley, D. A. Wessels and D. M. Flaherty, Free Radical Biol. Med., 1999, 27, 146–159 CrossRef.
- L. Benov, L. Sztejnberg and I. Fridovich, Free Radical Biol. Med., 1998, 25, 826–831 CrossRef.
- J. Zielonka, J. Vasquez-Vivar and B. Kalyanaraman, Nat. Protoc., 2008, 3, 8–21 CrossRef CAS PubMed.
- H. Zhao, J. Joseph, H. Zhang, H. Karoui and B. Kalyanaraman, Free Radical Biol. Med., 2001, 31, 599–606 CrossRef CAS.
- J. P. Tardivo, A. D. Giglio, C. S. Oliveira, D. S. Gabrielli, H. C. Junqueira, D. B. Tada, D. Severino, R. F. Turchiello and M. S. Baptista, Photodiagn. Photodyn. Ther., 2005, 2, 175–191 CrossRef CAS.
- T. Lu and F. Chen, J. Comput. Chem., 2012, 33, 580–592 CrossRef CAS PubMed.
- T. L. Bahers and C. A. Ciofini, J. Chem. Theory Comput., 2011, 7, 2498–2506 CrossRef.
- Multiwfn_manual: Section 3.21.1, see https://sobereva.com/multiwfn Search PubMed.
- M. A. El-Sayed, J. Chem. Phys., 1963, 38, 2834–2838 CrossRef CAS.
- C. M. Marian, Wiley Interdiscip. Rev.: Comput. Mol. Sci., 2012, 2, 187–203 CAS.
- S. Difley, D. Beljonne and T. V. Voorhis, J. Am. Chem. Soc., 2008, 130, 3420–3427 CrossRef CAS PubMed.
- L. Lv, K. Yuan and Y. Wang, Org. Electron., 2018, 52, 110–122 CrossRef CAS.
- A. M. Scott and M. R. Wasielewski, J. Am. Chem. Soc., 2011, 133, 3005–3013 CrossRef CAS PubMed.
- T. Ogiwara, Y. Wakikawa and T. Ikoma, J. Phys. Chem. A, 2015, 119, 3415–3418 CrossRef CAS PubMed.
- T. Lu and F. Chen, J. Theor. Comput. Chem., 2012, 11, 163–183 CrossRef CAS.
- M. Okuda, T. Tsuruta and K. Katayama, Phys. Chem. Chem. Phys., 2009, 11, 2287–2292 RSC.
- K. L. Cook, D. R. Soto-Pantoja, P. A. G. Clarke, M. I. Cruz, A. Zwart, A. Wärri, L. Hilakivi-Clarke, D. D. Roberts and R. Clarke, Cancer Res., 2016, 76, 5657–5670 CrossRef CAS.
- S. J. Marciniak, C. Y. Yun, S. Oyadomari, I. Novoa, Y. Zhang, R. Jungreis, K. Nagata, H. P. Harding and D. Ron, Genes Dev., 2004, 18, 3066–3077 CrossRef CAS.
- S. Cory and J. M. Adams, Nat. Rev. Cancer, 2002, 2, 647–656 CrossRef CAS PubMed.
- A. M. Gown and M. C. Willingham, J. Histochem. Cytochem., 2002, 50, 449–454 CrossRef CAS PubMed.
- I. Tanida, T. Ueno and E. Kominami, Int. J. Biochem. Cell Biol., 2004, 36, 2503–2518 CrossRef PubMed.
- G. Juhasz and T. P. Neufeld, PLoS Biol., 2006, 4, e36 CrossRef PubMed.
- M. Hayashi-Nishino, N. Fujita, T. Noda, A. Yamaguchi, T. Yoshimori and A. Yamamoto, Nat. Cell Biol., 2009, 11, 1433–1437 CrossRef PubMed.
- M. Mehrpour, A. Esclatine, I. Beau and P. Codogno, Cell Res., 2010, 20, 748–762 CrossRef.
- J. J. Reiners, P. Agostinis, K. Berg, N. L. Oleinick and D. H. Kessel, Autophagy, 2010, 6, 7–18 CrossRef PubMed.
- M. Sobecki, K. Mrouj, J. Colinge, F. Gerbe, P. Jay, L. Krasinska, V. Dulic and D. Fisher, Cancer Res., 2017, 77, 2722–2734 CrossRef CAS PubMed.
Footnote |
| † Electronic supplementary information (ESI) available: General information, ROS generation measurement, cell experiments, NMR and mass spectra, absorption and photoluminescence spectra, particle size distribution, calculated absorption spectra, NTOs and atomic contribution to holes and electrons of the transition, fluorescence cell images, colocalization images, photobleaching resistance assay, live/dead cell co-staining assay, and tables of photophysical data and calculated parameters. CCDC 1945773 and 1945775. For ESI and crystallographic data in CIF or other electronic format see DOI: 10.1039/d0sc00785d |
| This journal is © The Royal Society of Chemistry 2020 |