
 Open Access Article
 This Open Access Article is licensed under a
 Creative Commons Attribution 3.0 Unported Licence
Phase dependent encapsulation and release profile of ZIF-based biocomposites†
F.
Carraro
 a,
M. de J.
Velásquez-Hernández
a,
E.
Astria
a,
W.
Liang
b,
L.
Twight
a,
C.
Parise
acd,
M.
Ge
e,
Z.
Huang
e,
R.
Ricco
a,
X.
Zou
e,
L.
Villanova
f,
C. O.
Kappe
c,
C.
Doonan
*b and
P.
Falcaro
*ab
a,
M. de J.
Velásquez-Hernández
a,
E.
Astria
a,
W.
Liang
b,
L.
Twight
a,
C.
Parise
acd,
M.
Ge
e,
Z.
Huang
e,
R.
Ricco
a,
X.
Zou
e,
L.
Villanova
f,
C. O.
Kappe
c,
C.
Doonan
*b and
P.
Falcaro
*ab
aInstitute of Physical and Theoretical Chemistry, Graz University of Technology, Stremayrgasse 9, Graz 8010, Austria. E-mail: paolo.falcaro@tugraz.at
bDepartment of Chemistry and the Centre for Advanced Nanomaterials, The University of Adelaide, Adelaide, South Australia 5005, Australia
cInstitute of Chemistry, University of Graz, NAWI Graz, Heinrichstrasse 28, 8010 Graz, Austria
dDipartimento di Chimica Industriale “Toso Montanari”, Universita' di Bologna, Viale del Risorgimento 4, Bologna, Italy
eDepartment of Materials and Environmental Chemistry, Stockholm University, 106 91 Stockholm, Sweden
fFaculty of Technical Chemistry, Chemical and Process Engineering, Biotechnology, Graz University of Technology, Petersgasse 10-12, 8010 Graz, Austria
First published on 13th February 2020
Abstract
Biocomposites composed of Zeolitic Imidazolate Frameworks (ZIFs) are generating significant interest due to their facile synthesis, and capacity to protect proteins from harsh environments. Here we systematically varied the composition (i.e. relative amounts of ligand (2-methylimidazole), metal precursor (Zn(OAc)2·2H2O), and protein) and post synthetic treatments (i.e. washes with water or water/ethanol) to prepare a series of protein@ZIF biocomposites. These data were used to construct two ternary phase diagrams that showed the synthesis conditions employed gave rise to five different phases including, for the first time, biocomposites based on ZIF-CO3-1. We examined the influence of the different phases on two properties relevant to drug delivery applications: encapsulation efficiency and release profile. The encapsulation efficiencies of bovine serum albumin and insulin were phase dependent and ranged from 75% to 100%. In addition, release profiles showed that 100% protein release varied between 40 and 300 minutes depending on the phase. This study provides a detailed compositional map for the targeted preparation of ZIF-based biocomposites of specific phases and a tool for the straightforward analysis of the crystalline phases of ZIF based materials (web application named “ZIF phase analysis”). These data will facilitate the progress of ZIF bio-composites in the fields of biomedicine and biotechnology.
Introduction
Metal–Organic Frameworks (MOFs) are a class of extended materials synthesized via a modular approach from inorganic (metal clusters or ions) and organic components that typically possess high surface areas and pore volumes.1 By carefully selecting the framework building units and reaction conditions, the chemistry, porosity and particle size of MOFs can be precisely controlled. These properties have attracted researchers to explore MOFs, and their composites, for a variety of applications including biomedicine.2 For example, MOF particles have shown unprecedented properties for the uptake and release of synthetic drugs,3,4 and more recently have been integrated with fragile biotherapeutics5,6 to improve their stability.7,8Recently, Zeolitic Imidazolate Frameworks (ZIFs)9,10 were used to encapsulate biomacromolecules and to form bio-active composites.11–16 The most explored ZIF material for the encapsulation of bioentities is ZIF-8 which is composed of Zn2+ cations and 2-methylimidazole (HmIM). ZIF-8-based biocomposites form spontaneously in water around negatively charged biomacromolecules without any additives.17 This specific process has been termed biomimetic mineralization due to its broad similarities to naturally occurring biomineralization.11,18,19 The ZIF matrix has been shown to protect fragile biomacromolecules and assemblies thereof (e.g. viruses and living cells) from conditions that typically lead to loss of their activity and also act as a vector for in vitro and in vivo delivery.11,12,15,19–23 With respect to drug delivery applications, the biomimetic mineralization approach yields high encapsulation efficiencies (EE%) for biomacromolecules, typically ranging from 80% to 100%.11,18,21 In general, high EE% values are relevant to drug delivery applications as the therapeutic is the valuable component of the composite.18 Release of the biomolecules is achieved via decomposition of the ZIF-8 matrix at pH values < 6.5, in the presence of chelating agents (e.g. ethylenediaminetetraacetic acid, EDTA), or in specific buffer solutions (e.g. phosphate-buffered saline, PBS).18,24,25
ZIF-8 is a crystalline microporous material with sodalite (sod) topology that is synthesized by mixing aqueous solutions of HmIM and Zn2+.26–28 However, by varying the synthetic conditions, other topologies can be obtained (e.g. diamondoid (dia), katsenite (kat), ZIF-L).29–33 Similarly, for ZIF-based biocomposites, a variety of topologies can be accessed by modulating the reaction conditions.19,34 In these studies, a fixed amount of biomacromolecule was employed while the concentrations of the ZIF components were varied. Thus, the network topology was controlled by the relative amount of ligand and cation. In a subsequent study we observed that increasing the biomolecule concentration (i.e. carbohydrates) and maintaining a fixed HmIM: Zn2+ ratio also led to a change in topology from dia to sod.18
This was most likely due to the dependence of sugar concentration on the pH of the reaction solution as the final solid ZIF product did not contain any carbohydrate. In addition to varying the relative concentration of the ZIF components and biomacromolecules, we have also found that post synthesis treatments (e.g. washing procedure) can trigger phase transitions.18,34
Though the various ZIF topologies share the same chemical connectivity, they can exhibit vastly different physical and chemical properties. For example, ZIF (sod) has an accessible porosity of ca. 1800 m2 g−1,28 while ZIF (dia) is non porous to N2.32 In addition, each topology possesses a distinct density and surface chemistry which influences their chemical stability.35,36 Accordingly, for biomedical applications, such as drug delivery, we posit that the precise control of topology is critical for the design of a carrier with specific release profiles. In this present work, for the first time, we systematically explored how the combination of the ratio of ZIF components, biomolecule concentration and washing procedure determines the structural phase of the biocomposite.
Here, we screened 36 compositions varying the weight fractions of HmIM, Zn(OAc)2·2H2O, and Bovine Serum Albumin (BSA). BSA was selected as a model biomacromolecule since it has been widely employed in the literature as a standard inexpensive protein for the preparation of biocomposites.37–39 The washing procedure was carried out using either water only or water and ethanol. The resulting solids were analysed by X-ray diffraction (XRD) and their topologies represented in ternary phase diagrams namely TD-H2O (water washed) and TD-EtOH (water and ethanol washed). A noteworthy result of this study is that we identified proteins encapsulated within ZIF-CO3-1, a ZIF previously obtained using solvothermal synthesis in absence of biomacromolecules.40 For each distinct phase: amorphous, U13, sodalite, diamondoid, and ZIF-CO3-1 (here referred as am, U13, sod, dia and ZIF-C, respectively) we selected and characterised a representative sample using scanning electron microscopy (SEM), vibrational spectroscopy (Fourier Transformed Infrared, FTIR, and Raman), and energy-dispersive X-ray spectroscopy (EDX).
Given the potential application of these biocomposites to drug delivery, for each identified phase we determined the encapsulation and release profiles of BSA and insulin (a clinical bio-therapeutic). Our results show that each biocomposite has high encapsulation efficiency EE% and a distinct release profile. These data will inform and facilitate future research in the burgeoning area of MOF-based drug delivery.
Results and discussion
To explore the entire space of the variables, we selected compositions that were equally distributed within the phase diagram (see Fig. S1 in ESI†).We prepared 36 different samples by varying the composition of zinc acetate, HmIM and BSA (each restricted to a mass fraction range of 10–80%, see Fig. S1 and Table S1 in ESI†) in a fixed volume of water (2 mL, see ESI† for Experimental details) and examined their topology via XRD.
After mixing, the different solutions were left to stand at room temperature for 24 h. From each of the 36 vials, the solid was separated via centrifugation and divided in two parts. One part was washed with deionised (DI) water only and the other was washed with water and ethanol. The samples were then air dried and investigated by X-ray diffraction (XRD). The resultant phases are reported in the ternary diagrams that relate each polymorph to the relative composition of Zn(OAc)2·2H2O, HmIM, and BSA in the synthesis solution. Fig. 1a and b show the ternary diagrams of the samples washed with DI water (TD-H2O) and with DI water and ethanol (TD-EtOH), respectively. Specific details related to the washing procedures and measurement conditions are reported in ESI.†
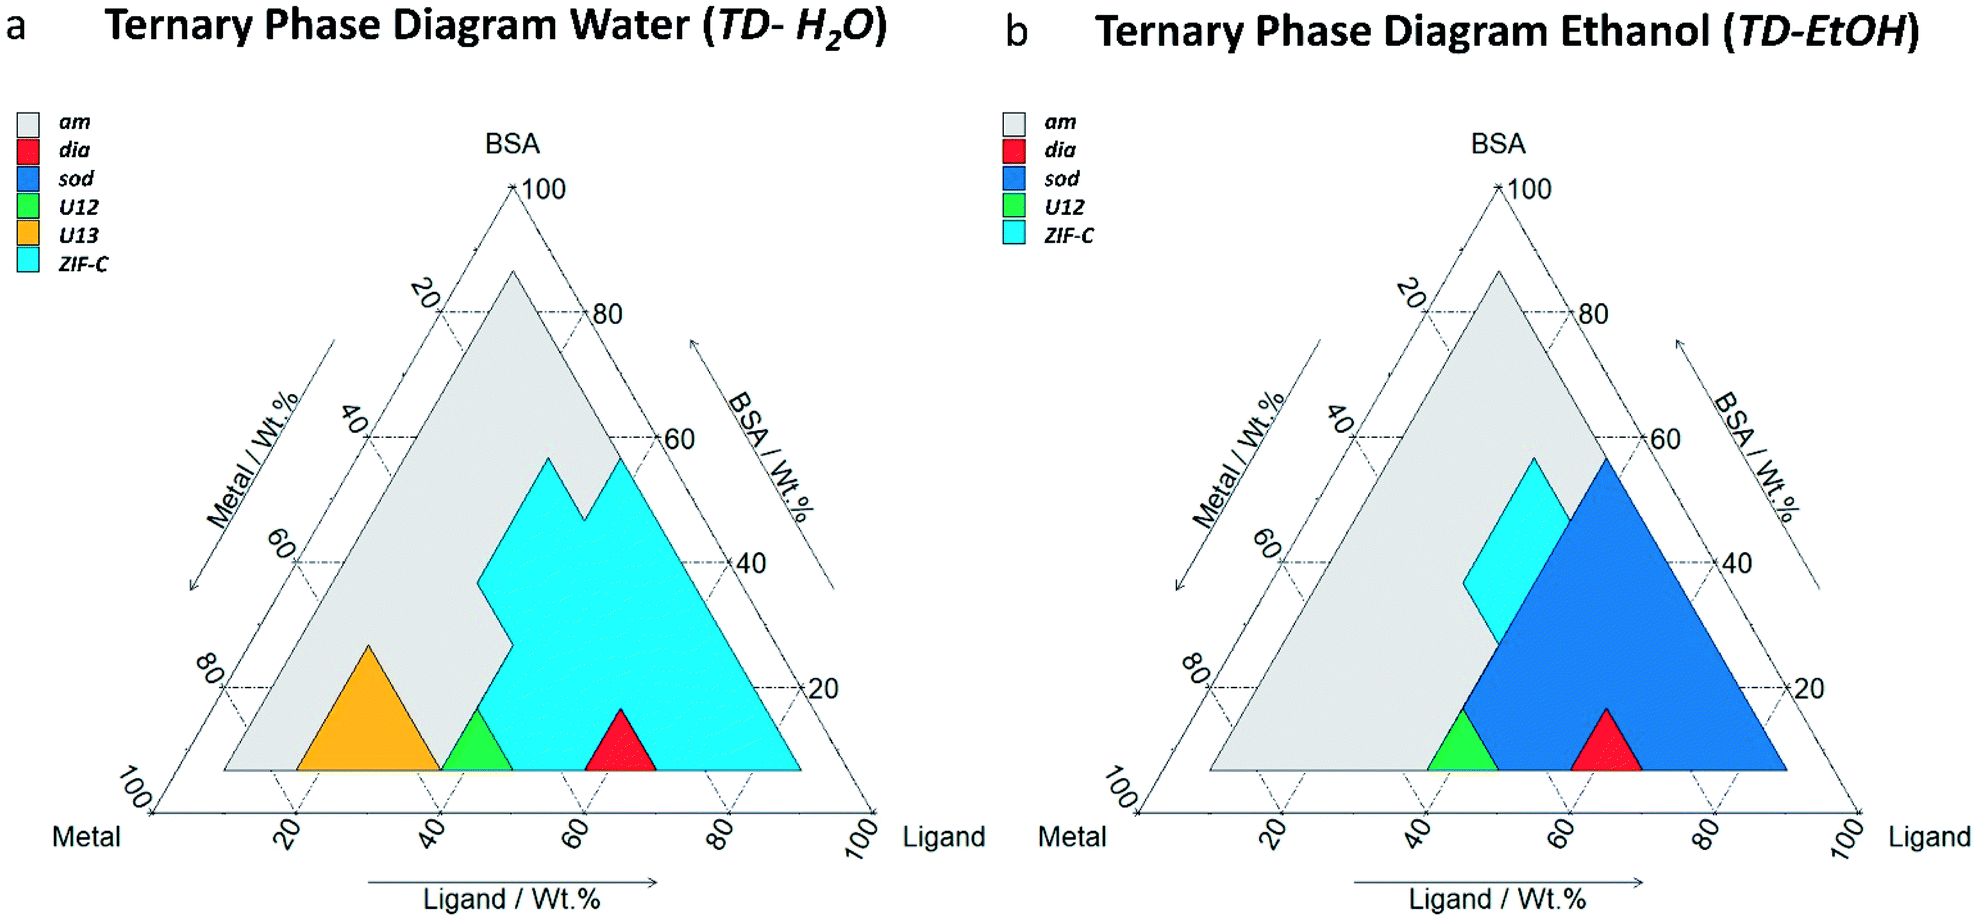 | ||
| Fig. 1 Ternary diagrams (by weight fraction, see Table S1† for details) of BSA, HmIM (labelled as ligand) and Zn(OAc)2·2H2O (labelled as metal). TD-H2O (a) represents the main phases (>50% wt, see Table S2† for details) obtained by washing the sample with DI water. TD-EtOH (b) represents the main phases (>50% wt, see Table S3† for details) obtained by washing the sample first with DI water and then with ethanol. The total mass of the reagent was chosen by selecting a value in between those previous reported in the literature (see ESI† for further details).11,34 | ||
When powders were washed only with DI water (TD-H2O) we observed the formation of an amorphous product (am) for small mass fractions of HmIM (10–20%). However, increasing HmIM to 20–30% while keeping BSA ≤ 20%, we found crystalline patterns dominated by a phase we have previously identified as U13.34 Moving towards lower mass fractions of Zn2+ (10%), we measured amorphous diffraction patterns until BSA exceeded 50%. The remaining mass fraction ratios yielded diffraction patterns attributed to ZIF-C (Fig. 1a, S1 and Table S2 in ESI†). This was confirmed by continuous rotation electron diffraction (cRED, Fig. 2a, see ESI† for further details), which is a specialized technique for the structural determination of nanocrystals.41,42ZIF-C is a high density framework (Fig. 2b) non porous to N2 (see Fig. S3, ESI†), that is prepared using solvothermal conditions (DMF/H2O, 140 °C)40 and not observed as a component of a biocomposites until this work. In a limited number of samples, ZIF-C was found mixed with previously reported patterns termed U12, U13, and dia topology.34
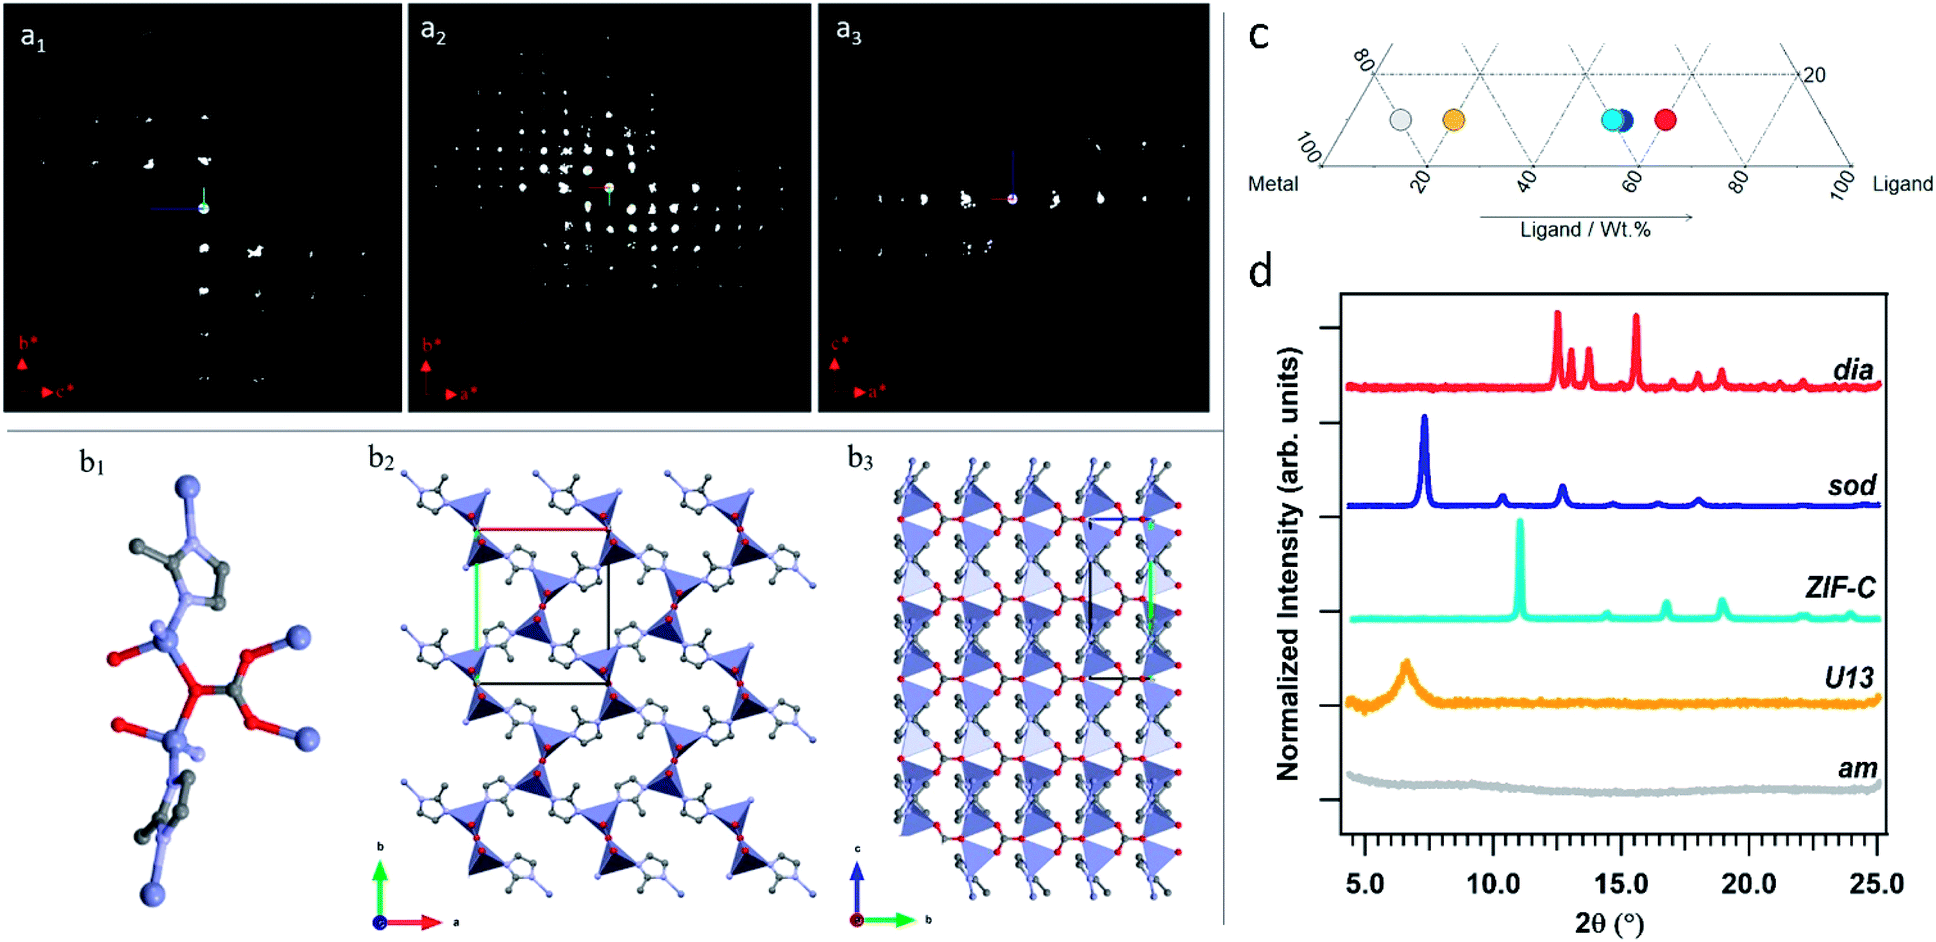 | ||
| Fig. 2 2D slice cuts from the reconstructed 3D reciprocal lattice show the 0kl (a1) hk0 (a2) and h0l (a3) planes. The scattering background (see Fig. S2†) was removed for clarification. Structure of ZIF-CO3-1: (b1) coordination mode of Zn; (b2) framework viewed along the c axis; (b3) framework structure viewed along the a axis. The Zn, O, N and C atoms are shown in blue, red, light blue and grey, respectively. (c) Section of the ternary diagram to highlight the samples selected as representative of the different phases (grey spot: amorphous biocomposite (TD-H2O); yellow spot: U13 (TD-H2O); azure: ZIF-C (TD-H2O); blue: sod (TD-EtOH); red: dia (TD-EtOH)). The ZIF-C and sod samples were obtained with the same protocol, but with different washing procedures (TD-H2O and TD-EtOH, respectively). (d) XRD patterns of the amorphous biocomposite and of the biocomposites with dia, sod, ZIF-C topologies, and U13. | ||
The TD-EtOH diagram indicates that ethanol washing gives rise to phase transitions: U13 is no longer present and all the other samples with ZIF-C are partially or totally converted into sod, with the exception of the dia/ZIF-C mixed phase (TD-H2O BSA/HmIM/Zn2+ = 10%/60%/30%) that transforms into dia. Furthermore, U12 is converted to a mixture of 3 phases (U12, sod, ZIF-C). Lastly, for all samples with mass fraction = 10% of Zn2+ and HmIM ≥ 40% we measured pure sod. We observed diffraction patterns (i.e. crystalline) only for ca. wtHmIM ≥ 30%, thus TD-EtOH confirms the important role of HmIM for the preparation of a crystalline material.
Combined, TD-H2O and TD-EtOH show the presence of 5 different phases (am, sod, dia, U13, ZIF-C) in their pure form or as compositions of phases (see Tables S2 and S3 ESI†). It is well known that the physical and chemical properties of ZIFs are dependent on their phase,32,43,44 thus we were motivated to examine the biomolecule encapsulation and release profiles of each biocomposite. However, first, we characterised each material by XRD, FTIR and Raman Spectroscopies, their elemental distribution via EDX and morphologies by SEM. In addition, given that biopharmaceuticals are the most expensive component of a drug delivery system45–47 we selected a biocomposite with a fixed 10 wt% of protein. Moving along this mass fraction we prepared the 5 different phases shown in Fig. 2c. The diffraction patterns plotted in Fig. 2d are univocally assigned to dia, sod, ZIF-C and U13 (see Fig. S4, ESI†). For am the disordered state is confirmed by the absence of reflections. To facilitate the progress of Zn-mIM bio-composites towards biomedicine and biotechnology, we have developed a web application (https://rapps.tugraz.at/apps/porousbiotech/ZIFphaseanalysis/) named ZIF phase analysis. By uploading diffraction patterns collected using Cu Kα radiation, this web application allows for (1) a rapid identification of the crystalline phases, and (2) a rough estimation of the relative amounts (wt%). The web application was developed using the statistical software R – shiny package.48 Additional information can be found in ESI.†
To assess the connectivity and chemical composition of the bio-composites, we examined powder samples of am, dia, sod, U13 and ZIF-C using vibrational spectroscopy (Fig. 3). Analysis of the FTIR data confirms the presence of characteristic modes of the peptide backbone of BSA such as the amide I (1700–1610 cm−1) and amide II (1595–1480 cm−1) bands.49,50 The spectra of am and U13 did not show vibrational modes that could be attributed to the imidazolate ligand. Furthermore, the vibrational mode at ca. 420 cm−1, assigned to the Zn–N stretching mode, is missing in the selected am and U13 samples. This confirms that am and U13 are not Zn(mIM)2-based polymorphs. Conversely, the spectra of sod, dia and ZIF-C show several bands (420, 690, 752, 998, 1145, 1175, 1308, 1419, 1458, 1580 cm−1) typically observed for sod-Zn(mIM)2.31,34,51 The spectrum of ZIF-C shows additional bands in the 700–850 and 1300–1400 cm−1 regions that can be assigned to bending and asymmetric stretching modes of CO32−.40 Moreover, the Zn–N stretching mode is slightly shifted from 421 to 427 cm−1; we posit this is due to the different Zn-mIM coordination environment with respect to sod or dia topologies. The Raman spectra (160–1800 cm−1) of the same samples are reported in Fig. 3b. The sod and dia topologies show the typical Raman fingerprint of sod.52,53 For both sod and dia, the main bands are assigned to methyl bending (1459 cm−1), C5–N stretching (1147 cm−1), imidazole ring puckering (690 cm−1) and Zn–N stretching (178 and 278 cm−1).52,53 Comparing the Raman spectra of ZIF-C to sod, small differences can be observed at 1466 cm−1 (assigned to imidazole ring puckering and to methyl bending) and 1097 cm−1 (assigned to CO32− stretching mode).52–54 These data support the different Zn-mIM coordination environment. In all the three crystalline Zn(mIM)2 phases (sod, dia, ZIF-C) we could confirm the presence of BSA (1550–1720 cm−1, amide I).55 For am and U13 the vibrational modes of BSA dominate the spectra with broad bands assigned to amide I (1600–1700 cm−1), amide III (1300–1350 cm−1) and –CH deformation (1445 cm−1).55 The broad band at 400 cm−1 could be attributed to Zn–O stretching. This indicates potential for zinc protein interactions.56 The elemental composition of the biocomposites estimated by EDX shows a Zn content of ca. 5 wt% in the case of sod. This value increases to ca. 15% for am and ca. 18% for U13 (details can be found in ESI, Fig. S5 and Table S5†), suggesting that am and U13 are mainly composed of Zn and BSA. We note that Zn2+ cations and BSA have been shown to form solid particles.57,58 Next, we investigated the morphology of the different phases by SEM (Fig. 4). For the water washed samples, very small particles of indistinguishable morphology were observed for am (Fig. 4a). While for U13 the image shows spherical particles, and for dia-Zn(mIM)2 and ZIF-C aggregates of plates 2–3 μm in size (Fig. 4b, d and e, respectively). For the ethanol washed sample, the particle size was reduced to less than 100 nm (Fig. 4c, f and S6, ESI†), with the exception of U13. In this case, a similar particle morphology is observed despite the phase transition to am (Fig. S7, ESI†). We hypothesise that the particle size change is due to a combination of the crystalline network rearrangement and the collapse of the polycrystalline clusters induced by the different surface tension during the ethanol wash.59,60
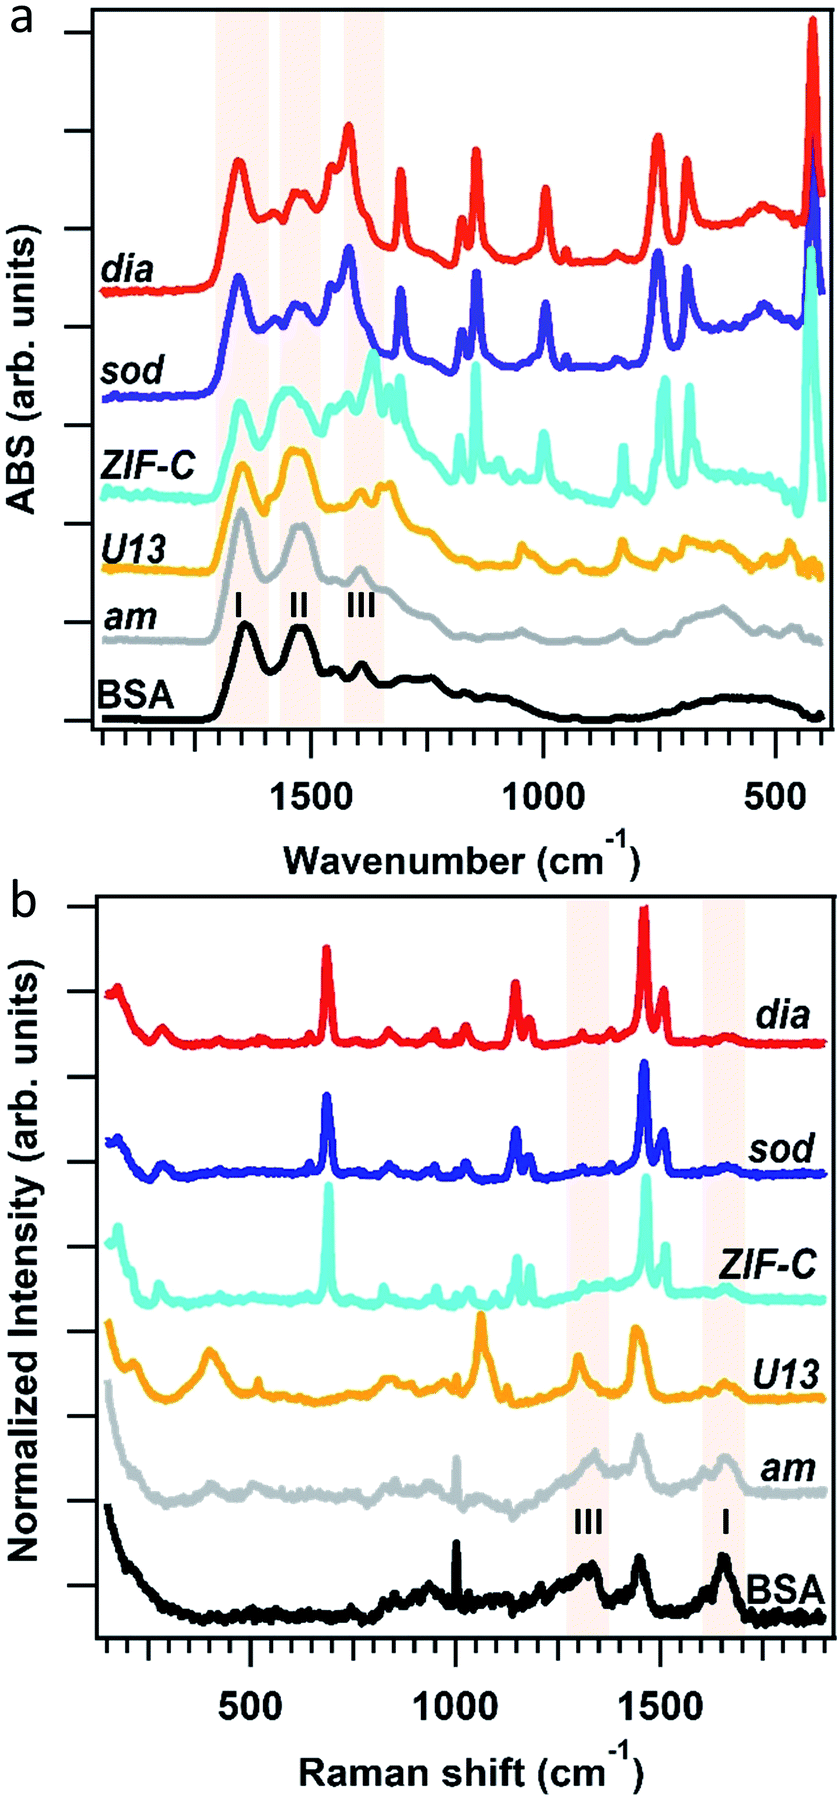 | ||
| Fig. 3 FTIR (a) and Raman (b) spectra of BSA, the biocomposites with am, dia, sod, U13 and ZIF-C phases. The spectral regions of Amide I, II and III bands of BSA are highlighted in light pink. | ||
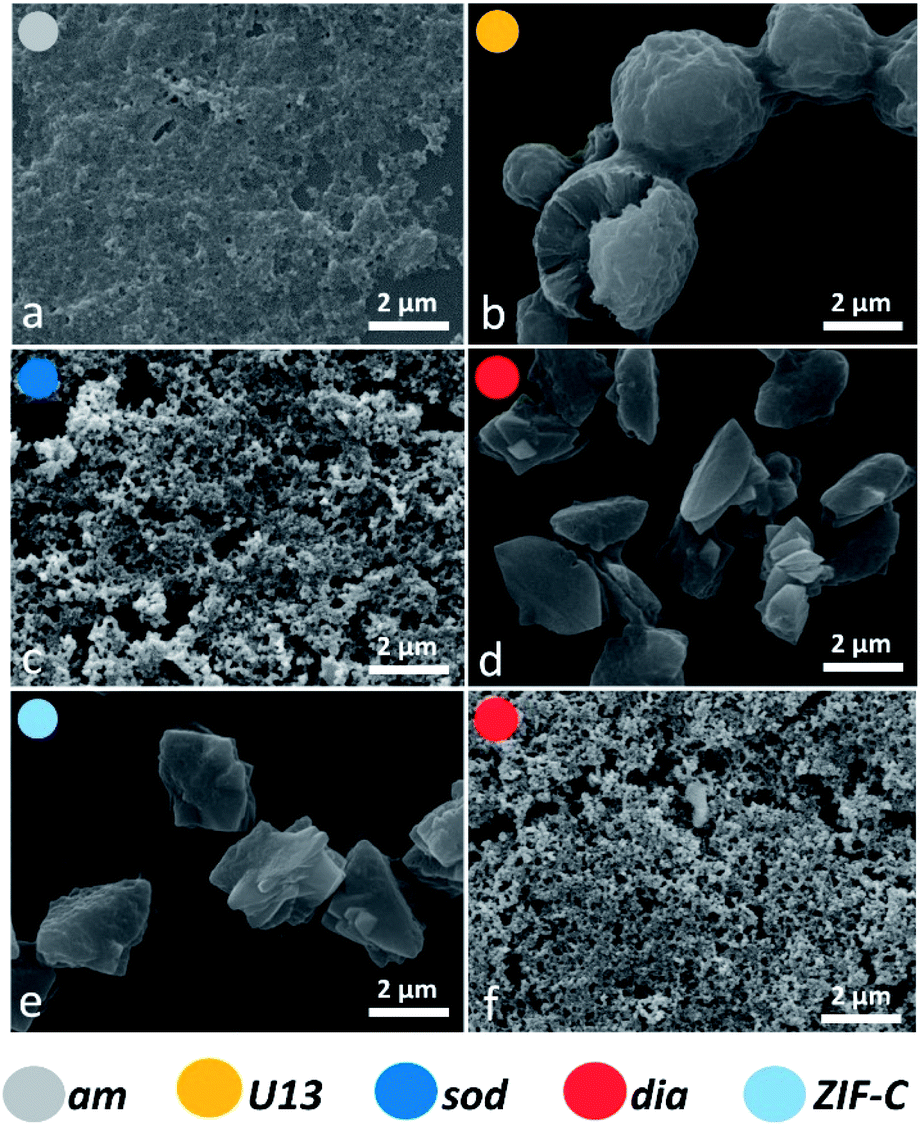 | ||
| Fig. 4 SEM micrographs of the biocomposites am (a) and U13 (b, from TD-H2O), sod (c, from TD-EtOH), dia (from TD-H2O (d) and from TD-EtOH (f)) and ZIF-C (e, from TD-H2O) phases. ZIF-C refers to ZIF-CO3-1.40 | ||
We then turned our efforts to investigate the potential of using the 5 biocomposites am, U13, sod, dia, and ZIF-C as drug delivery systems. Initially BSA was employed as a model bio-therapeutic.61,62 For each sample a 10% mass fraction of BSA was employed in the synthesis (vide supra) and two important properties of a drug carrier were assessed: EE% and release profile.63–65 The estimated EE% (average of five independent analyses) for the different phases is shown in Fig. 5a. For each phase, high EE% values were observed (EE% > 85%) and, remarkably, dia, sod and ZIF-C topology showed a 100% EE%. Details can be found in ESI†.
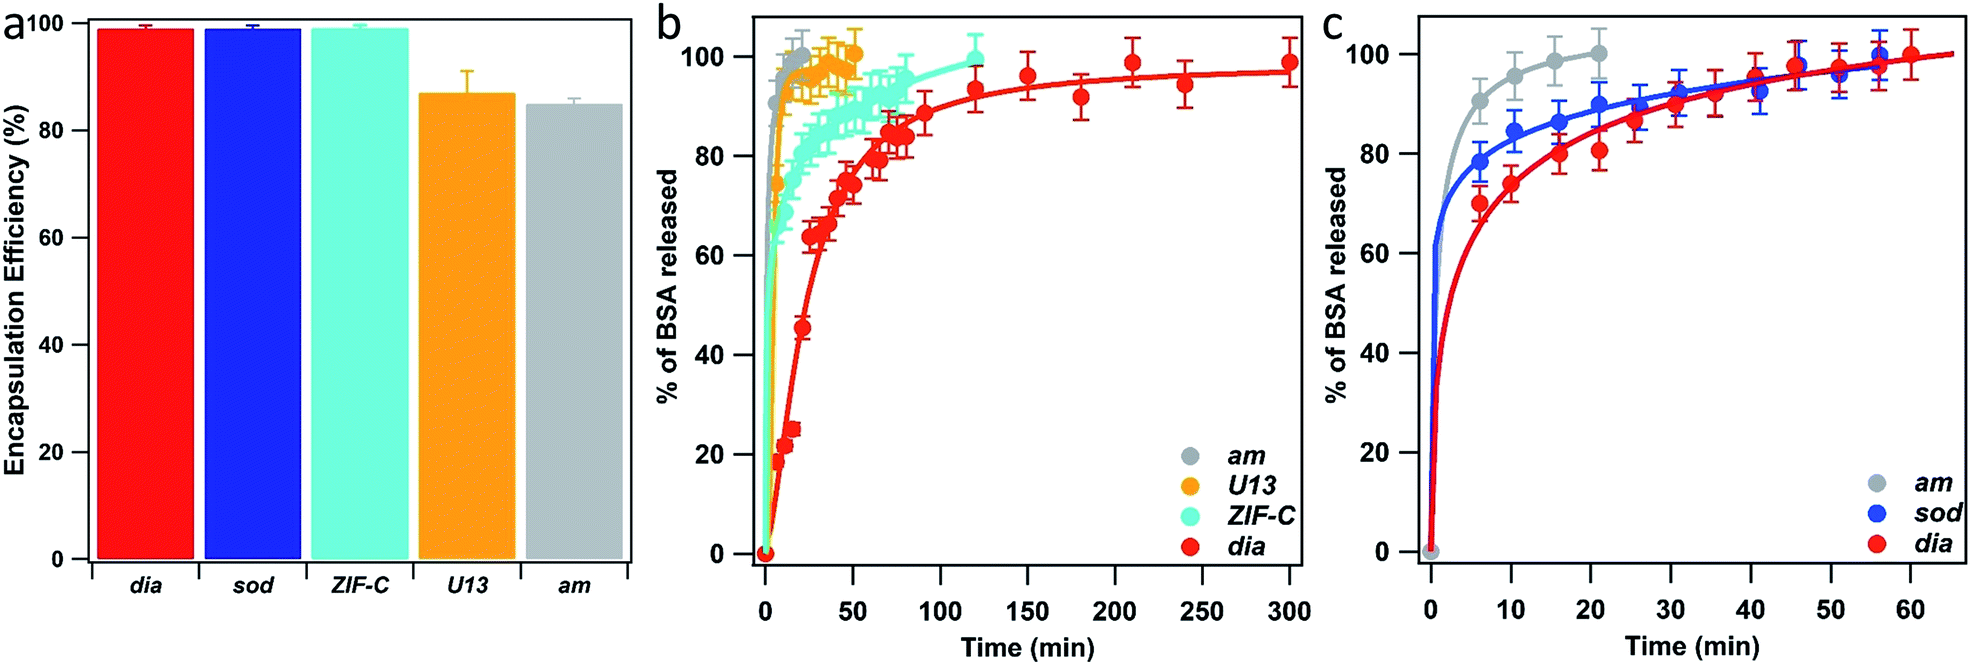 | ||
| Fig. 5 BSA encapsulation efficiency (EE%) (a) and BSA release profiles (from TD-H2O (b) and from TD-EtOH (c)) of the biocomposites with am, U13, sod, dia and ZIF-C phases. ZIF-C refers to ZIF-CO3-1.40 | ||
BSA release profiles were investigated to ascertain the quantity of protein released over time. As our study focuses on the examination of the crystalline phases and their properties rather than targeting a specific administration route, we examined release profiles at pH 5.5 as these conditions facilitate release of the cargo and simplifies a comparison between the different ZIF based particles. However, we note that different pH values will lead to different release profiles. The dissolution of each biocomposite was performed by exposing 1.08 mg of each phase to citric acid buffer solution (1 mL, 100 mM, pH 5.5, room temperature). We used UV-Vis and the Bradford Assay (see ESI† for details) to measure the amount of BSA in solution over time (see ESI† for details), and the release profiles are plotted in Fig. 5b and c. The experimental data points were fitted with a logistic fitting function66 which has previously been employed in the literature for the analysis of data related to the dissolution of different hydrophobic carries, including ZIF-8.18,67,68 Among the biocomposites washed only with water, am and U13 showed the fastest dissolution: in 20 minutes, 100% of the encapsulated BSA was released (see ESI†) and the slowest release was measured for the dia topology: 100% of protein release was reached after 250 minutes. Whilst ZIF-C released 100% of the protein in 120 min. With respect to the ethanol-washed samples, am showed rapid release, ca. 20 min, and similar to the water washed samples, the slowest release was measured for the biocomposite of dia topology. However, in this case the release was significantly faster; 100% was observed in 60 minutes (compared to 250 min for the water washed samples). The different dissolution times observed for biocomposites of the same phase (e.g.dia) can be attributed to particle size. However, when comparing the release profiles of topologically different particles the phase appears to play a dominant role. Thus, we can conclude that both the crystalline phase and the particle size play a crucial role in the design of MOF carriers for drug delivery applications.
To explore the potential biomedical applications of these biocomposites for the delivery of therapeutics we determined the release profiles of insulin encapsulated within the same 5 phases as studied for BSA. XRD data confirmed the expected phases (see Fig. S8, ESI†). However, for the dia phase an impurity of sod was present (15 wt%). The morphology of insulin biocomposites were investigated via SEM (Fig. S9 ESI†). The U13 samples formed large micrometer sized star-like aggregates. Insulin@ZIF-C is composed of both micrometer sized aggregates and small particles (<100 nm). We note the micrometer particles are of analogous morphology to the BSA@ZIF-C particles. Similar to BSA@dia, insulin@dia is composed of small particles (<100 nm). The insulin@sod particles are composed of aggregates of small nanoparticles (100–200 nm). As expected, the insulin-based biocomposites (Fig. S10 ESI†) afford similar FTIR spectra to those of the BSA. For the samples with dia, sod and ZIF-C topology we measured 93, 88 and 94% of insulin EE%, respectively (Fig. 6a). The lowest value was found for U13 sample (EE% = 75%). Then, we tested the insulin release profiles (Fig. 6b and c). Among the crystalline water washed samples, the U13 biocomposite showed the fastest release: in the first 40 minutes 100% of the encapsulated insulin was released. The slowest release was measured for the sample that possesses ZIF-C topology: the insulin release is 50% in 60 min and 100% in 200 min. Among the ethanol washed crystalline samples, U13 showed the fastest release and a profile comparable to the water washed U13 sample. The slowest release was measured for the sample that possesses dia topology: 100% of release was reached in 300 minutes. The sample that possesses sod topology showed an intermediate release profile (100% of insulin released in 220 minutes). In the context of insulin delivery systems, transdermal delivery is being explored as a less invasive method of administration.69 The measured cargo release times from ZIF-based biocomposites are similar to previously reported transdermal delivery systems.70,71 The difference in the release profiles from BSA and insulin suggests that the chemical nature, charge, and size of the protein could influence defects in the biocomposites.
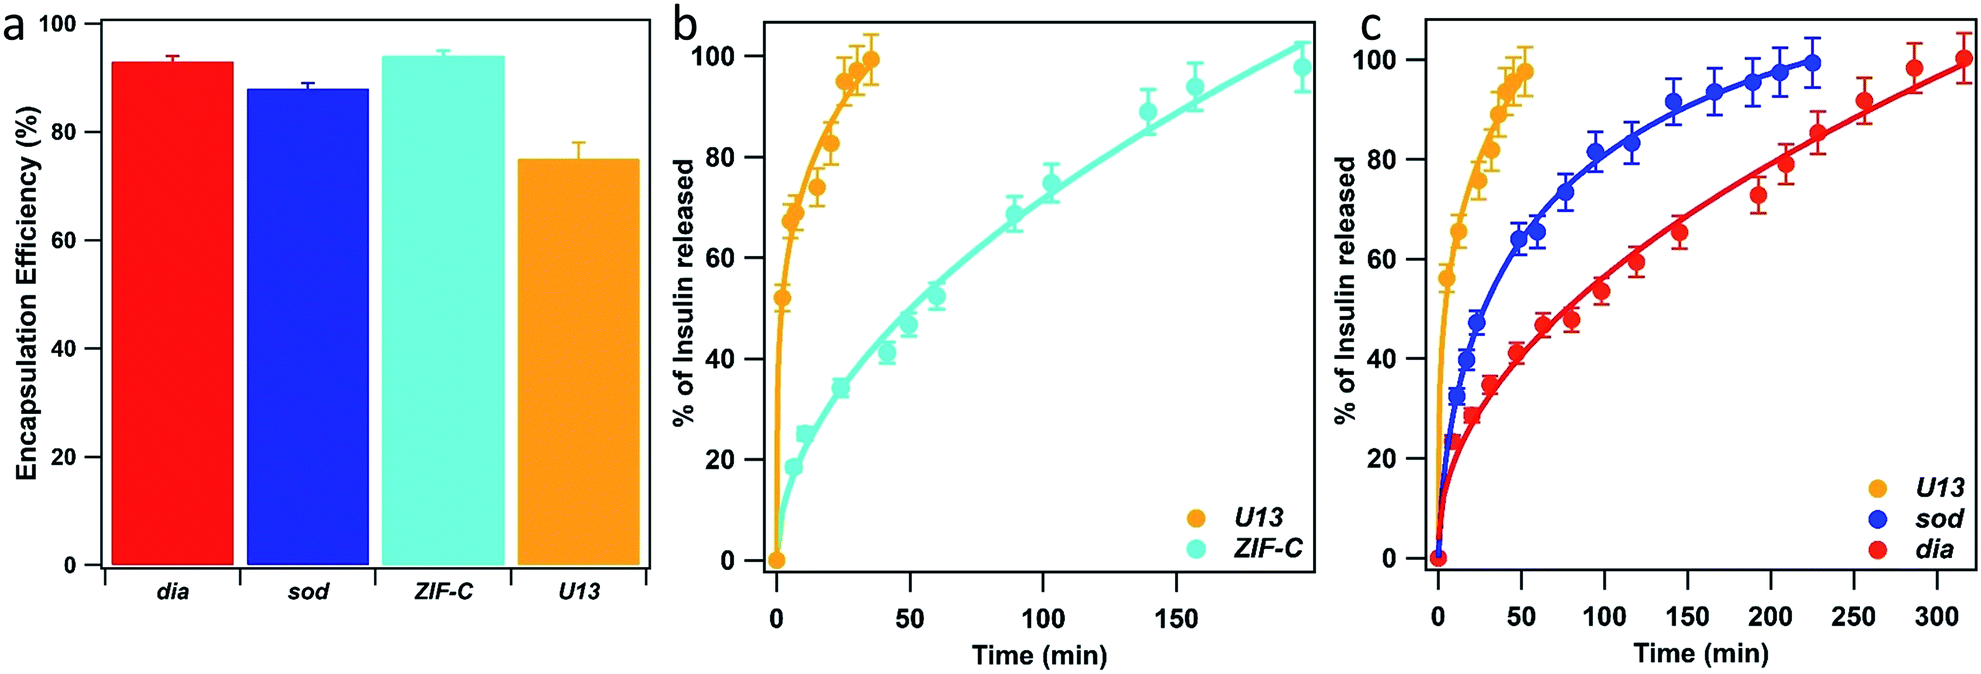 | ||
| Fig. 6 Insulin encapsulation efficiency (EE%) (a) and Insulin release profiles of the biocomposites with U13 and ZIF-C phases (b, water washed samples) and U13, sod and dia (c, EtOH washed samples) phases. ZIF-C refers to ZIF-CO3-1.40 | ||
To further validate the relevance of BSA ternary diagrams as a guide for the synthesis of other systems, we prepared a series of horseradish peroxidase (HRP) biocomposites. Analogous to BSA and insulin-based biocomposites, XRD data confirmed the presence of am, U12, ZIF-C and sod phases for the selected compositions (Fig. S11 ESI†). Although analogous synthetic conditions yielded to biocomposites with the same crystalline phases for BSA, insulin, and HRP, we hypothesise that the intrinsic heterogeneity of proteins (e.g. isoelectric point, hydrophobicity) could lead to deviations from the here proposed trend.
Conclusion
We investigated the dependence of the crystal phases on the mass fraction of precursors (BSA or insulin, Zn(OAc)2·2H2O, HmIM) and the washing procedure (water or ethanol). For BSA we prepared 36 samples, washed only with water; the crystal phases were used to plot a ternary phase diagram (TD-H2O). More than 40% of the samples were found to be amorphous and the remaining samples where crystalline and non-porous (dia, U13, ZIF-C). Then, we tested the effect of ethanol washes on the 36 samples and found that it gave rise to phase transitions. For example, U13 became amorphous, while ZIF-C transformed partially or completely into sod. From these data we constructed a new second ternary phase diagram (TD-EtOH). Approximately 50% of the samples in TD-EtOH are amorphous; the remaining crystalline samples are dominated by the porous sod topology. The two ternary diagrams were used for the design of BSA-based composites with different crystallinity: starting with the same amount of protein, we could select conditions for the preparation of 5 different crystalline phases. To assess the potential of these systems for application to drug delivery, we focused our attention on determining their encapsulation efficiency and release profiles. We measured encapsulation efficiencies over 85% and a 100% release that can be tuned from 20 to 300 min depending on the selected phase. In general, we believe that the ternary diagrams can be used to design new biocomposites with tailored functional properties for bio-catalysis, bio-banking and drug delivery. As a proof of concept, we applied the ternary diagram to synthesize insulin biocomposites and test their encapsulation and release properties. Finally, we uncovered for the first-time proteins@ZIF-C composites. For BSA@ZIF-C and insulin@ZIF-C, we measured EEBSA% = 99% and EEinsulin% = 94%, and 100% release was achieved in 120 and 200 min, respectively. This new bioMOF composite is an appealing crystalline structure alternative to sod and dia with potentially useful properties for encapsulation and release of biotherapeutics.Conflicts of interest
There are no conflicts to declare.Acknowledgements
The research leading to these results has received funding from the European Research Council under the European Union's Horizon 2020 Programme (FP/2014-2020)/ERC Grant Agreement no. 771834 – POPCRYSTAL. The authors acknowledge support from the European Union's Horizon 2020 FETOPEN-1-2016-2017 Research and Innovation Program under grant agreement 801464. This work was supported by the Australian Research Council Discovery Project (DP170103531). P. F. acknowledges TU Graz for the Lead Project (LP-03). M. J. V. H. acknowledges The National Council of Science and Technology (CONACyT, México) for the postdoctoral scholarship (CVU 419210). R. R. acknowledges the European Union's Horizon 2020 Research and Innovation Programme under the Marie Skłodowska-Curie grant agreement #748649 (project “MNEMONIC”). Financial support from the Swedish Research Council (2017-0432) and the Knut and Alice Wallenberg Foundation (KAW 2016.0072) are gratefully acknowledged. E. A. acknowledges the Austrian Agency for International Cooperation in Education and Research (OeAD-GmbH) for the PhD scholarship.Notes and references
- H. Furukawa, K. E. Cordova, M. O'Keeffe and O. M. Yaghi, Science, 2013, 341, 1230444 CrossRef PubMed.
- A. C. McKinlay, R. E. Morris, P. Horcajada, G. Férey, R. Gref, P. Couvreur and C. Serre, Angew. Chem., Int. Ed., 2010, 49, 6260–6266 CrossRef CAS PubMed.
- P. Horcajada, C. Serre, M. Vallet-Regí, M. Sebban, F. Taulelle and G. Férey, Angew. Chem., Int. Ed., 2006, 45, 5974–5978 CrossRef CAS PubMed.
- S. Wuttke, A. Zimpel, T. Bein, S. Braig, K. Stoiber, A. Vollmar, D. Müller, K. Haastert-Talini, J. Schaeske, M. Stiesch, G. Zahn, A. Mohmeyer, P. Behrens, O. Eickelberg, D. A. Bölükbas and S. Meiners, Adv. Healthcare Mater., 2017, 6, 1600818 CrossRef PubMed.
- C. Doonan, R. Riccò, K. Liang, D. Bradshaw and P. Falcaro, Acc. Chem. Res., 2017, 50, 1423–1432 CrossRef CAS PubMed.
- D. A. LaVan, D. M. Lynn and R. Langer, Nat. Rev. Drug Discovery, 2002, 1, 77–84 CrossRef CAS PubMed.
- Y. Chen, P. Li, J. A. Modica, R. J. Drout and O. K. Farha, J. Am. Chem. Soc., 2018, 140, 5678–5681 CrossRef CAS PubMed.
- Y. Feng, H. Wang, S. Zhang, Y. Zhao, J. Gao, Y. Zheng, P. Zhao, Z. Zhang, M. J. Zaworotko, P. Cheng, S. Ma and Y. Chen, Adv. Mater., 2019, 31, 1805148 CrossRef PubMed.
- J. Yao and H. Wang, Chem. Soc. Rev., 2014, 43, 4470–4493 RSC.
- B. Chen, Z. Yang, Y. Zhu and Y. Xia, J. Mater. Chem. A, 2014, 2, 16811–16831 RSC.
- K. Liang, R. Ricco, C. M. Doherty, M. J. Styles, S. Bell, N. Kirby, S. Mudie, D. Haylock, A. J. Hill, C. J. Doonan and P. Falcaro, Nat. Commun., 2015, 6, 7240 CrossRef CAS PubMed.
- W. Liang, H. Xu, F. Carraro, N. K. Maddigan, Q. Li, S. G. Bell, D. M. Huang, A. Tarzia, M. B. Solomon, H. Amenitsch, L. Vaccari, C. J. Sumby, P. Falcaro and C. J. Doonan, J. Am. Chem. Soc., 2019, 141, 2348–2355 CrossRef CAS PubMed.
- F. Lyu, Y. Zhang, R. N. Zare, J. Ge and Z. Liu, Nano Lett., 2014, 14, 5761–5765 CrossRef CAS PubMed.
- X. Wu, M. Hou and J. Ge, Catal. Sci. Technol., 2015, 5, 5077–5085 RSC.
- X. Wu, J. Ge, C. Yang, M. Hou and Z. Liu, Chem. Commun., 2015, 51, 13408–13411 RSC.
- F.-K. Shieh, S.-C. Wang, C.-I. Yen, C.-C. Wu, S. Dutta, L.-Y. Chou, J. V. Morabito, P. Hu, M.-H. Hsu, K. C.-W. Wu and C.-K. Tsung, J. Am. Chem. Soc., 2015, 137, 4276–4279 CrossRef CAS PubMed.
- N. K. Maddigan, A. Tarzia, D. M. Huang, C. J. Sumby, S. G. Bell, P. Falcaro and C. J. Doonan, Chem. Sci., 2018, 9, 4217–4223 RSC.
- E. Astria, M. Thonhofer, R. Ricco, W. Liang, A. Chemelli, A. Tarzia, K. Alt, C. E. Hagemeyer, J. Rattenberger, H. Schroettner, T. Wrodnigg, H. Amenitsch, D. M. Huang, C. J. Doonan and P. Falcaro, Mater. Horiz., 2019, 6(5), 969–977 RSC.
- S. Li, M. Dharmarwardana, R. P. Welch, C. E. Benjamin, A. M. Shamir, S. O. Nielsen and J. J. Gassensmith, ACS Appl. Mater. Interfaces, 2018, 10, 18161–18169 CrossRef CAS PubMed.
- M. Hoop, C. F. Walde, R. Riccò, F. Mushtaq, A. Terzopoulou, X.-Z. Chen, A. J. deMello, C. J. Doonan, P. Falcaro, B. J. Nelson, J. Puigmartí-Luis and S. Pané, Appl. Mater. Today, 2018, 11, 13–21 CrossRef.
- T.-T. Chen, J.-T. Yi, Y.-Y. Zhao and X. Chu, J. Am. Chem. Soc., 2018, 140, 9912–9920 CrossRef CAS PubMed.
- W. Chen and C. Wu, Dalton Trans., 2018, 47, 2114–2133 RSC.
- X. Wu, C. Yang and J. Ge, Bioresour. Bioprocess., 2017, 4, 24 CrossRef PubMed.
- M. de J. Velásquez-Hernández, R. Ricco, F. Carraro, F. T. Limpoco, M. Linares-Moreau, E. Leitner, H. Wiltsche, J. Rattenberger, H. Schröttner, P. Frühwirt, E. M. Stadler, G. Gescheidt, H. Amenitsch, C. J. Doonan and P. Falcaro, CrystEngComm, 2019, 21, 4538–4544 RSC.
- M. A. Luzuriaga, C. E. Benjamin, M. W. Gaertner, H. Lee, F. C. Herbert, S. Mallick and J. J. Gassensmith, Supramol. Chem., 2019, 0, 1–6 CAS.
- O. Karagiaridi, M. B. Lalonde, W. Bury, A. A. Sarjeant, O. K. Farha and J. T. Hupp, J. Am. Chem. Soc., 2012, 134, 18790–18796 CrossRef CAS PubMed.
- Q. Bao, Y. Lou, T. Xing and J. Chen, Inorg. Chem. Commun., 2013, 37, 170–173 CrossRef CAS.
- K. Kida, M. Okita, K. Fujita, S. Tanaka and Y. Miyake, CrystEngComm, 2013, 15, 1794 RSC.
- M. Jian, B. Liu, R. Liu, J. Qu, H. Wang and X. Zhang, RSC Adv., 2015, 5, 48433–48441 RSC.
- A. D. Katsenis, A. Puškarić, V. Štrukil, C. Mottillo, P. A. Julien, K. Užarević, M.-H. Pham, T.-O. Do, S. A. J. Kimber, P. Lazić, O. Magdysyuk, R. E. Dinnebier, I. Halasz and T. Friščić, Nat. Commun., 2015, 6, 6662 CrossRef CAS PubMed.
- M. He, J. Yao, Q. Liu, K. Wang, F. Chen and H. Wang, Microporous Mesoporous Mater., 2014, 184, 55–60 CrossRef CAS.
- Z. Akimbekov, A. D. Katsenis, G. P. Nagabhushana, G. Ayoub, M. Arhangelskis, A. J. Morris, T. Friščić and A. Navrotsky, J. Am. Chem. Soc., 2017, 139, 7952–7957 CrossRef CAS PubMed.
- R. Chen, J. Yao, Q. Gu, S. Smeets, C. Baerlocher, H. Gu, D. Zhu, W. Morris, O. M. Yaghi and H. Wang, Chem. Commun., 2013, 49, 9500–9502 RSC.
- W. Liang, R. Ricco, N. K. Maddigan, R. P. Dickinson, H. Xu, Q. Li, C. J. Sumby, S. G. Bell, P. Falcaro and C. J. Doonan, Chem. Mater., 2018, 30, 1069–1077 CrossRef CAS.
- S. Cao, T. D. Bennett, D. A. Keen, A. L. Goodwin and A. K. Cheetham, Chem. Commun., 2012, 48, 7805–7807 RSC.
- C. Avci, J. Ariñez-Soriano, A. Carné-Sánchez, V. Guillerm, C. Carbonell, I. Imaz and D. Maspoch, Angew. Chem., Int. Ed., 2015, 54, 14417–14421 CrossRef CAS PubMed.
- D. J. Connell, A. Gebril, M. A. H. Khan, S. V. Patwardhan, K. Kubiak-Ossowska, V. A. Ferro and P. A. Mulheran, Sci. Rep., 2018, 8, 17115 CrossRef PubMed.
- K. A. Majorek, P. J. Porebski, A. Dayal, M. D. Zimmerman, K. Jablonska, A. J. Stewart, M. Chruszcz and W. Minor, Mol. Immunol., 2012, 52, 174–182 CrossRef CAS PubMed.
- W. Liang, F. Carraro, M. B. Solomon, S. G. Bell, H. Amenitsch, C. J. Sumby, N. G. White, P. Falcaro and C. J. Doonan, J. Am. Chem. Soc., 2019, 141, 14298–14305 CrossRef CAS PubMed.
- S. A. Basnayake, J. Su, X. Zou and K. J. Balkus, Inorg. Chem., 2015, 54, 1816–1821 CrossRef CAS PubMed.
- M. O. Cichocka, J. Ångström, B. Wang, X. Zou and S. Smeets, J. Appl. Crystallogr., 2018, 51, 1652–1661 CrossRef CAS PubMed.
- S. Yuan, J.-S. Qin, H.-Q. Xu, J. Su, D. Rossi, Y. Chen, L. Zhang, C. Lollar, Q. Wang, H.-L. Jiang, D. H. Son, H. Xu, Z. Huang, X. Zou and H.-C. Zhou, ACS Cent. Sci., 2018, 4, 105–111 CrossRef CAS PubMed.
- Y. Lo, C. H. Lam, C.-W. Chang, A.-C. Yang and D.-Y. Kang, RSC Adv., 2016, 6, 89148–89156 RSC.
- L. Bouëssel du Bourg, A. U. Ortiz, A. Boutin and F.-X. Coudert, APL Mater., 2014, 2, 124110 CrossRef.
- M. Baker, Nat. Biotechnol., 2005, 23, 1065–1072 CrossRef CAS PubMed.
- T. W. Overton, Drug Discovery Today, 2014, 19, 590–601 CrossRef CAS PubMed.
- G. Walsh, Nat. Biotechnol., 2010, 28, 917–924 CrossRef CAS PubMed.
- W. Chang, J. Cheng, J. J. Allaire, Y. Xie, J. McPherson, RStudio, jQuery F. (jQuery library and jQuery U. library), jQuery contributors (jQuery library; authors listed in inst/www/shared/jquery-AUTHORS.txt), jQuery U. contributors (jQuery U. library; authors listed in inst/www/shared/jqueryui/AUTHORS.txt), M. O. (Bootstrap library), J. T. (Bootstrap library), B. contributors (Bootstrap library), Twitter, I. (Bootstrap library), A. F. (html5shiv library), S. J. (Respond js library), S. P. (Bootstrap-datepicker library), A. R. (Bootstrap-datepicker library), D. G. (Font-A. font), B. R. (selectize js library), K. M. K. (es5-shim library), es5-shim contributors (es5-shim library), D. I. (ion rangeSlider library), S. S. (Javascript strftime library), S. L. (DataTables library), J. F. (showdown js library), J. G. (showdown js library), I. S. (highlight js library) and R. C. T. (tar implementation from R), shiny: Web Application Framework for R, 2019.
- A. Barth, Biochim. Biophys. Acta, Bioenerg., 2007, 1767, 1073–1101 CrossRef CAS PubMed.
- M. Jackson and H. H. Mantsch, Crit. Rev. Biochem. Mol. Biol., 1995, 30, 95–120 CrossRef CAS PubMed.
- Y. Hu, H. Kazemian, S. Rohani, Y. Huang and Y. Song, Chem. Commun., 2011, 47, 12694–12696 RSC.
- G. Kumari, K. Jayaramulu, T. K. Maji and C. Narayana, J. Phys. Chem. A, 2013, 117, 11006–11012 CrossRef CAS PubMed.
- J. Ethiraj, F. Bonino, C. Lamberti and S. Bordiga, Microporous Mesoporous Mater., 2015, 207, 90–94 CrossRef CAS.
- G. Socrates, Infrared and Raman Characteristic Group Frequencies: Tables and Charts, John Wiley & Sons, 2004 Search PubMed.
- N. Kuhar, S. Sil, T. Verma and S. Umapathy, RSC Adv., 2018, 8, 25888–25908 RSC.
- M. Wang, L. Jiang, E. J. Kim and S. H. Hahn, RSC Adv., 2015, 5, 87496–87503 RSC.
- C. Li, L. Xing and S. Che, Dalton Trans., 2012, 41, 3714–3719 RSC.
- H. Qing, H. Yanlin, S. Fenlin and T. Zuyi, Spectrochim. Acta, Part A, 1996, 52, 1795–1800 CrossRef.
- Z.-X. Low, J. Yao, Q. Liu, M. He, Z. Wang, A. K. Suresh, J. Bellare and H. Wang, Cryst. Growth Des., 2014, 14, 6589–6598 CrossRef CAS.
- A. P. Nelson, O. K. Farha, K. L. Mulfort and J. T. Hupp, J. Am. Chem. Soc., 2009, 131, 458–460 CrossRef CAS PubMed.
- A. S. Determan, B. G. Trewyn, V. S.-Y. Lin, M. Nilsen-Hamilton and B. Narasimhan, J. Controlled Release, 2004, 100, 97–109 CrossRef CAS PubMed.
- K. N. Clayton, D. Lee, S. T. Wereley and T. L. Kinzer-Ursem, Lab Chip, 2017, 17, 4148–4159 RSC.
- M. Mishra, Handbook of Encapsulation and Controlled Release, CRC Press, 2015 Search PubMed.
- M. L. Hans and A. M. Lowman, Curr. Opin. Solid State Mater. Sci., 2002, 6, 319–327 CrossRef CAS.
- C.-Y. Sun, C. Qin, X.-L. Wang and Z.-M. Su, Expert Opin. Drug Delivery, 2013, 10, 89–101 CrossRef CAS PubMed.
- F. O. Costa, J. J. S. Sousa, A. A. C. C. Pais and S. J. Formosinho, J. Controlled Release, 2003, 89, 199–212 CrossRef CAS PubMed.
- K. Zhang, R. P. Lively, C. Zhang, R. R. Chance, W. J. Koros, D. S. Sholl and S. Nair, J. Phys. Chem. Lett., 2013, 4, 3618–3622 CrossRef CAS.
- K. Ghosal, A. Chandra, R. Rajabalaya, S. Chakraborty and A. Nanda, Pharmazie, 2012, 67(2), 147–155 CAS.
- Y. Zhang, J. Yu, A. R. Kahkoska, J. Wang, J. B. Buse and Z. Gu, Adv. Drug Delivery Rev., 2019, 139, 51–70 CrossRef CAS PubMed.
- C.-J. Ke, Y.-J. Lin, Y.-C. Hu, W.-L. Chiang, K.-J. Chen, W.-C. Yang, H.-L. Liu, C.-C. Fu and H.-W. Sung, Biomaterials, 2012, 33, 5156–5165 CrossRef CAS PubMed.
- X. Jin, D. D. Zhu, B. Z. Chen, M. Ashfaq and X. D. Guo, Adv. Drug Delivery Rev., 2018, 127, 119–137 CrossRef CAS PubMed.
Footnote |
| † Electronic supplementary information (ESI) available: Experimental section, Tables S1–S6, Fig. S1–S9, The “ZIF phase analysis” application description. See DOI: 10.1039/c9sc05433b |
| This journal is © The Royal Society of Chemistry 2020 |