DOI:
10.1039/C9SC04336E
(Edge Article)
Chem. Sci., 2020,
11, 1775-1797
Target identification among known drugs by deep learning from heterogeneous networks†
Received
28th August 2019
, Accepted 9th January 2020
First published on 13th January 2020
Abstract
Without foreknowledge of the complete drug target information, development of promising and affordable approaches for effective treatment of human diseases is challenging. Here, we develop deepDTnet, a deep learning methodology for new target identification and drug repurposing in a heterogeneous drug–gene–disease network embedding 15 types of chemical, genomic, phenotypic, and cellular network profiles. Trained on 732 U.S. Food and Drug Administration-approved small molecule drugs, deepDTnet shows high accuracy (the area under the receiver operating characteristic curve = 0.963) in identifying novel molecular targets for known drugs, outperforming previously published state-of-the-art methodologies. We then experimentally validate that deepDTnet-predicted topotecan (an approved topoisomerase inhibitor) is a new, direct inhibitor (IC50 = 0.43 μM) of human retinoic-acid-receptor-related orphan receptor-gamma t (ROR-γt). Furthermore, by specifically targeting ROR-γt, topotecan reveals a potential therapeutic effect in a mouse model of multiple sclerosis. In summary, deepDTnet offers a powerful network-based deep learning methodology for target identification to accelerate drug repurposing and minimize the translational gap in drug development.
Introduction
A recent study estimates that pharmaceutical companies spent $2.6 billion in 2015, up from $802 million in 2003, in the development of a new U.S. Food and Drug Administration (FDA)-approved drug.1 One of the primary factors for the increased cost is the high failure rate of randomized control trials that are expensive and time-consuming to conduct.2,3 The classical hypothesis of ‘one gene, one drug, one disease’ in the drug discovery paradigm may have contributed to the low success rate in drug development. Without prior knowledge of the complete drug target information (i.e., the molecular ‘promiscuity’ of drugs), developing promising strategies for efficacious treatment of multiple complex diseases is challenging, owing to unintended therapeutic effects or multiple drug–target interactions leading to off-target toxicities and suboptimal effectiveness.4
Identification of molecular targets for known drugs is essential to improve efficacy while minimizing side effects in clinical trials.5,6 However, experimental determination of drug–target interactions is costly and time-consuming.7 Computational approaches offer novel testable hypotheses for systematic, unbiased identification of molecular targets of known drugs.8–11
Several published state-of-the-art methodologies focused on utilizing drug or target information from homogeneous networks. Xia et al. proposed a semi-supervised learning method for prediction of drug–target interactions (DTI) under the bipartite local model concept, named NetLapRLS.12 NetLapRLS applied Laplacian regularized least square and incorporated both similarity and DTI kernels into the prediction framework. Another study used a kernelized Bayesian matrix factorization with twin kernels to predict DTIs, termed KBMF2K.13 KBMF2K utilized dimensionality reduction, matrix factorization, and binary classifier in predicting DTIs. Specifically, KBMF2K proposed a joint Bayesian formulation to project drugs and targets/proteins into a unified subspace using chemoinformatics and bioinformatics similarities in inferring new DTIs.13 Homogeneous network-derived methodologies showed a limited accuracy in inferring novel DTIs.
Recent remarkable advances of omics technologies and systems pharmacology approaches have generated considerable knowledge from chemical,8 phenotypic,9 genomic,14 and cellular networks.4,5,15 A network integrating these parameters makes it possible to infer whether two drugs share a target. The drug–target network is a bipartite graph composed of FDA-approved drugs and proteins linked by experimentally validated drug–target/protein binary associations.16 Network-based approaches have been adopted for target identification for known drugs, which helps counter side effects and accelerate drug repurposing.4,5,15 However, traditional network topology-based algorithms are based on a single homogeneous drug–target network, and perform poorly on low connectivity (degree) drugs in known drug–target networks. Heterogeneous data sources provide diverse information and a multi-view perspective in predicting novel DTIs. Incorporating heterogeneous data can potentially boost the accuracy of DTI prediction and offer new insights into drug repurposing. Luo et al.17 utilized an unsupervised manner to learn low-dimensional feature representations of drugs and targets from heterogeneous networks, termed DTINet. DTINet applied inductive matrix completion18 to predict novel DTIs based on the learned features. Subsequently, the same group further proposed, NeoDTI,19 a neural network-based approach, for DTI prediction with an improved performance. Yet, the features learned from the unsupervised learning procedure did not capture non-linearity and randomly selected drug–target pairs as negative samples often cause potential false positive rate. How to integrate large-scale chemical, genomic, and phenotypic profiles with publicly available systems biology data efficiently to accelerate target identification and drug development is an essential task in both the academic and industrial communities.
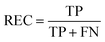
In this study, we develop a network-based deep learning methodology, denoted deepDTnet, for in silico identification of molecular targets for known drugs. Specifically, deepDTnet embeds 15 types of chemical, genomic, phenotypic, and cellular networks (Fig. 1) to generate biologically and pharmacologically relevant features through learning low-dimensional but informative vector representations for both drugs and targets (Fig. 2). The central unifying hypothesis is that a pharmacologically relevant, systems-based network analysis of large-scale biological networks will be more interpretable, visualizing prediction of molecular targets for known drugs compared to traditional ‘black box’ machine-learning methods. This process is chemical biology-intuitive because it is analogous to drug target identification, which often involves medicinal chemists relating a drug to the drug–target database of similar drugs they have seen. Via systematic evaluation, deepDTnet computationally identifies thousands of novel drug–target interactions with high accuracy, outperforming previously published approaches. In comparison to existing computational approaches, there are two significant improvements in deepDTnet: (1) we proposed a deep neural networks for graph representations (DNGR) algorithm20 to learn low-dimensional but informative vectors representations for both drugs and targets by a unique integration of large-scale chemical, genomic, and phenotypic profiles, outperforming previously published approaches; and (2) owing to the lack of experimentally reported negative samples (non-interactions between drugs and targets) from the publicly available databases, we employed the Positive-Unlabeled (PU)-matrix completion algorithm to low-rank matrix completion, which is able to infer whether two drugs share a target without negative samples as input. Importantly, we validate the deepDTnet experimentally and demonstrate a potential drug repurposing application in a mouse model of multiple sclerosis. Taken together, if broadly applied, deepDTnet offers a powerful deep learning methodology by exploiting advances in big and diverse biomedical data for accelerating target identification and drug repurposing.
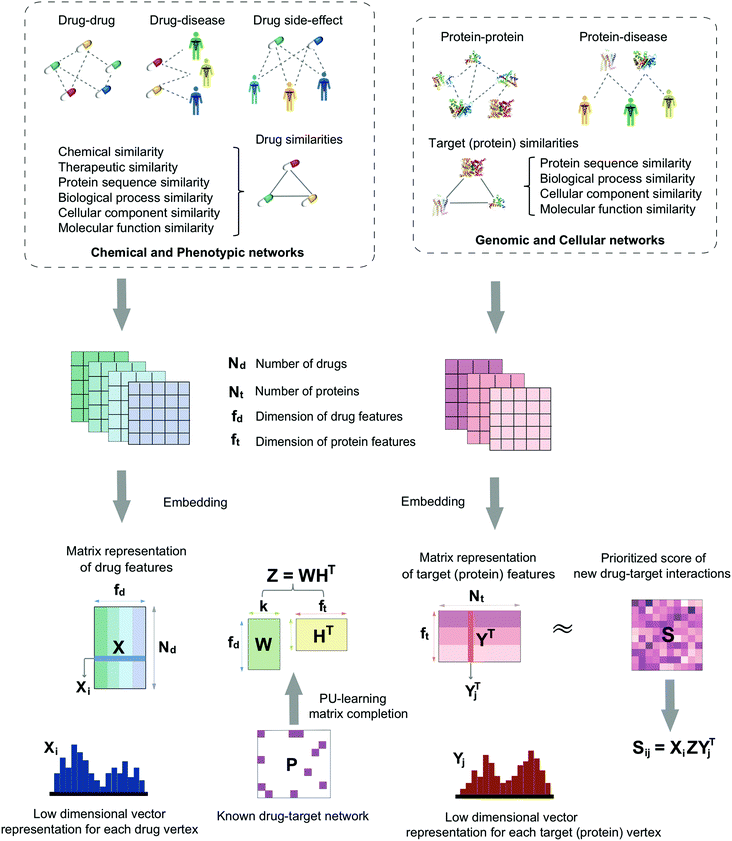 |
| | Fig. 1 A diagram illustrating the workflow of deepDTnet. DeepDTnet embeds the 15 types of chemical, genomic, phenotypic, and cellular networks and applies a deep neural network algorithm to learn a low-dimensional vector representation of the features for each node (see ESI Methods†). After learning the feature matrix X and Y for drugs and targets (i.e., each row in X and Y represents the feature vector of a drug or a target, respectively), deepDTnet applies PU-matrix completion to find the best projection from the drug space onto target (protein) space, such that the projected feature vectors of drugs are geometrically close to the feature vectors of their known interacting targets. Finally, deepDTnet infers new targets for a drug ranked by geometric proximity to the projected feature vector of the drug in the projected space (see Methods). | |
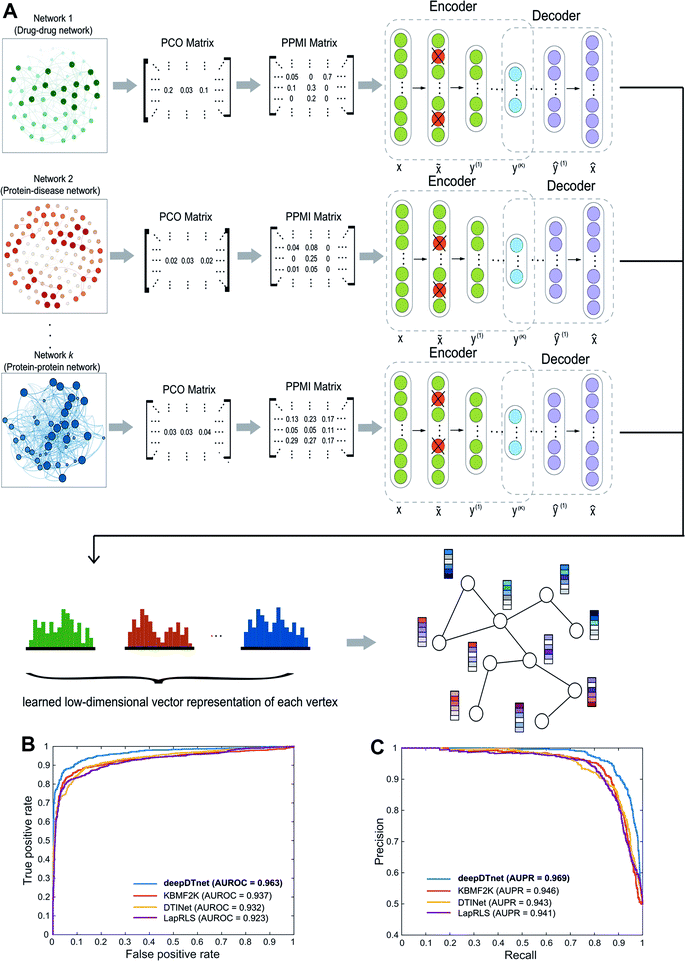 |
| | Fig. 2 A workflow illustrating the network embedding and performance of deepDTnet. (A) The deep neural networks model for graph representations (DNGR) consists of three major steps: (i) a random surfing model to capture the graph structural information and generate a probabilistic co-occurrence (PCO) matrix; (ii) calculation of the shifted positive pointwise mutual information (PPMI) matrix based on the probabilistic co-occurrence matrix; and (iii) a stacked denoising autoencoder to generate compressed, low-dimensional vectors from the original high-dimensional vertex vectors. The learned low-dimensional feature vectors encode the relational properties, association information, and topological context of each node in the heterogeneous drug–gene–disease network (see Methods). (B and C) Performance of deepDTnet was assessed by both (B) the area under the receiver operating characteristic curve (AUROC) and (C) the area under the precision-recall curve (AUPR) of deepDTnet against top k predicted list during cross-validation. The experimentally validated drug–target interactions (Table S3†) are used to evaluate the model performance. | |
Results
Overview of deepDTnet
Here, we develop a network-based, deep learning methodology, deepDTnet, for in silico identification of molecular targets among known drugs. Specifically, deepDTnet integrates two key steps: (1) we apply a deep neural network algorithm for network embedding, which embeds each vertex in a network into a low-dimensional vector space; and (2) due to lack of publicly available negative samples, we use a PU-matrix completion algorithm, which is a vector space projection scheme, for predicting novel drug–target interactions. As shown in Fig. 1, we firstly build a heterogeneous network connecting drugs, targets, and diseases by integrating 15 types of chemical, genomic, phenotypic, and cellular network profiles (see Methods). deepDTnet then embeds in total 15 networks (Tables S1 and S2†) to learn low-dimensional but informative vector representations for both drugs and targets using a DNGR algorithm20 (Fig. 2). After learning the low-dimensional feature vectors, the optimization is modified compared to low-rank matrix completion. For any given drug–target pair, it is difficult to verify unobserved evidence that such a connection is, indeed, nonexistent, or hidden, owing to lack of reported negative samples from publicly available literatures. We, thus, employ the PU-learning formulation to low-rank matrix completion, which is able to infer whether two drugs share a target (see Methods).21,22
High performance of deepDTnet
To evaluate the performance of deepDTnet, we first build a drug–target network, including 5680 experimentally validated drug–target interactions connecting 732 approved drugs and 1176 human targets (Table S3†), by assembling the binding affinity data from six data resources (see Methods). In a 5-fold cross-validation, 20% of the experimentally validated drug–target pairs are randomly selected as the positive samples and a matching number of randomly sampled non-interacting (‘unobserved’) pairs are selected as the negative samples serving as the test set. The remaining 80% of experimentally validated drug–target pairs and a matching number of randomly sampled non-interacting pairs are used as the training set. The area under the receiver operating characteristic curve (AUROC) is 0.963 (Fig. 2B) and the area under the recall versus precision curve (AUPR) is 0.969 and (Fig. 2C) for deepDTnet. deepDTnet outperforms three previous state-of-the-art approaches: DTINet,11 NetLapRLS (LapRLS),12 and KBMF2K13 (Fig. 2B and C). In addition, deepDTnet outperforms that of four traditional machine learning approaches, as well (Fig. S1 and Table S4†), including random forest, support vector machine, k-nearest neighbors, and naïve Bayes.
We further focus on DTIs covering four classical druggable target families: G-protein-coupled receptors (GPCRs), kinases, nuclear receptors (NRs), and ion channels (ICs) (Fig. S2†). deepDTnet appears to capture sufficient information in identifying the known DTIs across all four well-known target families: AUROCs are 0.950, 0.981, 0.948, and 0.969 for GPCR, kinases, NR, and ICs, respectively. These observations indicate the high accuracy of deepDTnet in practical drug discovery applications (Fig. S3–S6†). In addition, deepDTnet shows high accuracy in predicting novel targets for known drugs (Fig. S7†), and in predicting novel drugs for known targets (Fig. S8†), as well in both drug's and target's 10-fold cross-validation analysis, indicating a high robustness.
Previous network-based approaches often show poor performance for drugs or targets with low connectivity (degree) in known drug–target networks.10,23 We find that deepDTnet shows high performance for drugs or targets with both high and low connectivity (Fig. S9 and S10†), suggesting a low degree bias that is independent of the incompleteness of existing networks. In addition, targets (proteins) have homologs and drugs share similar chemical structures among each other. We, therefore, evaluate the performance of deepDTnet for high versus low similarity drugs or targets based on the drug's chemical similarities or protein's sequence similarities, respectively. deepDTnet reveals high performance for drugs with both low and high chemical similarities (Fig. S11†), and for targets with both low and high protein sequence similarities (Fig. S12†), as well, suggesting high robustness compared to traditional chemical similarity-based or bioinformatics-based approaches. We further collect the newest experimentally validated DTIs from the DrugCentral database24 as an external validation set (see Methods). We find that deepDTnet shows high performance (AUROC = 0.838 and AUPR = 0.861) and outperforms the four traditional machine learning approaches on this external validation set, as well (Table S5†), indicating a high generalizability.
Pharmacological interpretation of deepDTnet
We employ the t-SNE (t-distributed stochastic neighbor embedding algorithm25) to further visualize the low-dimensional node representation learned by deepDTnet. Specifically, t-SNE is a nonlinear dimensionality reduction method that embeds similar objects in high-dimensional space close in two dimensions (2D). Using t-SNE, we project drugs grouped by the first-level of the Anatomical Therapeutic Chemical classification system (ATC) code onto 2D space. Fig. 3A shows that deepDTnet is able to distinguish 14 types of drugs grouped by ATC codes, outperforming DTINet (Fig. S13†). We further visualize four types of druggable targets (GPCRs, kinases, NRs, and ICs) in 2D space. Fig. 3B reveals that targets within the same target family are geographically grouped, and each group is well separated from each other, further demonstrating the high embedding ability of deepDTnet. In addition, low-dimensional vector representations identified by deepDTnet outperforms traditional network-based or bioinformatics approaches (including protein sequence or Gene Ontology [cellular component] similarity-based measures, Fig. 3B and S14†). Taken together, t-SNE analysis intuitively demonstrates the high self-learning capabilities of deepDTnet to uncover, model, and capture the underlying chemical structure and semantic relationships between multiple types of drug or target nodes in the heterogeneous networks (Fig. 3).
 |
| | Fig. 3 Visualization of the learned drug and target vectors. Visualization of the drug vector matrix and protein vector matrix learned by network embedding using the t-SNE (t-distributed stochastic neighbor embedding algorithm25). (A) The two-dimensional (2D) representation of the learned vectors for 14 types of drugs grouped by the first-level of the Anatomical Therapeutic Chemical Classification System codes (http://www.whocc.no/atc/). We can observe that semantically similar drugs are mapped to nearby representations. We assigned the drugs with multiple ATC codes based on two criteria: (1) the majority rule of ATC codes, and (2) manually checked and assigned by experts based on common clinical uses. (B) An illustration of the learned vectors for four well-known drug target families: G-protein-coupled receptors (GPCRs), kinases, nuclear receptors (NRs), and ion channels (ICs), non-linearly projected to 2D space for visualization by the t-SNE algorithm. | |
deepDTnet uncovers new molecular targets for known drugs
To uncover new targets for known drugs, we prioritize the top five predicted DTIs via deepDTnet for four target families: GPCRs, kinases, NRs, and ICs. Fig. 4A shows a bipartite drug–target network covering novel predicted DTIs across four target families. Here, we computationally identify 2214 DTIs connecting 79 GPCRs and 732 known drugs based on the top five candidates ranked by deepDTnet-predicted scores. The top 10 predicted GPCRs include HTR2A, ADRA2A, CHRM1, HTR2B, CHRM2, HRH1, ADRB2, HTR2C, ADRB1, and DRD3 (Fig. 4A). Compared to the known drug–target network (Fig. S2†), the computationally predicted DTIs by deepDTnet show a stronger promiscuity on FDA-approved drugs (Fig. 4A). We next inspect whether the predicted molecular targets by deepDTnet could help explain the mechanism-of-action of known drugs for characterizing their adverse effects or therapeutic effects by network analysis.
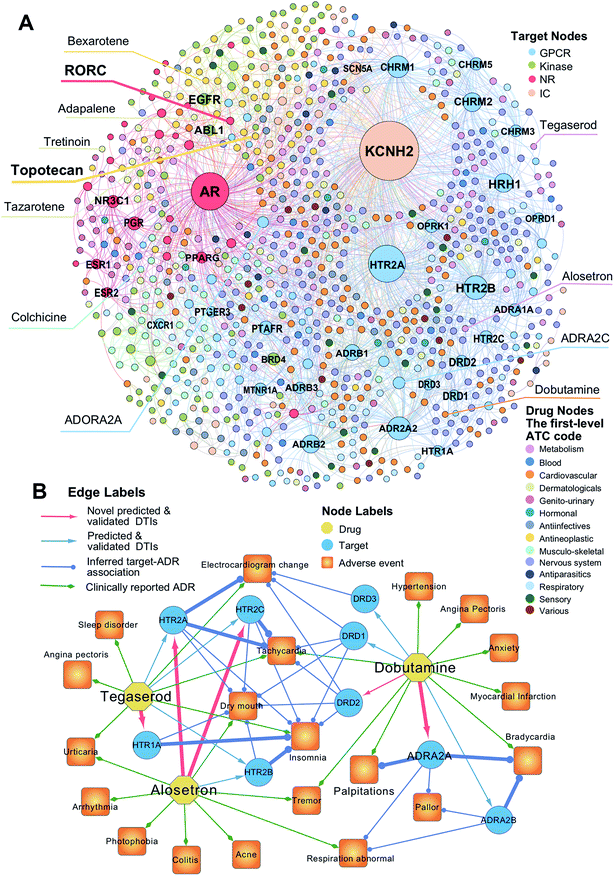 |
| | Fig. 4 The uncovered drug–target network via deepDTnet. (A) Computationally predicted drug–target networks for four well-known drug target families: G-protein-coupled receptors (GPCRs), kinases, nuclear receptors (NRs), and ion channels (ICs). Drugs are grouped by the first-level of the Anatomical Therapeutic Chemical classification system (ATC) codes (http://www.whocc.no/atc/). Drug targets comprise four groups, GPCRs, kinases, NRs, and ICs. (B) An illustration of the mechanisms-of-action of the deepDTnet-predicted GPCRs for three approved drugs validated by a recent high-throughput screening assay, for characterizing the mechanisms-of-action of their clinically reported adverse events. The experimental data for the predicted the drug–target interactions and the target-adverse events were collected from a recent study.27 The clinically reported adverse events of known drugs were collected from metaADEDB.26 | |
Dobutamine is an approved sympathomimetic drug used in the treatment of heart failure and cardiogenic shock by targeting beta1-adrenergic receptors.26 A recent pharmacovigilance study reported that dobutamine leads to several types of cardiovascular complications,26 including palpitation, bradycardia, and hypertension (Fig. 4B). Via deepDTnet, we find that dobutamine has potential interactions with several additional GPCRs (Table S6†). Among the top 10 predictions ranked by deepDTnet-predicted scores (Fig. 4B), five (DRD1, DRD2, DRD3, ADRA2A, and ADRA2B) are validated by recently published experimental data27 (Table S6†), including two novel deepDTnet-predicted GPCRs: ADRA2A (IC50 = 10.83 μM) and DRD2 (IC50 = 8.22 μM). Genetic studies showed that ADRA2A plays a crucial role by regulation of systemic sympathetic activity and cardiovascular responses, such as heart rate and blood pressure.28,29 Thus, the deepDTnet-predicted off-targets, such as ADRA2A and ADRA2B, may help explain the cardiovascular complications associated with dobutamine treatment (Fig. 4B). Alosetron (a selective serotonin type-3 receptor antagonist) and tegaserod (a 5-hydroxytryptamine receptor-4 agonist) were approved for the management of severe diarrhea-predominant irritable bowel syndrome in women.30 Subsequently, both drugs were withdrawn from the market due to a potential risk of ischemic colitis31 and several adverse cardiovascular effects, such as angina pectoris.31 Multiple polymorphisms in HTR2A, HTR1A, HTR2B, and HTR3C were identified in patients with high blood pressure,32,33 metabolic syndrome,32 and obstructive sleep apnea.34Via deepDTnet, we computationally identify several validated off-targets for alosetron and tegaserod (Table S6†), which may help explain the molecular mechanisms of several adverse effects, such as sleep disorder and angina pectoris (Fig. 4B). For example, alosetron is already annotated as activating HTR2B and tegaserod as activating HTR1A from the newest DrugCentral database24 (Fig. 4B). Collectively, the molecular targets identified by deepDTnet offer new mechanisms-of-action for characterizing adverse effects of known drugs. We next examined whether the identified novel molecular targets for known drugs by deepDTnet offer new possibilities for treating other human diseases (e.g., drug repurposing).
Experimental identification of topotecan as an antagonist of retinoic-acid-receptor (RAR)-related orphan receptor-gamma t (ROR-γt)
Nuclear receptors, ligand-activated transcription factors, play important roles in biological processes.35 In the past several decades, multiple small molecules that specifically target these receptors have been successfully approved for the treatment of human diseases.35 RAR-related orphan receptor-gamma t (ROR-γt) belongs to the nuclear receptor family of intracellular transcription factors.36 Several ROR-γt antagonists are being investigated in various stages of drug development for the treatment of inflammatory diseases.37Fig. 4A shows that several known drugs were predicted to have potential interactions with ROR-γt, such as bexarotene, colchicine, tretinoin, tazarotene, and adapalene. Among the top five novel candidates, bexarotene38 and tazarotene39 are reported to show potential activities on ROR-γt.
We next experimentally tested the top 25 novel candidates prioritized by deepDTnet. In total, 18 purchasable drugs for ROR-γt were tested using a cell-based luciferase reporter assay in a HEK293T cell line, a widely used cell line for ROR-γt luciferase reporter assay40 (see Methods). In this assay, GAL4-ROR-γt, with fused human ROR-γt-LBD, and a GAL4 DNA binding domain are co-transfected into HEK293T cells with a luciferase reporter gene harboring the GAL4 response element.40 Among 18 deepDTnet-predicted drugs, six drugs, including tazarotene, norethindrone, rosiglitazone, bezafibrate, topotecan, and spironolactone, have inhibitory activities greater than 30% against human ROR-γt at a concentration of 10 μM (Fig. 5A). Topotecan is the most potent inhibitor of ROR-γt with an inhibitory activity of 71.0% at 10 μM. Furthermore, topotecan exhibits a dose-dependent antagonistic activity with an IC50 value of 0.43 ± 0.02 μM in GAL4-ROR-γt expressing HEK293T cells (Fig. 5B). No suppression is observed in the control firefly luciferase activity experiments, indicating that topotecan has no nonspecific or off-target effects on luciferase (Fig. S15A†). In addition, topotecan has a minor effect on HEK293T cell viability at the same concentration range in the reporter assay, demonstrating a tolerable toxicity profile in normal human cells (Fig. S15B†). As topotecan is the most potent compound in the luciferase reporter assay, we selected it for further experimental validation.
 |
| | Fig. 5 DeepDTnet-predicted topotecan is a novel ROR-γt antagonist. (A) The screening results of 18 deepDTnet-predicted drugs at 10 μM in Gal4-based ROR-γt luciferase assay. (B) Topotecan (TPT) exhibits dose-dependent inhibition of ROR-γt transcriptional activity in Gal4-based luciferase reporter system. (C) TPT reveals dose-dependent inhibition of ROR-γt LBD and cofactor peptide SRC1 interaction in HTRF assay. (D) Induced circular dichroism (CD) spectra reveals the direct binding of TPT to ROR-γt LBD. Data are representative of three independent experiments. (E) High-performance liquid chromatography (HPLC) experiment indicates the binding of TPT to recombinant ROR-γt-LBD. (F) The predicted ligand-protein binding mode between TPT and ROR-γt using molecular docking (see Methods). | |
Nuclear receptors execute their versatile transcriptional functions by recruiting positive and negative regulatory proteins, known as coactivators or corepressors, respectively.41 Agonists promote interactions between nuclear receptors and coactivators, while antagonists either inhibit coactivator binding or facilitate corepressor recruitment.42 To investigate further the functional change of the binding of topotecan on ROR-γt, we utilize a HTRF assay (see Methods) to evaluate ligand-induced coactivator recruitment to ROR-γt. As shown in Fig. 5C, topotecan disrupts the interaction of ROR-γt-LBD with steroid receptor coactivator-1 (SRC-1) cofactor peptide in a dose-dependent manner with an IC50 value of 6.65 ± 0.02 μM. The HTRF-based coactivator recruitment results indicate that topotecan directly binds to ROR-γt and regulates the interaction between ROR-γt and SRC-1 peptide by inducing a conformational change on ROR-γt.
Circular dichroism (CD) is a powerful method for probing protein and ligand interactions in solution.43 Topotecan alters the CD spectrum of ROR-γt, confirming the direct binding of topotecan to ROR-γt-LBD (Fig. 5D). High-performance liquid chromatography (HPLC) further indicates that topotecan interacts with ROR-γt-LBD (Fig. 5E). Finally, we examine the binding mode of topotecan to human ROR-γt using molecular docking (see Methods). Fig. 5F reveals that topotecan interacts with multiple important residues on human ROR-γt, such as Arg364, Met365, Gln286, and Glu379. Specifically, topotecan shows a direct hydrogen-bonding interaction with Gln286, consistent with previously experimental studies.44 Fluorescence quenching is a widely-used method to assess ligand-protein binding through measuring the change of intrinsic fluorescence intensity.45 Considering the presence of tryptophan residues in ROR-γt-LBD (Trp314 and Trp317), we turned to use a fluorescence-quenching assay to further verify the direct interaction between the topotecan and ROR-γt-LBD. As shown in Fig. S16,† ROR-γt-LBD has a maximal fluorescence intensity at 337 nm and topotecan induces a dose-dependently fluorescence quenching of ROR-γt-LBD, suggesting a direct binding of topotecan to ROR-γt-LBD. Of note, topotecan has negligible intrinsic fluorescence within the given wavelength range. To determine the binding capacity of topotecan and ROR-γt-LBD, the fluorescence data were further analyzed using a modified Stern–Volmer equation.46 Fig. S16† shows a strong binding affinity of topotecan for ROR-γt-LBD with a Ka value of 1.6 × 10⁵ M−1. Taken together, by combining deepDTnet prediction and experimental assays, topotecan is identified as a novel, direct inhibitor of human ROR-γt.
Topotecan reverses multiple sclerosis in vivo
We next turned to focus on multiple sclerosis, an inflammation-mediated demyelinating disease of the central nervous system (CNS) and the major cause of non-traumatic neurological disability in young adults.47 Our studies are designed based upon three principles: (i) topotecan directly inhibits human ROR-γt, as identified by deepDTnet and multiple complementary assays (Fig. 5); (ii) ROR-γt has emerged as a key target for the treatment of multiple sclerosis;48 and (iii) topotecan has been shown to have ideal pharmacokinetics in the context of neurological diseases (i.e., blood–brain barrier [BBB] penetration), and is under investigation for treatment of Angelman syndrome based on a preclinical model.49 Experimental autoimmune encephalomyelitis (EAE) is the most frequently used experimental animal model for human multiple sclerosis.50 To investigate the therapeutic potential of topotecan in multiple sclerosis, EAE is induced in C57BL/6 mice by active immunization with MOG33–55 in complete Freund's adjuvant (CFA) followed by pertussis toxin administration (Fig. 6A). Topotecan (10 mg kg−1) or the vehicle (sterile water, control) is administered intraperitoneally every four days during the course of EAE. Disease severity is assessed and graded using a five-point scoring system for 15 days. Administration of topotecan leads to a significant delay in the onset of clinical symptoms and an observable reduction of the clinical score of the EAE mice (Fig. 6B). During the course of EAE, changes in body weight also reflect disease severity.51 We find that mice treated with topotecan are more tolerant of EAE-induced body weight loss than vehicle-treated mice (Fig. 6C). Histological analysis of spinal cords was conducted on day 20 after immunization (Fig. 6D). Hematoxylin and Eosin (H&E) staining shows significant infiltration of leukocytes in the spinal cord tissues from vehicle-treated mice, whereas infiltration is greatly reduced following topotecan treatment. Luxol fast blue (LFB) staining shows severe demyelination in the white matter of EAE mice, whereas demyelination is significantly attenuated in topotecan treated mice.
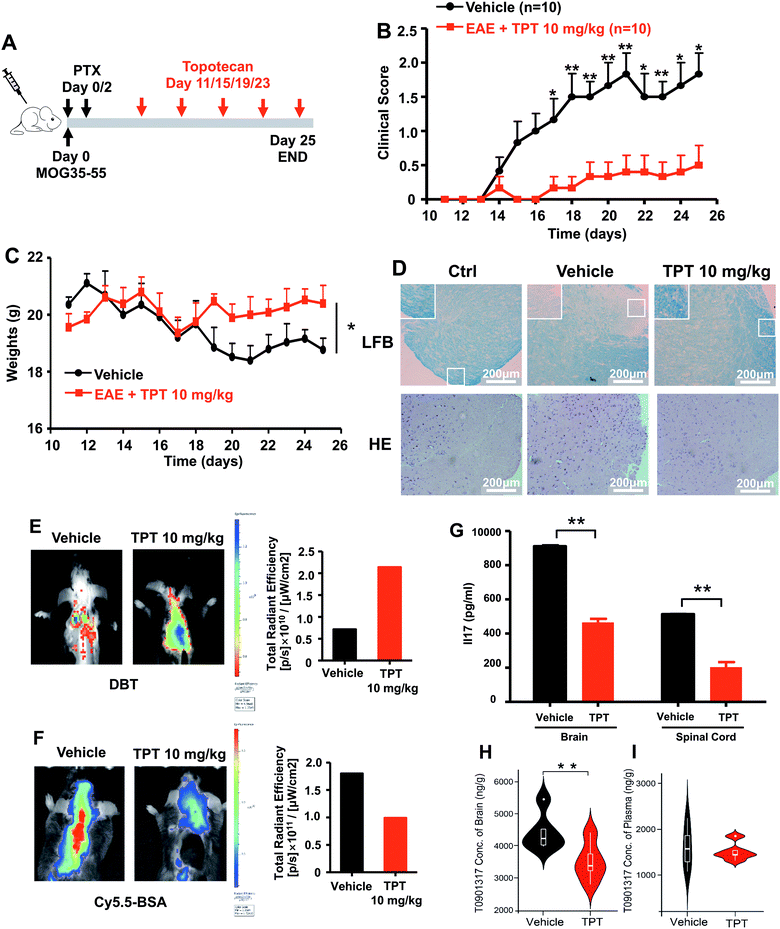 |
| | Fig. 6 DeepDTnet-predicted topotecan (TPT) reverses experimental autoimmune encephalomyelitis (EAE), a mouse model of multiple sclerosis. (A) An illustration of induction and treatment of EAE. (B) Mean clinical scores of EAE in vehicle- or TPT-treated group (n = 10/group). TPT (10 mg kg−1) or vehicle is intraperitoneal administered on day 11 after immunization every four days. Data are presented as the mean ± SEM of eight mice per group. Student's t-test is revealed, *P < 0.05, **P < 0.01. (C) The body weight of mice in vehicle- or TPT-treated group. Student's t-test is revealed, *P < 0.05. (D) Section of spinal cord tissue is prepared on day 20 post immunization and subjected to hematoxylin and eosin (H&E) staining and Luxol fast blue (LFB) staining. (E) In vivo imaging of myelination using myelin-binding dye, 3,3-diethylthiatricarbocyanine iodide (DBT) on day 20 after immunization. DBT dye readily enters the brain and specifically binds to myelinated fibers. (F) In vivo imaging of the blood–brain barrier integrity using Cy5.5-BSA on day 20 after immunization. Cy5.5-BSA uptake in the brain when the BBB (blood–brain barrier) integrity is disrupted. (G) ELISA analysis of IL-17 production of spinal cords and brain from vehicle- or TPT-treated EAE mice on day 20 after immunization. Data are presented as the mean ± SEM. Student's t-test is revealed, **P < 0.01. (H and I) Concentration of T0901317 in mice brain samples (H) and plasma (I). T0901317 (ref. 56), an orthosteric ligand of ROR-γt, was used as the tracer for assessing target occupancy of TPT in the mouse model. Student's t-test was performed and sterile water was used as vehicle. | |
Multiple sclerosis is a chronic demyelinating disease accompanied by BBB disruption.52 Near-infrared in vivo imaging is further utilized to evaluate the demyelination and blood–brain barrier leakage in EAE mice.53 A near-infrared fluorescent dye, 3,3′-diethylthiatricarbocyanine iodide (DBT), easily enters the brain and selectively binds to myelin fibers.54 As shown in Fig. 6E, administration of topotecan effectively reverses fluorescence in EAE mice. Cy5.5-BSA, a fluorescent BSA conjugate with bright near infrared fluorescence, penetrates the brain when the blood–brain barrier is disrupted. Fig. 6F shows a higher accumulation of the fluorescent probe in the brain of vehicle treated mice as compared to the topotecan treatment group.
T helper 17 (Th17) cells are a highly pro-inflammatory lineage of T helper cells defined by their production of interleukin 17 (IL-17).55 ROR-γt is necessary and sufficient for cytokine IL-17 expression in mouse and human Th17 cells.55 Given the inhibitory effects of topotecan against ROR-γt, we further investigate whether topotecan affects IL-17 expression in EAE mice. Of note, ELISA experiments reveal that topotecan treatment significantly reduces IL-17 production in brain and spinal cords of EAE mice (Fig. 6G). We further assessed toxicity of topotecan in EAE mice by hematoxylin and eosin (H&E) staining (Fig. S17†). Histological analysis of organ sections from vehicle-versus topotecan-treated groups suggests that topotecan is well tolerant and safe under given dosage (10 mg kg−1 every four days) in EAE mice (Fig. S17†). In summary, these results demonstrate that topotecan alleviates the clinical signs of the EAE model.
We also examined the pharmacokinetics profile of topotecan in C57BL/6 mice (Fig. S18†). Topotecan exhibits a half-life of 4.81 h and a maximal plasma concentration of 7.72 μM at 0.5 h (Fig. S19 and Table S7†) after intraperitoneal (i.p.) injection (10 mg kg−1). Topotecan penetrates the mouse's blood–brain barrier achieving a maximal brain concentration of 121.29 ng g−1 at 0.5 h (Fig. S20†). In addition, in vivo binding experiments in mice using HPLC-MS/MS methodology to assess target occupancy (Fig. S21†) were performed. T0901317 (ref. 56), an orthosteric ligand of ROR-γt, was used as the tracer for assessing topotecan target occupancy. As shown in Fig. 6h, topotecan's administration by i.p. injection (10 mg kg−1) reduces the T0901317 level significantly in the brain (P = 0.0029, Table S8†), while it has less effect on its concentration in plasma (P = 0.688, Fig. S21 and Table S9†). These findings suggest that topotecan specifically targets ROR-γt in the mouse brain. In summary, topotecan potentially alleviates the clinical symptoms in the EAE model via specific inhibition of ROR-γt. Although potential off-target effects and clinical trials remain to be investigated, our findings suggest that topotecan identified by deepDTnet offers a potential therapeutic strategy for multiple sclerosis via targeting ROR-γt in the mice brain.
Prediction of promiscuity of known drugs
We finally explore the promiscuity of approved drugs on a proteome-wide scale. Via deepDTnet, we computationally predict 22![[thin space (1/6-em)]](https://www.rsc.org/images/entities/char_2009.gif) 739 new drug–target interactions connecting 680 approved drugs and 1106 targets (Fig. S22†). Among 22739 predicted drug–target pairs, 1098 (Table S10†) were validated by the most recent DrugCentral database.24 These predicted drug–target interactions (Table S10†) by deepDTnet offer a virtual database for exploring the promiscuous targets of FDA-approved drugs by further experimental or clinical validation, and may aid the development of new treatment strategies via drug repurposing. The code package of deepDTnet and the predicted virtual drug–target networks are freely available at: https://github.com/ChengF-Lab/deepDTnet.
739 new drug–target interactions connecting 680 approved drugs and 1106 targets (Fig. S22†). Among 22739 predicted drug–target pairs, 1098 (Table S10†) were validated by the most recent DrugCentral database.24 These predicted drug–target interactions (Table S10†) by deepDTnet offer a virtual database for exploring the promiscuous targets of FDA-approved drugs by further experimental or clinical validation, and may aid the development of new treatment strategies via drug repurposing. The code package of deepDTnet and the predicted virtual drug–target networks are freely available at: https://github.com/ChengF-Lab/deepDTnet.
Discussion
Comprehensive evaluations demonstrate that deepDTnet shows high performance, uncovering known drug–target interactions, and outperforming previous state-of-the-art network-based and traditional machine learning approaches (Fig. 2B and C). For example, we found that DTINet showed high performance (AUROC = 0.912) in predicting new targets for drugs with high degree in the known drug–target network, while having poor performance (AUROC = 0.757) on drugs with low degree (Table S11†). Yet, deepDTnet reveals high performance in predicting drug–target interactions for drugs or targets with both high and low degree. In order to compare fairly the performance of deepDTnet with DTINet,11 we further evaluated them based on the same dataset published previously.11 We found that deepDTnet outperformed DTINet11 and NeoDTI,19 a recently updated version of DTINet, on both an experimentally validated drug–target network built in this study (Table S3†) and the previously published dataset11 (Fig. S23 and S24†). Comparing to DTINet11 and NeoDTI,19 we implemented deepDTnet via two new components: autoencoder embedding and PU matrix completion (Fig. 1). We found that autoencoder embedding, and PU matrix completion synergistically improved the performance of deepDTnet (Tables S12 and S13†). Models constructed on more comprehensive network datasets in this study outperform those constructed previously based on the published incomplete network datasets (Fig. S23 and S24†), indicating the importance of big network data in the deep learning-based prediction of drug–target interactions.
Most importantly, we experimentally validated that topotecan predicted by deepDTnet has a high inhibitory activity on human ROR-γt (Fig. 5). We subsequently showed that topotecan has potential therapeutic effects in EAE, a mouse model of multiple sclerosis. Both embryonic and adult-induced RORγ knock-out mice frequently develop lymphoma,57 indicating that RORγ gene ablation causes immune system-related pathology. We, therefore, used in vivo experiments replacing the ROR-γt knock-out mouse model to assess target occupancy of topotecan. We found that topotecan penetrate the mouse's blood–brain barrier achieving a maximal brain concentration of 121.29 ng g−1 at 0.5 h (Fig. S20†) after i.p. injection (10 mg kg−1), consistent with a previous study.58 Multiple sclerosis is considered a systemic immune disease, as overactive T lymphocytes are found in blood, spleen, and other organs.59 For example, changes in activated T cells in the blood correlate with disease activity in patients with multiple sclerosis.59 Herein, we found that the maximal plasma concentration of topotecan was 7.72 μM (Fig. S19†), which is higher than the effective concentration of 0.43 μM by the Gal4-based luciferase reporter assay (Fig. 5B) and 6.65 μM by the HTRF assay (Fig. 5C). Thus, topotecan may not only target peripheral T cells, but also target infiltrating T cells in EAE mice brain. We, therefore, reasoned that topotecan offers a potential therapeutic strategy for multiple sclerosis by targeting ROR-γt, although potential off-target effects and clinical trials are highly warranted. For example, gene expression analysis of topotecan-treated EAE mice may identify possible mechanism-of-action of topotecan further and offers potential biomarkers for future clinical trial design.
Several potential limitations of this study should be discussed. Weak binding affinity cut-offs (Ki, Kd, and IC50 of 10 μM) used in the current study may lead to a potential risk of false positive rate. Recent studies suggested that weak-binding drugs play important roles in drug discovery and development.60,61 We have successfully utilized this low binding affinity cutoff of 10 μM for in silico drug repurposing.4,5,15 However, a stronger binding affinity threshold (e.g., 1 μM) could be a more suitable cut-off in drug discovery, although it will generate a small sized drug–target network.62 In addition, the potential literature bias and incompleteness of biomedical networks (e.g., the human protein–protein interactome) may also lead to possible errors in deepDTnet. Several large-scale network datasets, including The Library of Integrated Network-Based Cellular Signatures (LINCS)63 available from DrugCentral,24 might improve the representation of the heterogeneous networks connecting drugs, genes, and diseases in the framework of deepDTnet. Integration of more comprehensive human interactome from recent studies64,65 may improve performance of deepDTnet further. Data generated from high-throughput image assays66 and large-scale patient data5 would enable further improvement of deepDTnet. Via ablation analysis (Table S14†), we found that integration of multiple networks outperforms a single network, which is consistent with tSNE analysis (Fig. S14†). This is a surprising result for drugs with low chemical similarity or targets with low protein sequence similarity (Fig. S11 and S12†). One possible explanation is that multiple network integration (including 15 types of chemical, genomic, phenotypic, and cellular networks) may improve accuracy for low similarity drugs or targets in comparison to traditional chemoinformatics or bioinformatics approaches alone. We found much lower accuracy for low similarity drugs or targets using drug chemical similarity and target protein sequencing similarity only under the deepDTnet framework (Table S15†). Thus, we reasoned that multiple network interactions improved accuracy for low similarity drugs or targets compared to traditional chemoinformatics or bioinformatics approaches alone. However, the potential risk of information redundancy from multiple networks' integration needs to be tested in the future. In addition, other feature extraction models, such as the multi-task deep neural network algorithm67 and convolution neural networks,68 can be used to replace the DNGR embedding model to improve further the performance of deepDTnet. Optimization of hyperparameters is an important step in the entire deepDTnet framework. Although we utilized several strategies, including grid search to find the optimized hyperparameters (Tables S16 and S17†), further hyper-parameter selection may improve performance of deepDTnet. Finally, the proposed deep learning framework could be used to explore other important clinical questions, such as prediction of drug–disease relationships or drug combinations in drug discovery and development.
Conclusions
We present deepDTnet, a novel, network-based deep learning methodology for target identification and drug repurposing, which systematically embeds 15 types of chemical, genomic, phenotypic, and cellular networks, and predicts new molecular targets among known drugs under a PU-learning framework. Most importantly, we experimentally validated that topotecan predicted by deepDTnet has a high inhibitory activity against human ROR-γt. We subsequently showed that topotecan has potential therapeutic effects in a mouse model of multiple sclerosis. To the best knowledge of the authors, this is a systematic deep learning study that integrates the largest biomedical network datasets for target identification, drug repurposing, and testing of findings experimentally. In this way, we can minimize the translational gap between pre-clinical testing results in animal models and clinical outcomes in humans, which is a significant problem in current drug development. In summary, our findings suggest that target identification and drug repurposing can benefit from network-based, rational deep learning prediction in order to explore the relationship between drugs and targets in a heterogeneous drug–gene–disease network. From a translational perspective, if broadly applied, the network-based deep learning tools presented here could help develop novel, efficacious treatment strategies for multiple complex diseases.
Methods and materials
Drug–target network
The drug–target network can be described as a bipartite graph G(D,T,P), where the drug set is denoted as D = {d1, d2,…, dn}, the target set as T = {t1, t2,…, tm}, and the interaction set as P = {pij:di ∈ D, tj ∈ T}. An interaction is drawn between di and tj when drug di binds with target tj with binding affinity (such as IC50, Ki, or Kd) less than a given threshold value. Mathematically, a drug–target bipartite network can be presented by an n × m adjacency matrix {pij}, where pij = 1 if the binding affinity between di and tj is less than 10 μM, otherwise pij = 0, as described as below.| |  | (1) |
We used a weak binding affinity cutoff of 10 μM as weak-binding drugs play important roles in drug discovery and development as well.60,61 We collect drug–target interaction information from the DrugBank database (v4.3),69 the Therapeutic Target Database (TTD, data downloaded by September 2017),70 and the PharmGKB database (data downloaded by July 2017).71 Specifically, bioactivity data for drug–target pairs are collected from ChEMBL (v20),72 BindingDB,73 and IUPHAR/BPS Guide to PHARMACOLOGY.74 All data were downloaded by July 2017. The chemical structure of each drug with SMILES format is extracted from DrugBank.69 Here, only drug–target interactions meeting the following three criteria are used (see ESI Note 1†): (i) the human target is represented by a unique UniProt accession number; (ii) the target is marked as ‘reviewed’ in the UniProt database (December 2018);75 and (iii) binding affinities, including Ki, Kd, IC50 or EC50 each ≤10 μM. In total, 5680 drug–target interactions connecting 732 FDA-approved drugs and 1178 unique human targets (proteins) were used. The details for building the experimentally validated drug–target network are provided in a recent publication.4,5,15 For the external validation set, we assembled the newest literature-derived experimentally validated drug–target interactions from the DrugCentral database,24 excluding overlapping pairs from the aforementioned datasets.
The human protein–protein interactome
To build a comprehensive human protein–protein interactome, we assembled data from a total of 15 bioinformatics and systems biology databases with multiple experimental evidences. Specifically, we focused on high-quality protein–protein interactions (PPIs) with five types of experimental evidences: (i) binary PPIs tested by high-throughput yeast-two-hybrid (Y2H) systems: we combined binary PPIs tested from two public available high-quality Y2H datasets76,77 and one unpublished dataset,5 publicly available at: http://ccsb.dana-farber.org/interactome-data.html; (ii) kinase-substrate interactions by literature-derived low-throughput or high-throughput experiments from Human Protein Resource Database (HPRD),78 PhosphoNetworks,79 KinomeNetworkX,80 DbPTM 3.0,81 PhosphositePlus,82 and Phospho. ELM;83 (iii) literature-curated PPIs identified by affinity purification followed by mass spectrometry (AP-MS), Y2H, or by literature-derived low-throughput experiments from BioGRID,84 PINA,85 MINT,86 IntAct,87 and InnateDB;88 (iv) binary, physical PPIs from protein three-dimensional (3D) structures from instruct;89 (v) protein complexes data (56000 candidate interactions) identified by a robust affinity purification-mass spectrometry methodology were collected from BioPlex V2.016;90 and (vi) signaling network by literature-derived low-throughput experiments downloaded from SignaLink2.0.91 All data were downloaded in June, 2017. The genes were mapped to their Entrez ID based on the NCBI database92 as well as their official gene symbols based on GeneCards (http://www.genecards.org/). In this study, all inferred data, including evolutionary analysis, gene expression data, and metabolic associations, were excluded. Finally, duplicated pairs were removed. The resulting human protein–protein interactome used in this study includes 16133 PPIs connecting 1915 unique drug targets (proteins) (data can be downloaded from https://github.com/ChengF-Lab/deepDTnet). The detailed descriptions for building human protein–protein interactome are provided in our previous studies.4,5,15
Drug–drug interactions
We compiled clinically reported DDI data from the DrugBank database (v4.3).69 Here, we focused on drug interactions where each drug has the experimentally validated target information. The chemical name, generic name or commercial name of each drug were standardized by Medical Subject Headings (MeSH) and Unified Medical Language System (UMLS) vocabularies93 and further transferred to DrugBank ID from the DrugBank database (v4.3).69 In total, 132768 clinically reported DDIs connecting 732 unique FDA-approved drugs were retained.
Drug–disease network
We collected the known drug indications (drug–disease associations) from several public resources, including repoDB,94 DrugBank (v4.3),69 and DrugCentral95 databases. Compound name, generic name or commercial name of each drugs and disease names were standardized by Medical Subject Headings (MeSH) and Unified Medical Language System (UMLS) vocabularies.93 In total, 1208 drug–disease pairs connecting 732 drugs and 440 diseases were used in this study.
Drug-side effect network
We collected the clinically reported drug side effects or adverse drug event (ADE) information by assembling data from MetaADEDB,96 CTD,97 SIDER (version 2),98 and OFFSIDES.99 Only ADE data with clinically reported evidence were used. All drugs and ADE items in MetaADEDB were annotated using MeSH and UMLS vocabularies, and duplicated drug–ADE associations were excluded. In total, 263805 drug–ADE associations collecting 732 approved drugs and 12904 ADEs were used in this study.
Chemical similarity analysis of drug pairs
We downloaded chemical structure information (SMILES format) from the DrugBank database and computed MACCS fingerprints of each drug using Open Babel v2.3.1.100 If two drug molecules have a and b bits set in their MACCS fragment bit-strings, with c of these bits being set in the fingerprints of both drugs, the Tanimoto coefficient (T) of a drug–drug pair is defined as:| |  | (2) |
T is widely used in drug discovery and development,101 offering a value in the range of zero (no bits in common) to one (all bits are the same).
Protein sequence similarity analysis
Data resource.
We downloaded the canonical protein sequences of drug targets (proteins) in Homo sapiens from Uniprot database (http://www.uniprot.org/, June 2017).
Similarity of drug targets.
We calculated the protein sequence similarity Sp(a,b) of two drug targets a and b using the Smith–Waterman algorithm.102 The Smith–Waterman algorithm performs local sequence alignment by comparing segments of all possible lengths and optimizing the similarity measure for determining similar regions between two strings of protein canonical sequences of drug targets.
Similarity of drug pairs.
The overall sequence similarity of the drug targets binding two drugs, A and B, is determined by eqn (3) by averaging all pairs of proteins a and b with a ∈ A and b ∈ B under the condition a ≠ b. This condition ensures that for drugs with common targets, we do not take pairs into account in which a target would be compared to itself.| |  | (3) |
Gene co-expression analysis for drug targets
Data source.
We downloaded the RNA-seq data (RPKM value) across 32 tissues from GTEx V6 release (accessed on April 01, 2016, https://gtexportal.org/home/). For each tissue, we regarded those genes with RPKM ≥ 1 in more than 80% samples as tissue-expressed genes.
Co-expression analysis of drug targets.
To measure the extent to which drug target-coding genes (a and b) associated with the drug-treated diseases are co-expressed, we calculated the Pearson's correlation coefficient (PCC(a,b)) and the corresponding p-value via F-statistics for each pair of drug target-coding genes a and b across 32 human tissues. In order to reduce the noise of co-expression analysis, we mapped PCC(a,b) into the human protein–protein interactome network to build a co-expressed protein–protein interactome network as described previously.103
Co-expression analysis of drug pairs.
The co-expression similarity of the drug target-coding genes associated with two drugs A and B is computed by averaging PCC(a,b) over all pairs of targets a and b with a ∈ A and b ∈ B as below:| |  | (4) |
Gene Ontology (GO) similarity analysis for drug targets
Data source.
The Gene Ontology (GO) annotation for all drug target-coding genes are downloaded (June 2017) from website: http://www.geneontology.org/. We used three types of the experimentally validated or literature-derived evidences: biological processes (BP), molecular function (MF), and cellular component (CC), excluding annotations inferred computationally.
Similarity of drug targets.
The semantic comparison of GO annotations provides quantitative ways to compute similarities between genes and gene products. We computed GO similarity SGO(a,b) for each pair of drug target-coding genes a and b using a graph-based semantic similarity measure algorithm104 implemented in an R package, named GOSemSim.105 In this study, three types of pairwise drug targets' GO similarities were used: BP, MF, and CC.
Similarity of drug pairs.
The overall GO similarity of the drug target-coding genes binding to two drugs A and B is determined by eqn (5), averaging all pairs of drug target-coding genes a and b with a ∈ A and b ∈ B.| |  | (5) |
Here three types of pairwise drugs' GO similarities were used: BP, MF, and CC.
Clinical similarity analysis for drug pairs
Clinical similarities of drug pairs derived from the drug Anatomical Therapeutic Chemical (ATC) classification systems codes have been commonly used to predict new drug targets.96 The ATC codes for all FDA-approved drugs used in this study were downloaded from the DrugBank database (v4.3).69 The kth level drug clinical similarity (Sk) of drugs A and B is defined via the ATC codes as below.| |  | (6) |
where ATCk represents all ATC codes at the kth level. A score SATC(A,B) is used to define the clinical similarity between drugs A and B:| | 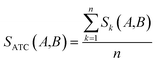 | (7) |
where n represents the five levels of ATC codes (ranging from 1 to 5). Note that drugs can have multiple ATC codes. For example, nicotine (a potent parasympathomimetic stimulant) has four different ATC codes: N07BA01, A11HA01, C04AC01, C10AD02. For a drug with multiple ATC codes, the clinical similarity was computed for each ATC code, and the average clinical similarity was used.
Disease–gene network
We integrated disease–gene annotation data from three commonly used bioinformatics data sources as described below.
OMIM.
The OMIM database (Online Mendelian Inheritance in Man: http://www.omim.org/, June 2017)106 is a comprehensive collection covering literature-curated human disease genes with various high-quality experimental evidences.
CTD.
The Comparative Toxicogenomics Database (http://ctdbase.org/, June 2017)107 provides information about interactions between chemicals and gene products, and their association with various diseases. Here, only manually curated gene–disease interactions from the literatures were used.
HuGE navigator.
HuGE Navigator is an integrated disease candidate gene database based on the core data from PubMed abstracts using text mining algorithms.108 Here, the literature-reported disease–gene annotation data with known PubMed IDs from HuGE Navigator were used (June 2017).
We integrated disease–gene annotation data from 8 different resources and excluded the duplicated entries. We annotated all protein-coding genes using gene Entrez ID, chromosomal location, and the official gene symbols from the NCBI database.92 In total, 23080 disease–genes pairs connecting 440 diseases and 1915 drug targets-coding genes were used in deepDTnet.
Pipeline of deepDTnet
Network embedding.
Fig. 1 illustrates the detailed pipeline of deepDTnet. In total, deepDTnet embeds 15 types of biomedical networks covering chemical, genomic, phenotypic, and cellular profiles. Network embedding is an important method to learn low-dimensional representations of vertexes in networks, aiming to capture and preserve the network structure.109,110 In order to capture rich semantic information, we utilize network embedding to extract low-dimensional features from networks. Intuitively, the low-dimensional vectors obtained from this process encode the relevant biological properties, association information, and topological context of each drug (or target) node in the heterogeneous drug–target–disease network (Table S1†).
DNGR model.
In this study, we used the DNGR embedding model20 to learn features. DNGR model consists of three major steps. First, motivated by the PageRank model used for ranking tasks, it utilizes a random surfing model to capture network information and generate a probabilistic co-occurrence matrix. Next, it calculates the PPMI matrix based on the probabilistic co-occurrence matrix as previously shown.111 Lastly, a stacked denoising autoencoder is used to learn low-dimensional vertex representations (Fig. 2A).
(a) Random surfing.
The vertices of a network are first ordered randomly. Assuming our currently vertex is the i-th vertex, a transition matrix A captures the transition probabilities between different vertices. In this paper, we consider a random surfing model with restart, which introduces a pre-defined restart probability at the initial node for every iteration. It takes both local and global topological connectivity patterns within the network into consideration to fully exploit the underlying direct or indirect relations between nodes. Thus, at each time, there is a probability α that the random surfing procedure will continue, and a probability 1 − α that it will return to the original vertex and restart the procedure, which can be diagonalized as follow:| | | pk = αpk−1A + (1 − α)p0 | (8) |
where pk is a row vector, whose j-th entry indicates the probability of reaching the j-th vertex after k steps of transitions, and p0 is the initial 1-hot vector with the value of the i-th entry being 1 and all other entries being 0. The random surfing step yields a probabilistic co-occurrence matrix.
(b) PPMI matrix.
After yielding the probabilistic co-occurrence matrix, we calculate a shifted positive pointwise mutual information (PPMI) matrix by following Bullinaria and Levy.111 The PPMI matrix can be viewed as a matrix factorization method which factorizes a co-occurrence matrix to yield network representations. The PPMI matrix can be constructed as follow:| |  | (9) |
where M is the original co-occurrence matrix, Nd is the drug number, and Nt is the target number. We assign each negative value to 0.
(c) Stacked denoising autoencoder.
Finally, to investigate the construction of high quality low-dimensional vector representations for vertices from the PPMI matrix that conveys essential structural information of the network, we use a stacked denoising autoencoder (SDAE), which is a popular model used in deep learning, to generate compressed, low-dimensional vectors from the original high-dimensional vertex vectors. This process essentially performs dimension reduction mapping data from a high dimensional space into a lower dimensional space. Denoising autoencoders partially corrupt the input data before taking the training step; adding noise helps a SDAE to learn features that are robust to partial corruption of input data. Specifically, we corrupt each input sample x (a vector) randomly by assigning the entries in the vector to 0 with a certain probability. This idea is analogous to that of modeling missing entries in matrix completion tasks, where the goal is to exploit regularities in the data matrix to recover effectively the complete matrix under certain assumptions. A SDAE model minimizes the regularized problem and tackles reconstruction error, defined as follows:| | 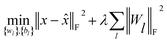 | (10) |
where L is the number of layers, Wl is weight matrix, and bl is bias vector of layer l ∈ {1,…, L} which can be learned by a back-propagation algorithm. λ is a regularization parameter and ‖·‖F denotes the Frobenius norm. The first L/2 layers of the model act as an encoder, and the last L/2 layers act as a decoder. The middle layer is the key that enables SDAE to reduce dimensionality and extract effective representations of side information.
Low rank matrix completion.
Before describing the PU-matrix completion, we first introduce low rank matrix completion and inductive matrix completion. The problem of recovering a matrix from a given subset of its entries arises in many practical problems of interest. The famous Netflix problem of predicting user-movie rating is one example that motivates the traditional matrix completion problem. The low rank matrix completion (MC) is one of the most popular and successful collaborative filtering methods apply to recommender systems.112 The main task is to approximate the rating matrix with a low-rank matrix and to recover an underlying matrix by using the partial observed entities of Pij, the optimization function is defined as follows:| | 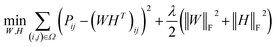 | (11) |
where λ is a regularization parameter and Ω ∈ Nd × Nt is the observed entries from the true underlying matrix. Under the assumption that the matrix is modeled to be low rank, i.e.,  and
and  , and these matrices share a low dimensional latent space, satisfying k ≪ Nd, Nt.
Inductive matrix completion.
Traditional matrix completion is based on the transductive setting. In addition, all matrix completion approaches suffer from extreme sparsity of the observed matrix and the cold-start problem. To alleviate this limitation, an inductive matrix completion (IMC)113 strategy was developed, which can be interpreted as a generalization of the transductive multi-label formulation, and enables us to incorporate side information. This technology was applied to make predictions on gene–disease associations.18 The IMC assumes that the underlying association matrix is generated by applying drug and target feature vectors to a low-rank matrix, which is learned from a training set of drug–target associations, the loss function  measures the deviation between the predictions and observations is formulated as:
| | 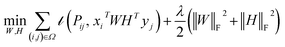 | (12) |
where side information of both entities is given in two matrices:  denotes the feature vector for drug i and
  denotes the feature vector for target j.
PU-matrix completion.
IMC method use the known drug–target interaction as the positive training set A and the unknown drug–target interaction as the negative training set B. However, such kind of classifiers is actually built from a noisy negative set, as there can be unknown drug–target interactions in B itself. In practice, we only observe positive associations between drugs and targets, which means no “negative” entries are sampled. Consequently, this problem is naturally studied in the positive-unlabeled (PU in short) learning framework, where observed and unobserved entries are penalized differently in the objective. Assume the drug–target associations matrix is given as  , where Nd is the number of drugs and Nt is the number of targets. When Pij = 1, infers drug i is linked to target j while zero indicates the relationship is unobserved. After the feature extraction process, we construct a decomposing function to recover a low-rank matrix
  from the known associations matrix P with the form of Z = WHT, where
  and
and  , k ≪ Nd, Nt. The optimization problem of our model is parameterized as:
| |  | (13) |
where the set Ω includes both positive and negative entries, such that Ω = Ω+∪Ω−, let Ω+ denotes the observed samples and Ω− denotes the missing entries chosen as negatives. For biased inductive matrix completion, the value α is the key parameter, which determines the penalty of the unobserved entries toward zero. We set α < 1 because the penalty weights for observed entries must be greater than the missing ones. In our experiment, the biased value α and regulation parameter λ are selected over the grid search. Next, we approximate the likelihood of the pairwise interaction score between drug i and target j as:| | | Score(i,j) = xiWHTyjT | (14) |
where the higher score means a higher possibility that drug i is correlated with target j. The optimization process of hyperparameters is provided in Tables S15 and S16.†
Construction of similarity networks.
For the homogeneous interaction networks (e.g., drug–drug interaction network) and similarity networks (e.g., drug chemical similarity network), we generate the feature representation of each drug or target by directly running the DNGR model on each of these networks. For the association networks, i.e., drug–disease, drug-side-effect, and protein-disease networks, we construct the corresponding similarity networks based on the Jaccard similarity coefficient first, and then run the DNGR model on these similarity networks. Jaccard similarity is a common statistic used for characterizing the similarity and diversity between two sets of samples. Taking the drug–disease association network as an example, we use the following formula to measure the similarity between drug i and drug j:| |  | (15) |
where diseasei denotes the set of diseases of drug i. Then we run the DNGR model on this similarity network to obtain the feature representation of drugs. In the same manner, we can construct the similarity networks of proteins.
Performance evaluation of deepDTnet
Evaluation metrics.
We introduced several evaluation metrics for evaluating performance of drug–target interaction prediction.
PRE is the precision of specific objectives.114
| |  | (16) |
where TP and FP are the number of true positive and false positive samples with respect to a specific objective, respectively. Based on the definition, the larger PRE value represents the better prediction performance.
REC is the recall of specific objectives.114
| |  | (17) |
where FN is the number of false negative samples with respect a specific objective. Based on the definition, the larger REC value represents the better prediction performance.
The area under the receiver operating characteristic (ROC) curve (AUROC)114 is the global prediction performance. The ROC curve is obtained by calculating the true positive rate (TPR) and the false positive rate (FPR) via varying cutoff.
| |  | (18) |
| |  | (19) |
where TN is the number of negative samples correctly identified.
As studied in previous works,115 AUROC is likely to be overly optimistic in the evaluation of the performance of a prediction algorithm, especially on highly skewed data, while area under the Precision Recall (PR) curve (AUPR) can provide a better assessment in this scenario. A precision-recall point is a point with a pair of x and y values in the precision-recall space where x is recall and y is precision. A precision-recall curve is created by connecting all precision-recall points.
Prediction of drug–target interactions.
We performed a 5-fold cross-validation procedure to evaluate the prediction performance of deepDTnet. We built the experimentally validated drug–target network, including 5680 DTIs connecting 732 drugs and 1178 targets. In each fold, 20% of the known interacting drug–target pairs were randomly chosen and a matching number of randomly sampled non-interacting pairs were held out as the test set, and the remaining 80% known interactions and a matching number of randomly sampled non-interacting pairs were used to train the model. Considering the potential bias caused by random sample division for performance evaluation, we repeatedly conduct the experiment 30 times.
Comparison with machine learning approaches
Naive Bayes.
Naive Bayes classifiers are a family of simple “probabilistic classifiers” based on applying Baye's theorem with strong (naive) conditional independence assumptions between every pair of features given the value of the class variable. We used the MATLAB implementation of the Naive Bayes classifier.
Supporting vector machine (SVM).
SVM is based on a statistical learning theory derived from the structural risk minimization principle and Vapnik–Chervonenkis (VC) dimension. A soft margin SVM with radial basis function (RBF) kernel in the Gaussian form was used in our experiment, and the optimal hyperparameters of the SVM (C and λ) were determined by a grid search. We use the MATLAB version of SVM implementation provided in the LIBSVM package.116
k-Nearest neighbors (k-NN).
k-NN is a non-parametric method used for classification and regression, and is based on feature similarity. An object is classified by a majority vote of its neighbors, with the object being assigned to the class most common among its k nearest neighbors. k-NN is a type of instance-based learning, or lazy learning, where the function is only approximated locally and all computation is deferred until classification. We used the MATLAB implementation of the k-NN classifier (k = 3).
Random forest.
Random forest (RF) represents a collection of decision trees, which are grown from bootstrap samples of the training data without pruning, and makes predictions based on majority votes of the ensemble trees. RF takes advantage of Out-of-Bag (OOB) error as an unbiased estimate of generalized test error. We use the MATLAB implementation of the TreeBagger classifier and set the number of trees 100 in our experiment.
Evaluation of bias of degree, chemical and target similarities
Prediction of new targets (or drugs) for known drugs (or targets).
To evaluate the performance of deepDTnet in identifying novel targets for known drugs (drug's cross-validation) or in identifying novel drugs for known targets (target's cross-validation), we also performed two additional 10-fold cross-validation tests. In the first case, the drugs in the experimentally validated drug–target network were split into ten subsets of roughly equal size. Each subset was then taken in turn as a test set. We removed all the associations of the drugs in the test set, so that these drugs can be viewed as novel drugs. Later, we can determine how many associations were discovered by deepDTnet, which may shed light on the capacity to mine novel associations. In the second case, we did the same test with the targets (proteins) in the experimentally validated drug–target network, and deepDTnet also showed good performance in predicting novel targets.
Evaluation of degree bias of drugs or targets in the known drug–target network.
Several network-based methods such as random walk often suffer a common problem, in which high degree nodes may lead to good performance, while low degree nodes have poor performance. deepDTnet applies a novel feature extraction strategy with a deep neural network embedding scheme, which is able to capture the underlying topological properties for nodes with both high and low degree (connectivity) for the heterogeneous drug–gene–disease network. To confirm the effectiveness of our method on this issue, we performed the following two additional validations: (1) we calculated the degree of each drug in the experimentally validated drug–target network and divided the drug nodes into two parts according to the degree of drugs: here the cut-off degree (connectivity) was setup to 5. Then we calculate the AUROC and AUPR of these two parts separately and compare the difference between the results. (2) In the same way, we calculated the degree of each protein and divided the protein nodes into two parts according to the degree of proteins: the cut-off degree we chose 5. Experiments show that the AUROC and AUPR value was close in the above settings with degree above cut-off versus degree below cut-off, which demonstrated that deepDTnet was robust against degree bias of networks.
Evaluation of chemical similarity bias and protein sequence similarity bias.
Traditional chemoinformatics and bioinformatics approaches often show high performance for drugs with high chemical similarities or targets with high protein similarities based on similarity principles. Here we evaluated the performance influences of bias of chemical similarities or target similarities. In the chemical similarity bias experiment, we calculated the average similarity of each drug node according to the drug chemical similarity, and then dividing the drug nodes into two parts according to the median of each node's average similarity. The median value in the experiment is 0.3372. In the protein similarity bias experiment, we did the experiment in the same way, which we calculated the average similarity of each protein node according to the protein sequence similarity matrix, and then dividing the protein nodes into two parts according to the median of each node's average similarity. The median value here is 0.1510.
Reagents
In total, 18 compounds, including bexarotene, tazarotene, progesterone, daunorubicin, colchicine, norethindrone, epirubicin, fenofibrate, mycophenolic acid, ethynodiol diacetate, mitoxantrone, lovastatin, rosiglitazone, bezafibrate, topotecan, disulfiram, amcinonide, and spironolactone, are purchased from Target Molecule Corporation (Boston, MA). Stock solutions of topotecan were prepared in sterile water. All other compounds are dissolved in dimethyl sulfoxide.
ROR-γt-LBD expression and purification
Key resources used in this study are provided in Table S18.† The ligand binding domains (LBD, 262–518) of human ROR-γt is PCR-amplified from pCDNA2-FLAG-ROR-γt (kindly provided by Prof. Dan R. Littman, New York University) and cloned into pET15b (Novagen, Madison, WI) with an N-terminal 6× His tag for expression in BL21 (DE3). The expression and purification of recombinant ROR-γt-LBD is performed as described previously.56 In brief, the cells are grown at 37 °C in LB media supplemented with ampicillin (50 μg mL−1). At the OD600 of 1, protein expression is induced for an additional 20 h at 16 °C by adding 0.2 mM isopropyl β-D-1-thiogalactopyranoside (IPTG). The cells are harvested by centrifugation at 3500 rpm for 30 min and resuspended in lysis buffer A (20 mM Tris pH 7.0, 200 mM NaCl, 4% glycerol). Then the suspension is lysed by sonication and centrifuged at 12000 rpm for 30 min at 4 °C. The supernatant is loaded on the Ni-NTA His-Bind column which is pre-equilibrated with buffer A and washed with buffer B (20 mM Tris pH 7.0, 200 mM NaCl, 4% glycerol, 100 mM imidazole) until no non-specific unbound protein is detected. ROR-γt-LBD is eluted with buffer C (20 mM Tris pH 7.0, 200 mM NaCl, 4% glycerol, 500 mM imidazole). The purified proteins are dialyzed against buffer D (20 mM Tris pH 7.0, 200 mM NaCl, 4% glycerol, 5 mM DTT) and concentrated by using 10 kDa centrifugal filters from Merck Millipore (KGaA of Darmstadt, Germany). Protein samples are subjected to SDS-PAGE and protein concentration is measured by BCA method.
Homogeneous time resolved fluorescence (HTRF) assay
The homogeneous HTRF assay is conducted with 6× His tag ROR-γt-LBD and biotin labelled cofactor peptide as described previously with minor modifications.56 Briefly, ROR-γt-LBD is prepared as described above and the SRC1–2 peptide (sequence CPSSHSSLTERHKILHRLLQEGSPS) is biotinylated at the N terminus (GL Biochem Ltd). Europium-labelled anti-His antibody and XL665-labelled streptavidin are purchased from Cisbio bioassays (Codolet, France). The HTRF reaction contains 100 nM ROR-γt-LBD, 100 nM SRC1–2 peptide, 0.5 nM Eu-labelled anti-His antibody and 41.67 nM XL665-labelled streptavidin according to manufacturer's instructions. Assay buffer contains 20 mM Tris (pH = 7), 200 mM NaCl, 5 mM dithiothreitol (DTT) and 4% glycerol. The mixtures are incubated 2 h at room temperature, and fluorescence intensity is measured on an EnVision Multilabel Plate Reader (PerkinElmer, Waltham, MA) with excitation at 330 nm and emission at 620 nm and 665 nm. The ratio of intensity at 665 nm/620 nm is used to calculate cofactor recruitment activity.
Luciferase reporter assay
ROR-γt luciferase reporter assay is performed as described previously.117 293T cell was widely used in ROR-γt luciferase reporter assay to evaluate potential ROR-γt inhibitor.118,119 ROR-γt-LBD (97–516) is PCR-amplified from pCDNA2-FLAG-ROR-γt and cloned into pFN11A (BIND) (Promega, Madison, WI) harboring a yeast Gal4 DNA-binding domain (Gal4-DBD). 293T cells are co-transfected with 2 μg pGL4.35 vector (Promega, Madison, WI), a luciferase reporter containing GAL4 DNA-binding sequences and 2 μg pFN11A (BIND)-Gal4-ROR-γt-LBD using Lipofectamine 2000 (Invitrogen, Carlsbad, CA) in 6 cm dish. After 20 h, compounds at indicated concentrations are incubated with 293T cells for an additional 24 h. Then, cells are washed twice with ice-cold PBS and lysed with passive lysis buffer. Dual-Glo® Reagent (Promega, Madison, WI) is added to each well and chemiluminescence is determined using an EnVision Multilabel Plate Reader (PerkinElmer, Waltham, MA).
Cell viability assay
293T cells are obtained from the American Type Culture Collection (Manassas, VA) and cultured in Dulbecco's Modified Eagle Medium (DMEM) medium supplemented with 10% fetal bovine serum (FBS, Gibco, Waltham, MA), 100 unit/mL penicillin and 100 μg mL−1 streptomycin at 37 °C in a humidified incubator with 5% CO2. To assess cytotoxicity, 293T cells are seeded in 96-well plates at the density of 5 × 10⁴ cells per well and then incubated with varied concentrations of topotecan for 24 h. Cell viability is measured by MTT assay. Cell survival is assessed as percentage of absorbance relative to that of untreated cells.
High-performance liquid chromatography (HPLC)
In brief, topotecan (5 μL, 20 mM) is incubated with human recombinant ROR-γt-LBD protein (5 mL, 1 mg mL−1) for 2 h at 4 °C. Ni-NTA beads are used to capture the complex of topotecan and ROR-γt-LBD, and the bound topotecan is extracted by organic solvent. The mixture is centrifuged to remove precipitate (10000 g for 10 min at 4 °C). An aliquot of the supernatant is injected on an Agilent Eclipse plus C-18 column (4.6 mm × 100 mm, 3.5 μm particle size) in an Agilent HPLC system (1260 infinity) and detected at 260 nm. The mobile phase is a mixture of methanol and 0.1% H3PO4 (35:65) with a flow rate of 1 mL min−1.
Circular dichroism
Circular dichroism (CD) analysis of the interaction of TPT and ROR-γt-LBD is performed as described previously.120,121 Briefly, TPT (5 μL, 10 mM in sterile water) is incubated with recombinant ROR-γt-LBD protein (1 mL, 1 mg mL−1) for 2 h at 4 °C. The CD spectra (200–260 nm) is scanned using a chirascan circular dichroism spectrometer (Applied PhotoPhysics, United Kingdom) with a step size of 1 nm at 20 °C. Three independent spectral scans are collected and representative data are presented.
Fluorescence quenching assay
Fluorescence quenching assay was performed as previously reported.122 In briefly, ROR-γt-LBD (30 μM) was incubated with increasing concentrations of TPT (10 μM to 50 μM) for 30 min. The fluorescence emission (290–500 nm) was recorded with an excitation wavelength of 280 nm. Fluorescence spectra were detected using a Cary Eclipse fluorescence spectrophotometer (Agilent Technologies, CA, USA). The Ka of topotecan-ROR-γt complex was calculated from fluorescence quenching data according to the following modified Stern–Volmer equation:46
| log(Fo − F)/F = logKa + nlog[L] |
where n is the Hill coefficient, Fo = fluorescence intensity of values of the protein (ROR-γt-LBD), F = fluorescence intensity of protein in the presence of quencher (topotecan), L = concentration of ligand (topotecan). The values for binding constant (Ka) and number of binding sites were derived from the Y-axis intercept and slope, respectively.
Molecular docking
The three-dimensional (3D) structure of topotecan is framed by Chem 3D ultra 12.0 software (ChemOffice; Cambridge Soft Corporation, US, 2010). The crystal structure of the ROR-γt in complex with a synthetic partial agonists GSK2435341A is retrieved from the Protein Data Bank (PDB code: 4XT9). All the water molecules and bound ligands in the ROR-γt structure are removed. Topotecan is docked into the ligand binding pocket of ROR-γt by using AutoDock Vina (The Scripps Research Institute, CA, USA).123 The best-scored binding conformation of topotecan and ROR-γt is selected by the scoring system to assess the interaction mode. The docking results are displayed by PyMOL software (https://www.pymol.org/).
Pharmacokinetic evaluation
All mouse experiments were performed at East China University of Science and Technology (Shanghai, China) and were approved by the Institutional Animal Care and Use Committee of Shanghai. Male C57BL/6 mice (6–8 weeks) are purchased from the National Rodent Laboratory Animal Resources. The mice were injected i.p. with 10 mg kg−1 of topotecan dissolved in water (volume 5 mL kg−1). Blood and brain samples were collected at 0.17, 0.5, 1, 2, 4, 8, 12 and 24 h after injection. Brain samples were homogenized in precooled normal saline before analysis. An aliquot of plasma (40 μL) or brain homogenate (300 μL) was added with 10 μL of irinotecan (internal standard, IS) working solution (500 ng mL−1) and 600 μL of acetonitrile. These mixtures were vacuum dried at 50 °C for 90 min (Labconco CentriVap, USA), and the dried extract was reconstituted with 100 μL of water/acetonitrile (90:10 v/v, 0.1% formic acid). After centrifugation, a 2 μL aliquot of supernatant was analyzed by HPLC-MS/MS on Thermo Scientific Q Exactive Focus hydrid quadrupole-orbitrap mass spectrometer (USA). The pharmacokinetic parameters were calculated using Phoenix WinNonlin 7.0 software (Pharsight, Mountain View, CA, USA).
Target occupancy assay
An in vivo receptor occupancy assay was performed using HPLC-MS/MS methodology.121,124,127 T0901317 (ref. 56), an orthosteric ligand of ROR-γt, was used as the tracer for assessing target occupancy. The mice were pre-injected i.p. with 10 mg kg−1 of topotecan dissolved in water (volume 5 mL kg−1). After 10 min pretreatment, mice were then injected i.p. with T0901317 (5 mg kg−1). Blood and brain samples were collected at 30 min after the second injection and the HPLC-MS/MS detection of T0901317 was performed using gliclazide as an internal standard.
Experimental autoimmune encephalomyelitis (EAE) induction
C57BL/6 mice are purchased from the National Rodent Laboratory Animal Resources. EAE mouse model is induced as described previously.125,126 In brief, female C57BL/6 mice (8–12 weeks old) are subcutaneously immunized with 300 μg MOG35–55 (amino acids 35–55, MEVGWYRSPFSROVHLYRNGK; GL biochem) in an equal amount of Complete Freund's adjuvant (including M. tuberculosis H37Ra extract 1 mg mL−1) on days 0. Pertussis toxin (100 ng per mouse) is intraperitoneally administered on days 0 and 2. The onset and severity of EAE are recorded daily by two independent researchers using the following scale system: (0) no clinical sign; (1) limp tail or waddling gait with tail tonicity; (2) wobbly gait; (3) hindlimb paralysis; (4) hindlimb and forelimb paralysis; (5) death.40 Animals with scores of 3 and up are provided access to food and water at the bottom of the cage. Topotecan (10 mg kg−1) or vehicle (sterile water) is administered to mice by intraperitoneal injection on day 11 post immunization every four days. The mouse body weight is measured every day.
ELISA
IL-17 production in spinal cords and brain is detected using commercially available ELISA kit (Neobioscience) according to the manufacturer's instructions.
In vivo imaging
In vivo optical imaging is performed using IVIS Spectrum CT Imaging System (PerkinElmer, Inc. USA). In order to eliminate the influence of autofluorescence and light scattering caused by fur, all the mice are shaved before the experiments. Mice are administered with avertin anesthesia in all imaging experiments. Myelination is imaged using 3,3-diethylthiatricarbocyanine iodide (DBT), a near-infrared dye that readily enters the brain and specifically binds to myelinated fibers.54 Briefly, mouse is intravenously injected with DBT (0.5 mg kg−1, 100 μL PBS) through the tail vein and image acquisition is performed at 4 min post-injection.53 The settings are Epi-FI, Ex740/Em790, binning 8, FStop 2, FOV D, height 1.50. Blood–brain barrier permeability is evaluated using Cy5.5 labeled bovine serum albumin (BSA-Cy5.5) with bright near infrared fluorescence as described previously.53 In brief, mouse is intravenously injected with BSA-Cy5.5 at a dosage of 50 mg kg−1 and optical imaging is carried out at approximately 6 h post-injection. The settings are Epi-FI, Ex660/Em720, binning 8, FStop 2, FOV D, lamp level high, height 1.50.
Histological analysis
Mice are subjected to PBS-perfusion and spinal cords are fixed in 10% formalin, followed by embedding in paraffin.127 Spinal cords sections are stained with hematoxylin and eosin (H&E) and with Luxol fast blue (LFB) to evaluate inflammation and demyelination, respectively. To assess toxicity of TPT in EAE mice, the organ sections from vehicle- or TPT-treat EAE mice are stained with H&E staining. All tissue sections are 5 μm thick.
Statistical analysis
The data shown in the study were obtained from at least three independent experiments; all data in different experimental groups were expressed as the mean ± standard deviation (SD). Comparisons between two groups are performed using Student's t-test (GraphPad Prism Software, San Diego, CA). P < 0.05 is considered statistically significant.
Code availability
The code for deepDTnet is available at https://github.com/ChengF-Lab/deepDTnet.
Data availability
All data used in this study are available at https://github.com/ChengF-Lab/deepDTnet.
Author contributions
F. C. conceived the study. Z. X., S. Z., and F. C., developed the codes and performed all computational experiments. L. W., J. H., and L. Z., performed experimental validation and data analysis. F. C., Y. Z., Y. H., H. G., J. F., B. D. T., L. L., N. R., and J. L. performed data analysis. F. C., S. Z., X. Z., W. L., C. E., and J. L. wrote and critically revised the manuscript with contributions from other co-authors.
Conflicts of interest
The conflict of interest is managed by the Conflict of Interest Committee of Cleveland Clinic in accordance with its conflict of interest policies. JL is a co-founder of Scipher Medicine, Inc. FC is an inventor on a pending US patent application for this network-based, deep learning technology. The other authors declare no competing interests.
Acknowledgements
This work was supported by the National Heart, Lung, and Blood Institute of the National Institutes of Health under Award Number K99HL138272 and R00HL138272 to F. C.; the National Institutes of Neurological Diseases of the National Institutes of Health under Award Number R3509730 to B. D. T.; and National Institutes of Health grants HL61795, HG007690, and HL119145 to J. L., and AHA grant 2017D007382 to J. L. This work has been also supported in part with Federal funds from the Frederick National Laboratory for Cancer Research, National Institutes of Health, under contract HHSN261200800001E. This research was supported (in part) by the Intramural Research Program of NIH, Frederick National Lab, Center for Cancer Research. The content of this publication does not necessarily reflect the views or policies of the Department of Health and Human Services, nor does mention of trade names, commercial products or organizations imply endorsement by the US Government. B. D. T. is the Morris and Ruth Grahame Endowed Chair in Biomedical Research at the Lerner Research Institute, Cleveland Clinic. C. E. is the Sondra J. and Stephen R. Hardis Endowed Chair of Cancer Genomic Medicine at the Cleveland Clinic and an ACS Clinical Research Professor.
References
- J. Avorn and N. Engl, J. Med., 2015, 372, 1877–1879 CAS.
- F. Pammolli, L. Magazzini and M. Riccaboni, Nat. Rev. Drug Discovery, 2011, 10, 428–438 CrossRef CAS PubMed.
- C. A. MacRae, D. M. Roden and J. Loscalzo, Circulation, 2016, 133, 2610–2617 CrossRef PubMed.
- F. Cheng, I. A. Kovacs and A. L. Barabasi, Nat. Commun., 2019, 10, 1197 CrossRef PubMed.
- F. Cheng, R. J. Desai, D. E. Handy, R. Wang, S. Schneeweiss, A. L. Barabasi and J. Loscalzo, Nat. Commun., 2018, 9, 2691 CrossRef PubMed.
- J. A. Greene and J. Loscalzo, N. Engl. J. Med., 2017, 377, 2493–2499 CrossRef PubMed.
- R. Santos, O. Ursu, A. Gaulton, A. P. Bento, R. S. Donadi, C. G. Bologa, A. Karlsson, B. Al-Lazikani, A. Hersey, T. I. Oprea and J. P. Overington, Nat. Rev. Drug Discovery, 2017, 16, 19–34 CrossRef CAS PubMed.
- M. J. Keiser, V. Setola, J. J. Irwin, C. Laggner, A. I. Abbas, S. J. Hufeisen, N. H. Jensen, M. B. Kuijer, R. C. Matos, T. B. Tran, R. Whaley, R. A. Glennon, J. Hert, K. L. Thomas, D. D. Edwards, B. K. Shoichet and B. L. Roth, Nature, 2009, 462, 175–181 CrossRef CAS PubMed.
- M. Campillos, M. Kuhn, A. C. Gavin, L. J. Jensen and P. Bork, Science, 2008, 321, 263–266 CrossRef CAS PubMed.
- F. Cheng, C. Liu, J. Jiang, W. Lu, W. Li, G. Liu, W. Zhou, J. Huang and Y. Tang, PLoS Comput. Biol., 2012, 8, e1002503 CrossRef CAS PubMed.
- F. Cheng, Methods Mol. Biol., 2019, 1878, 243–261 CrossRef CAS PubMed.
- Z. Xia, L. Y. Wu, X. Zhou and S. T. Wong, BMC Syst. Biol., 2010, 4(suppl. 2), S6 CrossRef PubMed.
- M. Gonen, Bioinformatics, 2012, 28, 2304–2310 CrossRef PubMed.
- F. Iorio, R. Bosotti, E. Scacheri, V. Belcastro, P. Mithbaokar, R. Ferriero, L. Murino, R. Tagliaferri, N. Brunetti-Pierri, A. Isacchi and D. di Bernardo, Proc. Natl. Acad. Sci. U. S. A., 2010, 107, 14621–14626 CrossRef CAS PubMed.
- F. Cheng, W. Lu, C. Liu, J. Fang, Y. Hou, D. E. Handy, R. Wang, Y. Zhao, Y. Yang, J. Huang, D. E. Hill, M. Vidal, C. Eng and J. Loscalzo, Nat. Commun., 2019, 10, 3476 CrossRef PubMed.
- M. A. Yildirim, K. I. Goh, M. E. Cusick, A. L. Barabasi and M. Vidal, Nat. Biotechnol., 2007, 25, 1119–1126 CrossRef CAS PubMed.
- Y. Luo, X. Zhao, J. Zhou, J. Yang, Y. Zhang, W. Kuang, J. Peng, L. Chen and J. Zeng, Nat. Commun., 2017, 8, 573 CrossRef PubMed.
- N. Nagarajan and I. S. Dhillon, Bioinformatics, 2014, 30, i60–i68 CrossRef PubMed.
- F. Wan, L. Hong, A. Xiao, T. Jiang and J. Zeng, Bioinformatics, 2019, 35, 104–111 CrossRef CAS PubMed.
-
S. S. Cao, W. Lu and Q. K. Xu, Thirtieth Aaai Conference on Artificial Intelligence, 2016, pp. 1145–1152 Search PubMed.
- C. J. Hsieh, N. Natarajan and I. Dhillon, Comput. Sci., 2014, 2445–2453 Search PubMed.
-
N. Natarajan, N. Rao and I. Dhillon, 2015 LEEE 6th International Workshop on Computational Advances in Multi-Sensor Adaptive Processing (Camsap), 2015, pp. 37–40 Search PubMed.
- F. Cheng, Y. Zhou, W. Li, G. Liu and Y. Tang, PLoS One, 2012, 7, e41064 CrossRef CAS PubMed.
- O. Ursu, J. Holmes, C. G. Bologa, J. J. Yang, S. L. Mathias, V. Stathias, D. T. Nguyen, S. Schurer and T. Oprea, Nucleic Acids Res., 2018, 47, D963–D970 CrossRef PubMed.
- L. van der Maaten and G. Hinton, J. Mach. Learn. Res., 2008, 9, 2579–2605 Search PubMed.
- F. Cheng, W. Li, X. Wang, Y. Zhou, Z. Wu, J. Shen and Y. Tang, J. Chem. Inf. Model., 2013, 53, 744–752 CrossRef CAS PubMed.
- E. Lounkine, M. J. Keiser, S. Whitebread, D. Mikhailov, J. Hamon, J. L. Jenkins, P. Lavan, E. Weber, A. K. Doak, S. Cote, B. K. Shoichet and L. Urban, Nature, 2012, 486, 361–367 CrossRef CAS PubMed.
- D. Kurnik, M. Muszkat, C. Li, G. G. Sofowora, J. Solus, H. G. Xie, P. A. Harris, L. Jiang, C. McMunn, P. Ihrie, E. P. Dawson, S. M. Williams, A. J. Wood and C. M. Stein, Clin. Pharmacol. Ther., 2006, 79, 173–185 CrossRef CAS PubMed.
- V. Tikhonoff, S. Hasenkamp, T. Kuznetsova, L. Thijs, Y. Jin, T. Richart, H. Zhang, S. M. Brand-Herrmann, E. Brand, E. Casiglia and J. Staessen, J. Hum. Hypertens., 2008, 22, 864–867 CAS.
- J. H. Lewis, Expert Rev. Gastroenterol. Hepatol., 2010, 4, 13–29 CrossRef CAS PubMed.
- A. D. Brinker, A. C. Mackey and R. Prizont, N. Engl. J. Med., 2004, 351, 1361–1364 CAS ; discussion 1361–1364.
- I. Halder, M. F. Muldoon, R. E. Ferrell and S. B. Manuck, Metab. Syndr. Relat. Disord., 2007, 5, 323–330 CrossRef CAS PubMed.
- J. D. West, E. J. Carrier, N. C. Bloodworth, A. K. Schroer, P. Chen, L. M. Ryzhova, S. Gladson, S. Shay, J. D. Hutcheson and W. D. Merryman, PLoS One, 2016, 11, e0148657 CrossRef PubMed.
- V. B. Piatto, T. B. Carvalho, N. S. De Marchi, F. D. Molina and J. V. Maniglia, Brazilian Journal of Otorhinolaryngology, 2011, 77, 348–355 CrossRef PubMed.
- H. Gronemeyer, J. A. Gustafsson and V. Laudet, Nat. Rev. Drug Discovery, 2004, 3, 950–964 CrossRef CAS PubMed.
- T. Hirose, R. J. Smith and A. M. Jetten, Biochem. Biophys. Res. Commun., 1994, 205, 1976–1983 CrossRef CAS PubMed.
- S. M. Bronner, J. R. Zbieg and J. J. Crawford, Expert Opin. Ther. Pat., 2017, 27, 101–112 CrossRef CAS PubMed.
- T. Tanaka and L. M. De Luca, Cancer Res., 2009, 69, 4945–4947 CrossRef CAS PubMed.
- J. Sun, W. Dou, Y. Zhao and J. Hu, Immunopharmacol. Immunotoxicol., 2014, 36, 17–24 CrossRef CAS PubMed.
- X. Hu, Y. Wang, L. Y. Hao, X. Liu, C. A. Lesch, B. M. Sanchez, J. M. Wendling, R. W. Morgan, T. D. Aicher, L. L. Carter, P. L. Toogood and G. D. Glick, Nat. Chem. Biol., 2015, 11, 141–147 CrossRef CAS PubMed.
- V. Perissi and M. G. Rosenfeld, Nat. Rev. Mol. Cell Biol., 2005, 6, 542–554 CrossRef CAS PubMed.
- N. Kumar, L. A. Solt, J. J. Conkright, Y. Wang, M. A. Istrate, S. A. Busby, R. D. Garcia-Ordonez, T. P. Burris and P. R. Griffin, Mol. Pharmacol., 2010, 77, 228–236 CrossRef CAS PubMed.
- A. Rodger, R. Marrington, D. Roper and S. Windsor, Methods Mol. Biol., 2005, 305, 343–364 CAS.
- Y. Zhang, X. Y. Luo, D. H. Wu and Y. Xu, Acta Pharmacol. Sin., 2015, 36, 71–87 CrossRef CAS PubMed.
- C. Bodenreider, D. Beer, T. H. Keller, S. Sonntag, D. Wen, L. Yap, Y. H. Yau, S. G. Shochat, D. Huang, T. Zhou, A. Caflisch, X. C. Su, K. Ozawa, G. Otting, S. G. Vasudevan, J. Lescar and S. P. Lim, Anal. Biochem., 2009, 395, 195–204 CrossRef CAS PubMed.
- P. Khan, S. Rahman, S. Manzoor, A. Queen and M. I. Hassan, Sci. Rep., 2017, 7, 9470 CrossRef PubMed.
- D. M. Hartung, D. N. Bourdette, S. M. Ahmed and R. H. Whitham, Neurology, 2015, 84, 2185–2192 CrossRef PubMed.
- G. Eberl, Mucosal Immunol., 2017, 10, 27–34 CrossRef CAS PubMed.
- H. S. Huang, J. A. Allen, A. M. Mabb, I. F. King, J. Miriyala, B. Taylor-Blake, N. Sciaky, J. W. Dutton Jr, H. M. Lee, X. Chen, J. Jin, A. S. Bridges, M. J. Zylka, B. L. Roth and B. D. Philpot, Nature, 2011, 481, 185–189 CrossRef PubMed.
- C. S. Constantinescu, N. Farooqi, K. O'Brien and B. Gran, Br. J. Pharmacol., 2011, 164, 1079–1106 CrossRef CAS PubMed.
- D. J. Daugherty, V. Selvaraj, O. V. Chechneva, X. B. Liu, D. E. Pleasure and W. Deng, EMBO Mol. Med., 2013, 5, 891–903 CrossRef CAS PubMed.
- J. Bennett, J. Basivireddy, A. Kollar, K. E. Biron, P. Reickmann, W. A. Jefferies and S. McQuaid, J. Neuroimmunol., 2010, 229, 180–191 CrossRef CAS PubMed.
- K. Schmitz, N. de Bruin, P. Bishay, J. Mannich, A. Haussler, C. Altmann, N. Ferreiros, J. Lotsch, A. Ultsch, M. J. Parnham, G. Geisslinger and I. Tegeder, EMBO Mol. Med., 2014, 6, 1398–1422 CrossRef CAS PubMed.
- C. Wang, C. Wu, D. C. Popescu, J. Zhu, W. B. Macklin, R. H. Miller and Y. Wang, J. Neurosci., 2011, 31, 2382–2390 CrossRef CAS PubMed.
- C. Dong, Cell Res., 2014, 24, 901–903 CrossRef CAS PubMed.
- M. Scheepstra, S. Leysen, G. C. van Almen, J. R. Miller, J. Piesvaux, V. Kutilek, H. van Eenennaam, H. Zhang, K. Barr, S. Nagpal, S. M. Soisson, M. Kornienko, K. Wiley, N. Elsen, S. Sharma, C. C. Correll, B. W. Trotter, M. van der Stelt, A. Oubrie, C. Ottmann, G. Parthasarathy and L. Brunsveld, Nat. Commun., 2015, 6, 8833 CrossRef PubMed.
- M. Liljevald, M. Rehnberg, M. Soderberg, M. Ramnegard, J. Borjesson, D. Luciani, N. Krutrok, L. Branden, C. Johansson, X. Xu, M. Bjursell, A. K. Sjogren, J. Hornberg, U. Andersson, D. Keeling and J. Jirholt, Autoimmun. Rev., 2016, 15, 1062–1070 CrossRef CAS PubMed.
- S. M. Blaney, D. E. Cole, F. M. Balis, K. Godwin and D. G. Poplack, Cancer Res., 1993, 53, 725–727 CAS.
- S. J. Khoury, C. R. Guttmann, E. J. Orav, R. Kikinis, F. A. Jolesz and H. L. Weiner, Arch. Neurol., 2000, 57, 1183–1189 CrossRef CAS PubMed.
- J. Wang, Z. Guo, Y. Fu, Z. Wu, C. Huang, C. Zheng, P. A. Shar, Z. Wang, W. Xiao and Y. Wang, Briefings Bioinf., 2017, 18, 321–332 CAS.
- S. Ohlson, Drug Discovery Today, 2008, 13, 433–439 CrossRef CAS PubMed.
- T. Pahikkala, A. Airola, S. Pietila, S. Shakyawar, A. Szwajda, J. Tang and T. Aittokallio, Briefings Bioinf., 2015, 16, 325–337 CrossRef CAS PubMed.
- A. B. Keenan, S. L. Jenkins, K. M. Jagodnik, S. Koplev, E. He, D. Torre, Z. Wang, A. B. Dohlman, M. C. Silverstein, A. Lachmann, M. V. Kuleshov, A. Ma'ayan, V. Stathias, R. Terryn, D. Cooper, M. Forlin, A. Koleti, D. Vidovic, C. Chung, S. C. Schurer, J. Vasiliauskas, M. Pilarczyk, B. Shamsaei, M. Fazel, Y. Ren, W. Niu, N. A. Clark, S. White, N. Mahi, L. Zhang, M. Kouril, J. F. Reichard, S. Sivaganesan, M. Medvedovic, J. Meller, R. J. Koch, M. R. Birtwistle, R. Iyengar, E. A. Sobie, E. U. Azeloglu, J. Kaye, J. Osterloh, K. Haston, J. Kalra, S. Finkbiener, J. Li, P. Milani, M. Adam, R. Escalante-Chong, K. Sachs, A. Lenail, D. Ramamoorthy, E. Fraenkel, G. Daigle, U. Hussain, A. Coye, J. Rothstein, D. Sareen, L. Ornelas, M. Banuelos, B. Mandefro, R. Ho, C. N. Svendsen, R. G. Lim, J. Stocksdale, M. S. Casale, T. G. Thompson, J. Wu, L. M. Thompson, V. Dardov, V. Venkatraman, A. Matlock, J. E. Van Eyk, J. D. Jaffe, M. Papanastasiou, A. Subramanian, T. R. Golub, S. D. Erickson, M. Fallahi-Sichani, M. Hafner, N. S. Gray, J. R. Lin, C. E. Mills, J. L. Muhlich, M. Niepel, C. E. Shamu, E. H. Williams, D. Wrobel, P. K. Sorger, L. M. Heiser, J. W. Gray, J. E. Korkola, G. B. Mills, M. LaBarge, H. S. Feiler, M. A. Dane, E. Bucher, M. Nederlof, D. Sudar, S. Gross, D. F. Kilburn, R. Smith, K. Devlin, R. Margolis, L. Derr, A. Lee and A. Pillai, Cell Syst., 2018, 6, 13–24 CrossRef CAS PubMed.
- J. K. Huang, D. E. Carlin, M. K. Yu, W. Zhang, J. F. Kreisberg, P. Tamayo and T. Ideker, Cell Syst., 2018, 6, 484–495 CrossRef CAS PubMed.
- D. Turei, T. Korcsmaros and J. Saez-Rodriguez, Nat. Methods, 2016, 13, 966–967 CrossRef CAS PubMed.
- J. Simm, G. Klambauer, A. Arany, M. Steijaert, J. K. Wegner, E. Gustin, V. Chupakhin, Y. T. Chong, J. Vialard, P. Buijnsters, I. Velter, A. Vapirev, S. Singh, A. E. Carpenter, R. Wuyts, S. Hochreiter, Y. Moreau and H. Ceulemans, Cell Chem. Biol., 2018, 25, 611–618 CrossRef CAS PubMed.
- C. Cai, P. Guo, Y. Zhou, J. Zhou, Q. Wang, F. Zhang, J. Fang and F. Cheng, J. Chem. Inf. Model., 2019, 53, 1073–1084 CrossRef PubMed.
- Y. LeCun, Y. Bengio and G. Hinton, Nature, 2015, 521, 436–444 CrossRef CAS PubMed.
- V. Law, C. Knox, Y. Djoumbou, T. Jewison, A. C. Guo, Y. Liu, A. Maciejewski, D. Arndt, M. Wilson, V. Neveu, A. Tang, G. Gabriel, C. Ly, S. Adamjee, Z. T. Dame, B. Han, Y. Zhou and D. S. Wishart, Nucleic Acids Res., 2014, 42, D1091–D1097 CrossRef CAS PubMed.
- H. Yang, C. Qin, Y. H. Li, L. Tao, J. Zhou, C. Y. Yu, F. Xu, Z. Chen, F. Zhu and Y. Z. Chen, Nucleic Acids Res., 2016, 44, D1069–D1074 CrossRef CAS PubMed.
- T. Hernandez-Boussard, M. Whirl-Carrillo, J. M. Hebert, L. Gong, R. Owen, M. Gong, W. Gor, F. Liu, C. Truong, R. Whaley, M. Woon, T. Zhou, R. B. Altman and T. E. Klein, Nucleic Acids Res., 2008, 36, D913–D918 CrossRef CAS PubMed.
- A. Gaulton, L. J. Bellis, A. P. Bento, J. Chambers, M. Davies, A. Hersey, Y. Light, S. McGlinchey, D. Michalovich, B. Al-Lazikani and J. P. Overington, Nucleic Acids Res., 2012, 40, D1100–D1107 CrossRef CAS PubMed.
- T. Q. Liu, Y. M. Lin, X. Wen, R. N. Jorissen and M. K. Gilson, Nucleic Acids Res., 2007, 35, D198–D201 CrossRef CAS PubMed.
- A. J. Pawson, J. L. Sharman, H. E. Benson, E. Faccenda, S. P. H. Alexander, O. P. Buneman, A. P. Davenport, J. C. McGrath, J. A. Peters, C. Southan, M. Spedding, W. Y. Yu, A. J. Harmar and I. Nc, Nucleic Acids Res., 2014, 42, D1098–D1106 CrossRef CAS PubMed.
- R. Apweiler, A. Bairoch, C. H. Wu, W. C. Barker, B. Boeckmann, S. Ferro, E. Gasteiger, H. Z. Huang, R. Lopez, M. Magrane, M. J. Martin, D. A. Natale, C. O'Donovan, N. Redaschi and L. S. L. Yeh, Nucleic Acids Res., 2004, 32, D115–D119 CrossRef CAS PubMed.
- T. Rolland, M. Tasan, B. Charloteaux, S. J. Pevzner, Q. Zhong, N. Sahni, S. Yi, I. Lemmens, C. Fontanillo, R. Mosca, A. Kamburov, S. D. Ghiassian, X. Yang, L. Ghamsari, D. Balcha, B. E. Begg, P. Braun, M. Brehme, M. P. Broly, A. R. Carvunis, D. Convery-Zupan, R. Corominas, J. Coulombe-Huntington, E. Dann, M. Dreze, A. Dricot, C. Fan, E. Franzosa, F. Gebreab, B. J. Gutierrez, M. F. Hardy, M. Jin, S. Kang, R. Kiros, G. N. Lin, K. Luck, A. MacWilliams, J. Menche, R. R. Murray, A. Palagi, M. M. Poulin, X. Rambout, J. Rasla, P. Reichert, V. Romero, E. Ruyssinck, J. M. Sahalie, A. Scholz, A. A. Shah, A. Sharma, Y. Shen, K. Spirohn, S. Tam, A. O. Tejeda, S. A. Trigg, J. C. Twizere, K. Vega, J. Walsh, M. E. Cusick, Y. Xia, A. L. Barabasi, L. M. Iakoucheva, P. Aloy, J. De Las Rivas, J. Tavernier, M. A. Calderwood, D. E. Hill, T. Hao, F. P. Roth and M. Vidal, Cell, 2014, 159, 1212–1226 CrossRef CAS PubMed.
- J. F. Rual, K. Venkatesan, T. Hao, T. Hirozane-Kishikawa, A. Dricot, N. Li, G. F. Berriz, F. D. Gibbons, M. Dreze, N. Ayivi-Guedehoussou, N. Klitgord, C. Simon, M. Boxem, S. Milstein, J. Rosenberg, D. S. Goldberg, L. V. Zhang, S. L. Wong, G. Franklin, S. Li, J. S. Albala, J. Lim, C. Fraughton, E. Llamosas, S. Cevik, C. Bex, P. Lamesch, R. S. Sikorski, J. Vandenhaute, H. Y. Zoghbi, A. Smolyar, S. Bosak, R. Sequerra, L. Doucette-Stamm, M. E. Cusick, D. E. Hill, F. P. Roth and M. Vidal, Nature, 2005, 437, 1173–1178 CrossRef CAS PubMed.
- T. S. Keshava Prasad, R. Goel, K. Kandasamy, S. Keerthikumar, S. Kumar, S. Mathivanan, D. Telikicherla, R. Raju, B. Shafreen, A. Venugopal, L. Balakrishnan, A. Marimuthu, S. Banerjee, D. S. Somanathan, A. Sebastian, S. Rani, S. Ray, C. J. Harrys Kishore, S. Kanth, M. Ahmed, M. K. Kashyap, R. Mohmood, Y. L. Ramachandra, V. Krishna, B. A. Rahiman, S. Mohan, P. Ranganathan, S. Ramabadran, R. Chaerkady and A. Pandey, Nucleic Acids Res., 2009, 37, D767–D772 CrossRef CAS PubMed.
- J. Hu, H. S. Rho, R. H. Newman, J. Zhang, H. Zhu and J. Qian, Bioinformatics, 2014, 30, 141–142 CrossRef CAS PubMed.
- F. Cheng, P. Jia, Q. Wang and Z. Zhao, Oncotarget, 2014, 5, 3697–3710 Search PubMed.
- C. T. Lu, K. Y. Huang, M. G. Su, T. Y. Lee, N. A. Bretana, W. C. Chang, Y. J. Chen, Y. J. Chen and H. D. Huang, Nucleic Acids Res., 2013, 41, D295–D305 CrossRef CAS PubMed.
- P. V. Hornbeck, B. Zhang, B. Murray, J. M. Kornhauser, V. Latham and E. Skrzypek, Nucleic Acids Res., 2015, 43, D512–D520 CrossRef CAS PubMed.
- H. Dinkel, C. Chica, A. Via, C. M. Gould, L. J. Jensen, T. J. Gibson and F. Diella, Nucleic Acids Res., 2011, 39, D261–D267 CrossRef CAS PubMed.
- R. Oughtred, C. Stark, B. J. Breitkreutz, J. Rust, L. Boucher, C. Chang, N. Kolas, L. O'Donnell, G. Leung, R. McAdam, F. Zhang, S. Dolma, A. Willems, J. Coulombe-Huntington, A. Chatr-Aryamontri, K. Dolinski and M. Tyers, Nucleic Acids Res., 2019, 47, D529–d541 CrossRef CAS PubMed.
- M. J. Cowley, M. Pinese, K. S. Kassahn, N. Waddell, J. V. Pearson, S. M. Grimmond, A. V. Biankin, S. Hautaniemi and J. Wu, Nucleic Acids Res., 2012, 40, D862–D865 CrossRef CAS PubMed.
- L. Licata, L. Briganti, D. Peluso, L. Perfetto, M. Iannuccelli, E. Galeota, F. Sacco, A. Palma, A. P. Nardozza, E. Santonico, L. Castagnoli and G. Cesareni, Nucleic Acids Res., 2012, 40, D857–D861 CrossRef CAS PubMed.
- S. Orchard, M. Ammari, B. Aranda, L. Breuza, L. Briganti, F. Broackes-Carter, N. H. Campbell, G. Chavali, C. Chen, N. del-Toro, M. Duesbury, M. Dumousseau, E. Galeota, U. Hinz, M. Iannuccelli, S. Jagannathan, R. Jimenez, J. Khadake, A. Lagreid, L. Licata, R. C. Lovering, B. Meldal, A. N. Melidoni, M. Milagros, D. Peluso, L. Perfetto, P. Porras, A. Raghunath, S. Ricard-Blum, B. Roechert, A. Stutz, M. Tognolli, K. van Roey, G. Cesareni and H. Hermjakob, Nucleic Acids Res., 2014, 42, D358–D363 CrossRef CAS PubMed.
- K. Breuer, A. K. Foroushani, M. R. Laird, C. Chen, A. Sribnaia, R. Lo, G. L. Winsor, R. E. Hancock, F. S. Brinkman and D. J. Lynn, Nucleic Acids Res., 2013, 41, D1228–D1233 CrossRef CAS PubMed.
- M. J. Meyer, J. Das, X. Wang and H. Yu, Bioinformatics, 2013, 29, 1577–1579 CrossRef CAS PubMed.
- E. L. Huttlin, L. Ting, R. J. Bruckner, F. Gebreab, M. P. Gygi, J. Szpyt, S. Tam, G. Zarraga, G. Colby, K. Baltier, R. Dong, V. Guarani, L. P. Vaites, A. Ordureau, R. Rad, B. K. Erickson, M. Wuhr, J. Chick, B. Zhai, D. Kolippakkam, J. Mintseris, R. A. Obar, T. Harris, S. Artavanis-Tsakonas, M. E. Sowa, P. De Camilli, J. A. Paulo, J. W. Harper and S. P. Gygi, Cell, 2015, 162, 425–440 CrossRef CAS PubMed.
- L. Csabai, M. Olbei, A. Budd, T. Korcsmaros and D. Fazekas, Methods Mol. Biol., 2018, 1819, 53–73 CrossRef CAS PubMed.
- N. R. Coordinators, Nucleic Acids Res., 2016, 44, D7–D19 CrossRef PubMed.
- O. Bodenreider, Nucleic Acids Res., 2004, 32, D267–D270 CrossRef CAS PubMed.
- A. S. Brown and C. J. Patel, Sci. Data, 2017, 4, 170029 CrossRef PubMed.
- O. Ursu, J. Holmes, J. Knockel, C. G. Bologa, J. J. Yang, S. L. Mathias, S. J. Nelson and T. I. Oprea, Nucleic Acids Res., 2017, 45, D932–D939 CrossRef CAS PubMed.
- F. Cheng, W. Li, Z. Wu, X. Wang, C. Zhang, J. Li, G. Liu and Y. Tang, J. Chem. Inf. Model., 2013, 53, 753–762 CrossRef CAS PubMed.
- A. P. Davis, B. L. King, S. Mockus, C. G. Murphy, C. Saraceni-Richards, M. Rosenstein, T. Wiegers and C. J. Mattingly, Nucleic Acids Res., 2011, 39, D1067–D1072 CrossRef CAS PubMed.
- N. P. Tatonetti, P. P. Ye, R. Daneshjou and R. B. Altman, Sci. Transl. Med., 2012, 4, 125ra131 Search PubMed.
- M. Kuhn, M. Campillos, I. Letunic, L. J. Jensen and P. Bork, Mol. Syst. Biol., 2010, 6, 343 CrossRef PubMed.
- N. M. O'Boyle, M. Banck, C. A. James, C. Morley, T. Vandermeersch and G. R. Hutchison, J. Cheminf., 2011, 3, 33 Search PubMed.
- P. Willett, Drug discovery today, 2006, 11, 1046–1053 CrossRef CAS PubMed.
- T. F. Smith and M. S. Waterman, J. Mol. Biol., 1981, 147, 195–197 CrossRef CAS PubMed.
- F. Cheng, P. Jia, Q. Wang, C. C. Lin, W. H. Li and Z. Zhao, Mol. Biol. Evol., 2014, 31, 2156–2169 CrossRef CAS PubMed.
- J. Z. Wang, Z. Du, R. Payattakool, P. S. Yu and C. F. Chen, Bioinformatics, 2007, 23, 1274–1281 CrossRef CAS PubMed.
- G. Yu, F. Li, Y. Qin, X. Bo, Y. Wu and S. Wang, Bioinformatics, 2010, 26, 976–978 CrossRef CAS PubMed.
- J. S. Amberger, C. A. Bocchini, F. Schiettecatte, A. F. Scott and A. Hamosh, Nucleic Acids Res., 2015, 43, D789–D798 CrossRef PubMed.
- A. P. Davis, C. J. Grondin, K. Lennon-Hopkins, C. Saraceni-Richards, D. Sciaky, B. L. King, T. C. Wiegers and C. J. Mattingly, Nucleic Acids Res., 2015, 43, D914–D920 CrossRef CAS PubMed.
- W. Yu, M. Gwinn, M. Clyne, A. Yesupriya and M. J. Khoury, Nat. Genet., 2008, 40, 124–125 CrossRef CAS PubMed.
-
B. Perozzi, R. Al-Rfou and S. Skiena, Proceedings of the 20th ACM SIGKDD international conference on Knowledge discovery and data mining, 2014, pp. 701–710 Search PubMed.
-
J. Tang, M. Qu, M. Z. Wang, M. Zhang, J. Yan and Q. Z. Mei, Proceedings of the 24th International Conference on World Wide Web, International World Wide Web Conferences Steering Committee, 2015, pp. 1067–1077 Search PubMed.
- J. A. Bullinaria and J. P. Levy, Behav. Res. Methods, 2007, 39, 510–526 CrossRef PubMed.
- Y. Koren, R. Bell and C. Volinsky, IEEE Comput. Soc. Press, 2009, 42, 30–37 Search PubMed.
-
P. Jain and I. S. Dhillon, Provable Inductive Matrix Completion, arXiv preprint, arXiv:1306.0626, 2013.
- D. M. W. Powers, J. Mach. Learn. Technol., 2011, 2, 37–63 Search PubMed.
-
J. Davis and M. Goadrich, Proceedings of the 23rd International Conference on Machine Learning, 2006, 06, pp. 233–240 Search PubMed.
- C.-C. Chang and C.-J. Lin, ACM Trans. Intell. Syst. Technol., 2011, 2, 1–27 CrossRef.
- P. Soroosh, J. Wu, X. Xue, J. Song, S. W. Sutton, M. Sablad, J. Yu, M. I. Nelen, X. Liu, G. Castro, R. Luna, S. Crawford, H. Banie, R. A. Dandridge, X. Deng, A. Bittner, C. Kuei, M. Tootoonchi, N. Rozenkrants, K. Herman, J. Gao, X. V. Yang, K. Sachen, K. Ngo, W. P. Fung-Leung, S. Nguyen, A. de Leon-Tabaldo, J. Blevitt, Y. Zhang, M. D. Cummings, T. Rao, N. S. Mani, C. Liu, M. McKinnon, M. E. Milla, A. M. Fourie and S. Sun, Proc. Natl. Acad. Sci. U. S. A., 2014, 111, 12163–12168 CrossRef CAS PubMed.
- X. Hu, Y. Wang, L.-Y. Hao, X. Liu, C. A. Lesch, B. M. Sanchez, J. M. Wendling, R. W. Morgan, T. D. Aicher and L. L. Carter, Nat. Chem. Biol., 2015, 11, 141 CrossRef CAS PubMed.
- W. Huang, B. Thomas, R. A. Flynn, S. J. Gavzy, L. Wu, S. V. Kim, J. A. Hall, E. R. Miraldi, C. P. Ng and F. Rigo, Nature, 2015, 528, 517 CrossRef CAS PubMed.
- S. K. Kolluri, X. Zhu, X. Zhou, B. Lin, Y. Chen, K. Sun, X. Tian, J. Town, X. Cao, F. Lin, D. Zhai, S. Kitada, F. Luciano, E. O'Donnell, Y. Cao, F. He, J. Lin, J. C. Reed, A. C. Satterthwait and X. K. Zhang, Cancer Cell, 2008, 14, 285–298 CrossRef CAS PubMed.
- M. Hu, Q. Luo, G. Alitongbieke, S. Chong, C. Xu, L. Xie, X. Chen, D. Zhang, Y. Zhou, Z. Wang, X. Ye, L. Cai, F. Zhang, H. Chen, F. Jiang, H. Fang, S. Yang, J. Liu, M. T. Diaz-Meco, Y. Su, H. Zhou, J. Moscat, X. Lin and X. K. Zhang, Mol. Cell, 2017, 66, 141–153 CrossRef CAS PubMed.
- X. Du, H. Chen, J. Liu, B. Zhao, D. Huang, G. Li, Q. Xu, Y. Zhan, M. Zhang, B. C. Weimer, D. Chen, Z. Cheng, L. Zhang, Q. Li, S. Li, Z. Zheng, S. Song, Y. Huang, Z. Ye, W. Su, S. C. Lin, Y. Shen and Q. Wu, Nat. Chem. Biol., 2008, 4, 548–556 CrossRef PubMed.
- O. Trott and A. J. Olson, J. Comput. Chem., 2010, 31, 455–461 CAS.
-
C. D. Jesudason, S. DuBois, M. Johnson, V. N. Barth, and A. B. Need, In Vivo Receptor Occupancy in Rodents by LC-MS/MS, Eli Lilly & Company and the National Center for Advancing Translational Sciences, 2004 Search PubMed.
- T. Xu, X. Wang, B. Zhong, R. I. Nurieva, S. Ding and C. Dong, J. Biol. Chem., 2011, 286, 22707–22710 CrossRef CAS PubMed.
- S. Xiao, N. Yosef, J. Yang, Y. Wang, L. Zhou, C. Zhu, C. Wu, E. Baloglu, D. Schmidt, R. Ramesh, M. Lobera, M. S. Sundrud, P. Y. Tsai, Z. Xiang, J. Wang, Y. Xu, X. Lin, K. Kretschmer, P. B. Rahl, R. A. Young, Z. Zhong, D. A. Hafler, A. Regev, S. Ghosh, A. Marson and V. K. Kuchroo, Immunity, 2014, 40, 477–489 CrossRef CAS PubMed.
- B. N. Martin, C. Wang, C. J. Zhang, Z. Kang, M. F. Gulen, J. A. Zepp, J. Zhao, G. Bian, J. S. Do, B. Min, P. G. Pavicic Jr, C. El-Sanadi, P. L. Fox, A. Akitsu, Y. Iwakura, A. Sarkar, M. D. Wewers, W. J. Kaiser, E. S. Mocarski, M. E. Rothenberg, A. G. Hise, G. R. Dubyak, R. M. Ransohoff and X. Li, Nat. Immunol., 2016, 17, 583–592 CrossRef CAS PubMed.
Footnotes |
| † Electronic supplementary information (ESI) available. See DOI: 10.1039/c9sc04336e |
| ‡ These authors are joint first authors on this work. |
|
| This journal is © The Royal Society of Chemistry 2020 |
Click here to see how this site uses Cookies. View our privacy policy here. 
 Open Access Article
 This Open Access Article is licensed under a Creative Commons Attribution-Non Commercial 3.0 Unported Licence
 d,
Yadi
Zhou
e,
Jiansong
Fang
e,
Yin
Huang
ef,
Huimin
Guo
f,
Lang
Li
g,
Bruce D.
Trapp
h,
Ruth
Nussinov
d,
Yadi
Zhou
e,
Jiansong
Fang
e,
Yin
Huang
ef,
Huimin
Guo
f,
Lang
Li
g,
Bruce D.
Trapp
h,
Ruth
Nussinov
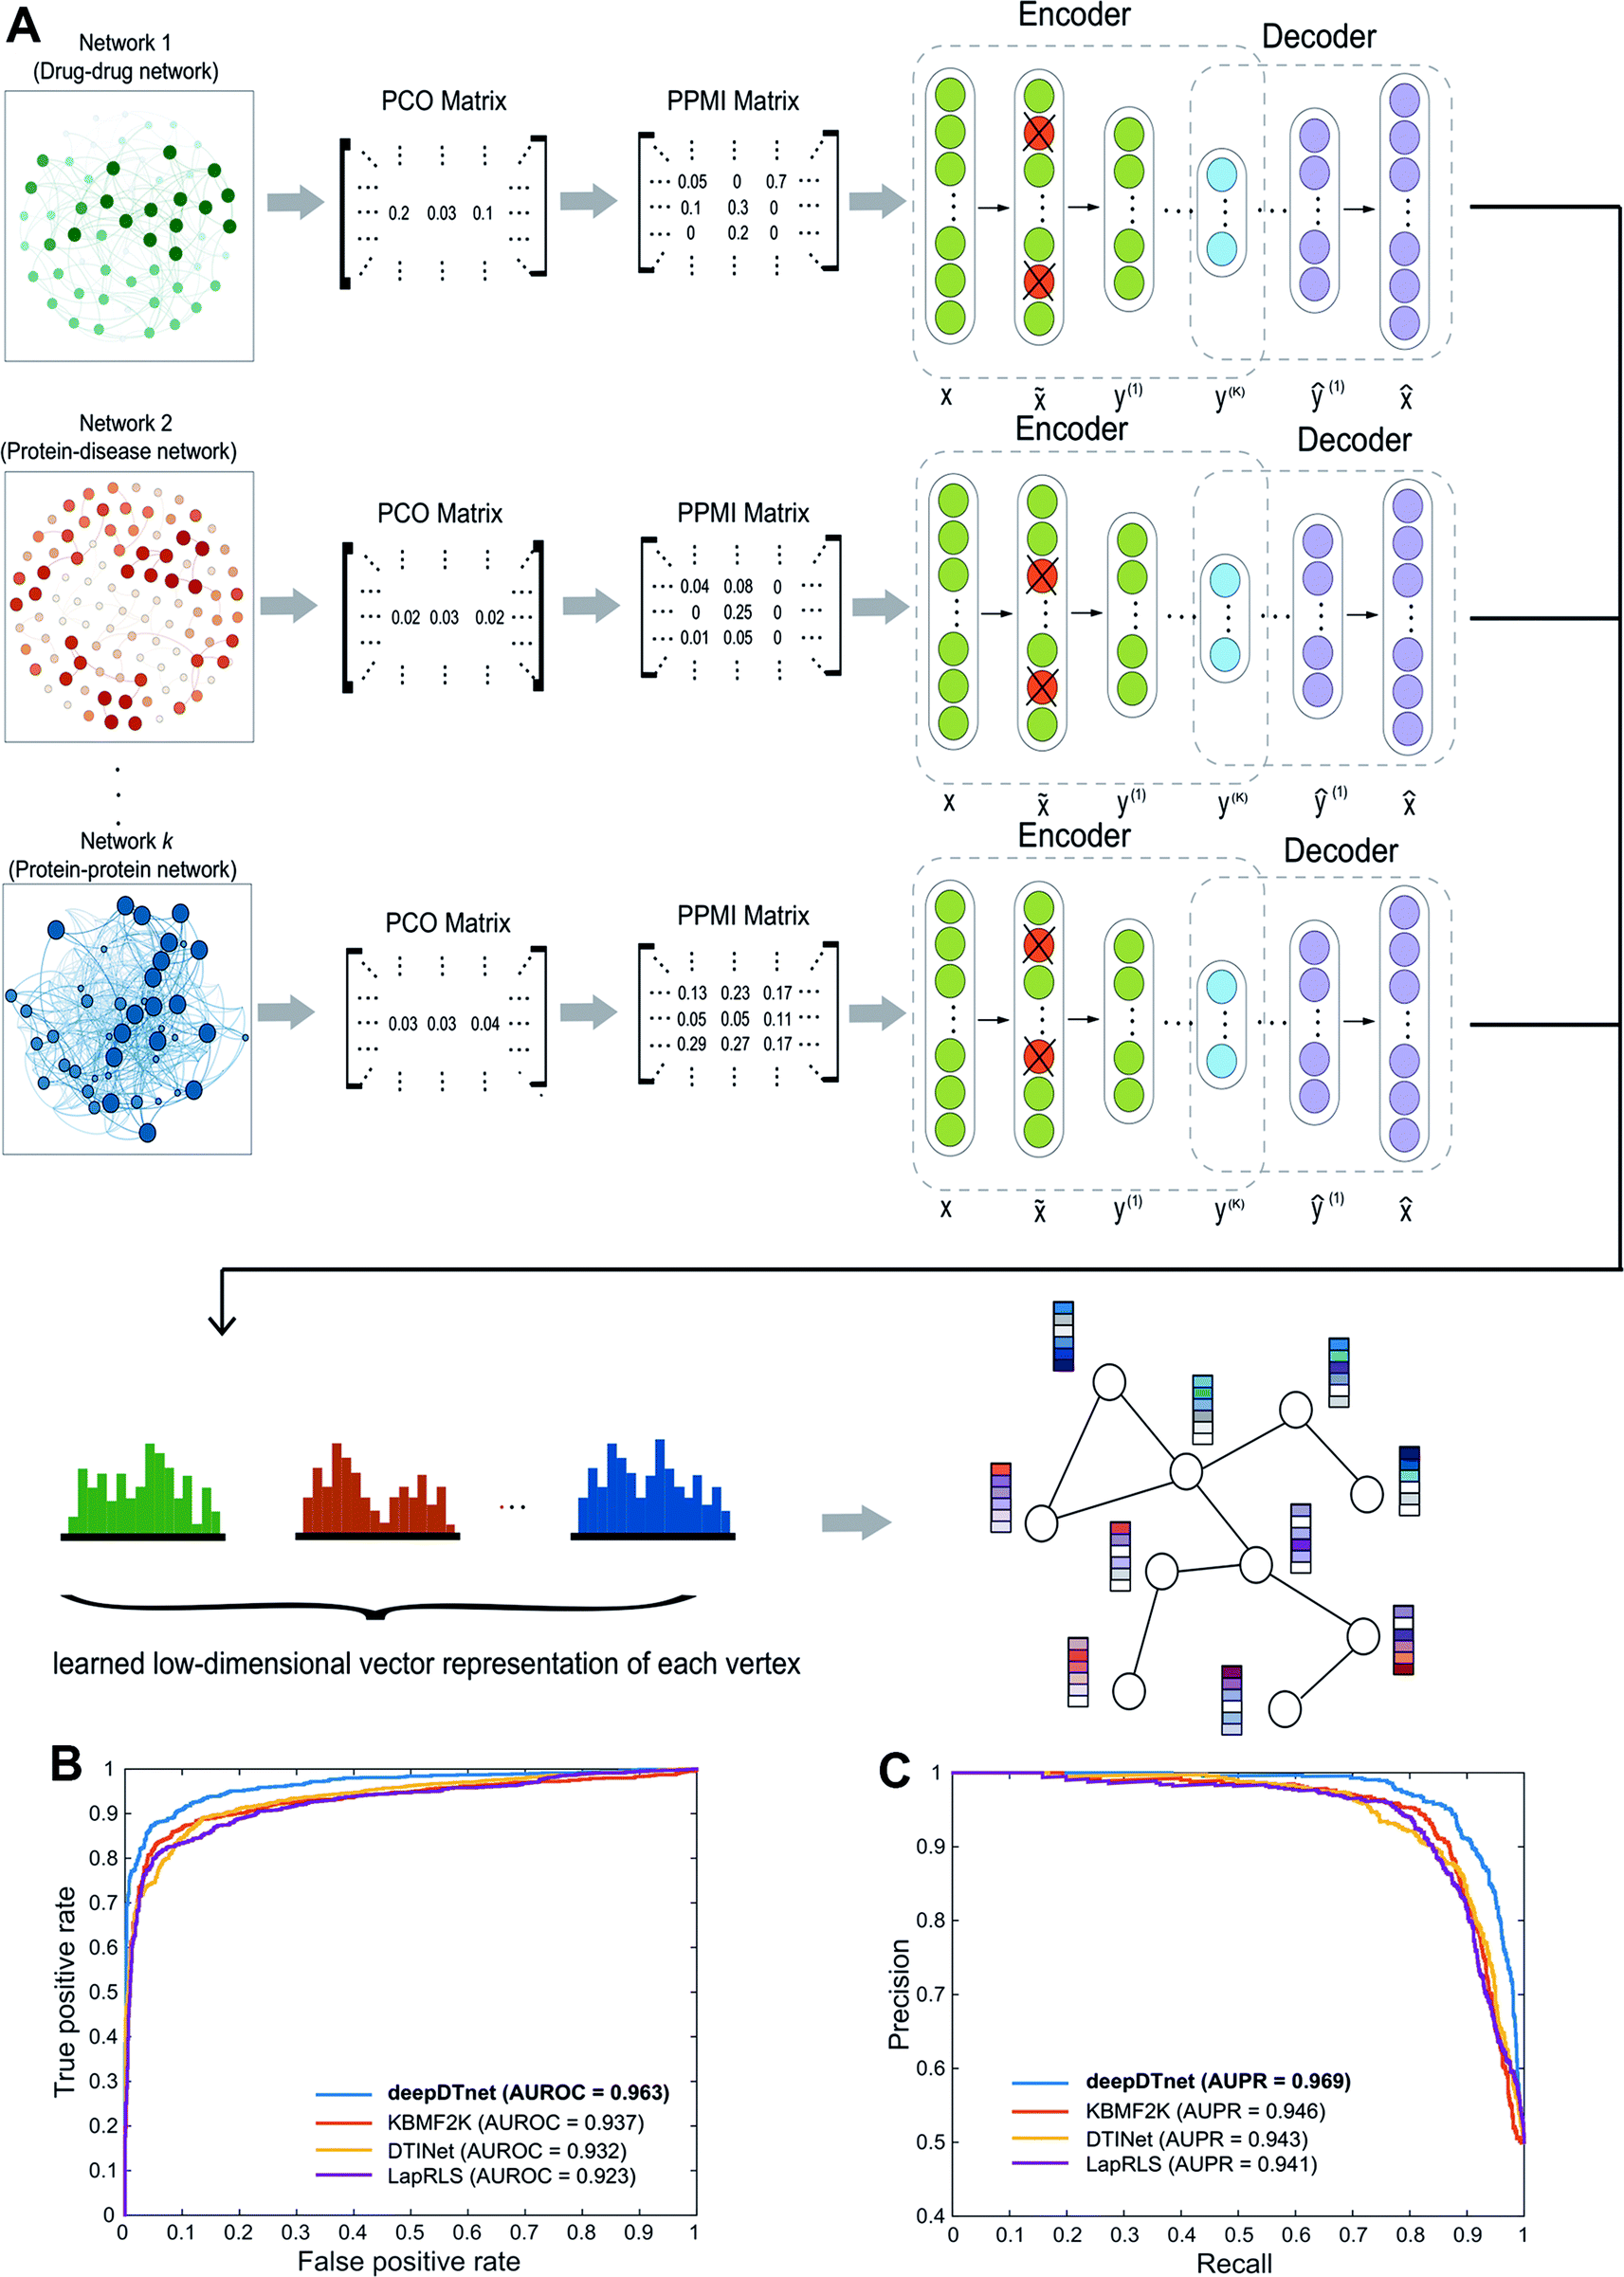
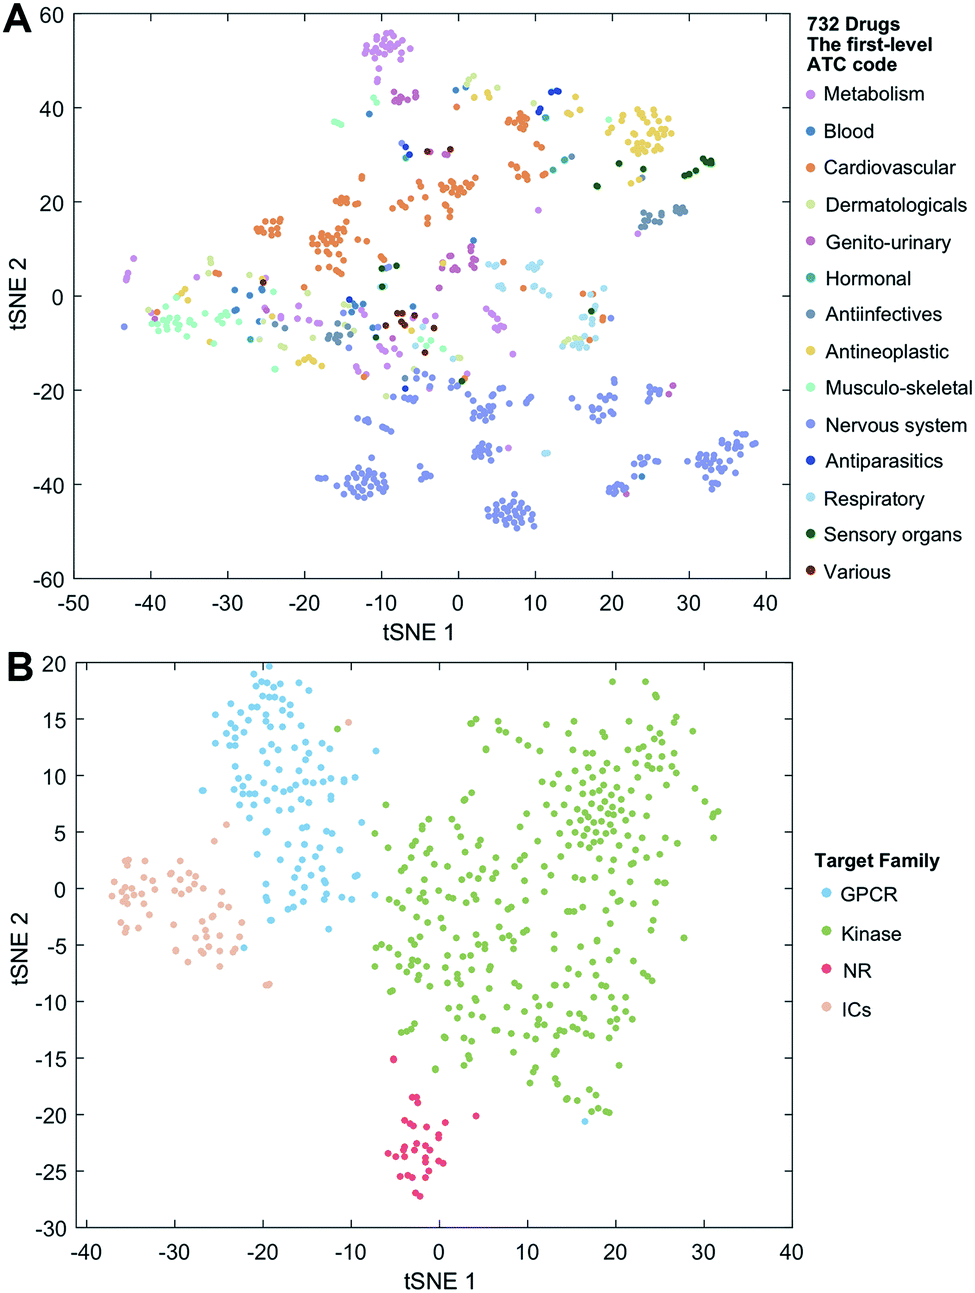
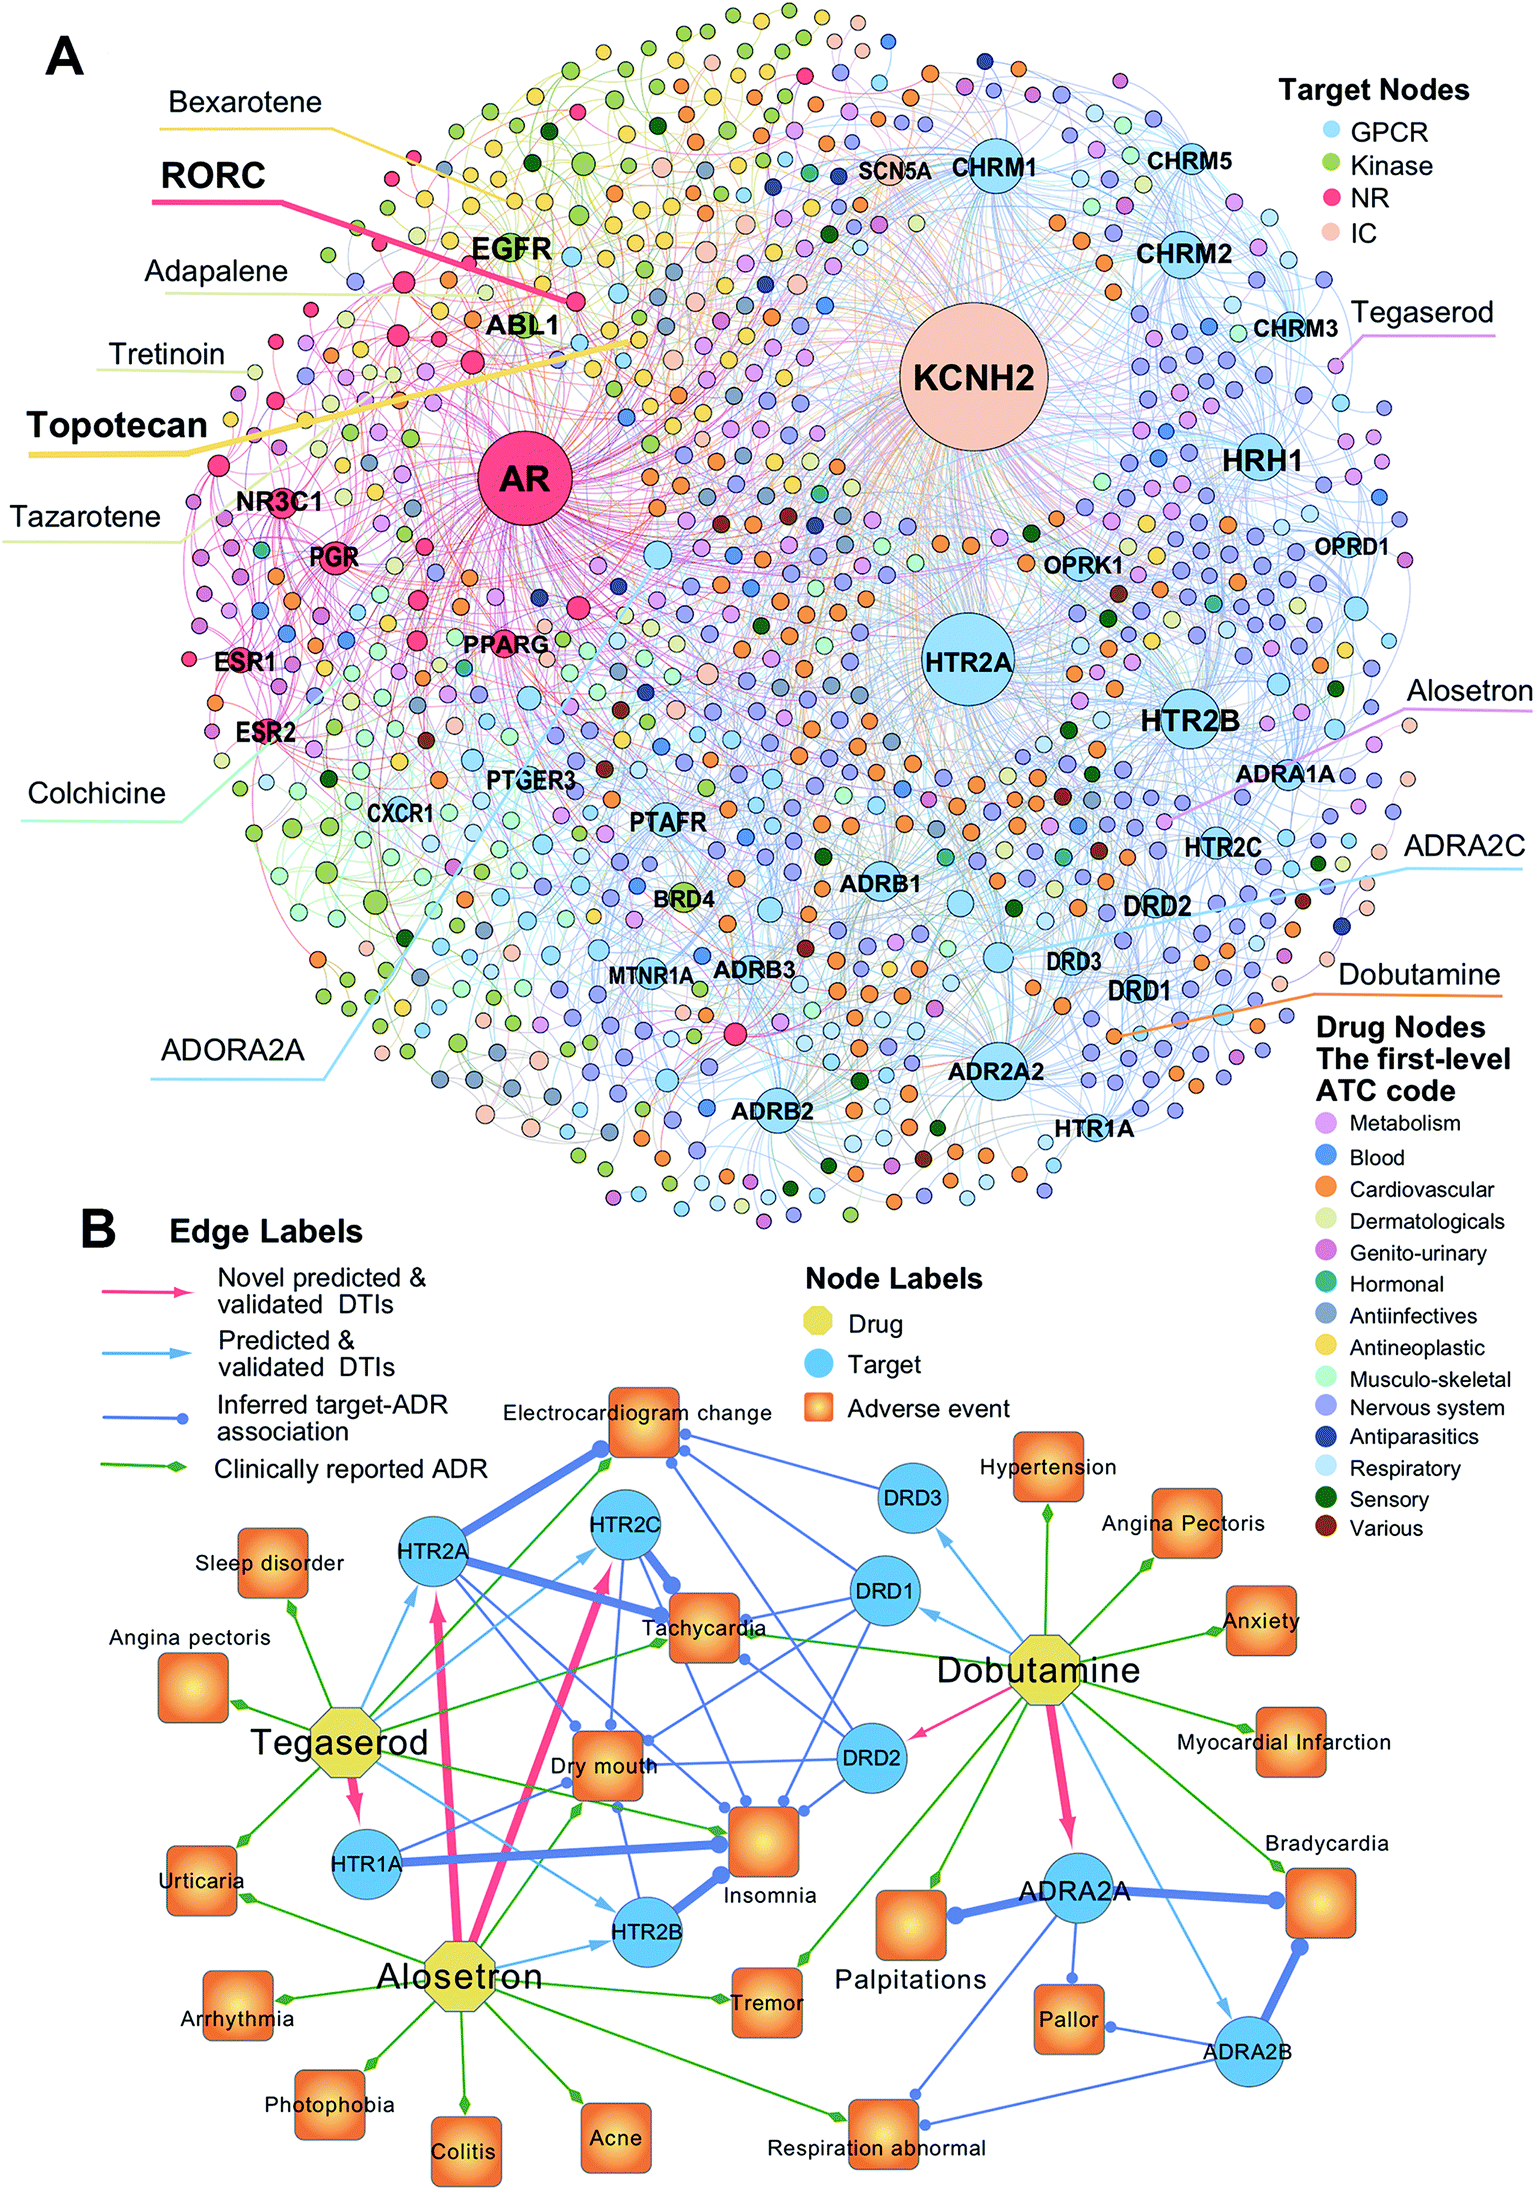
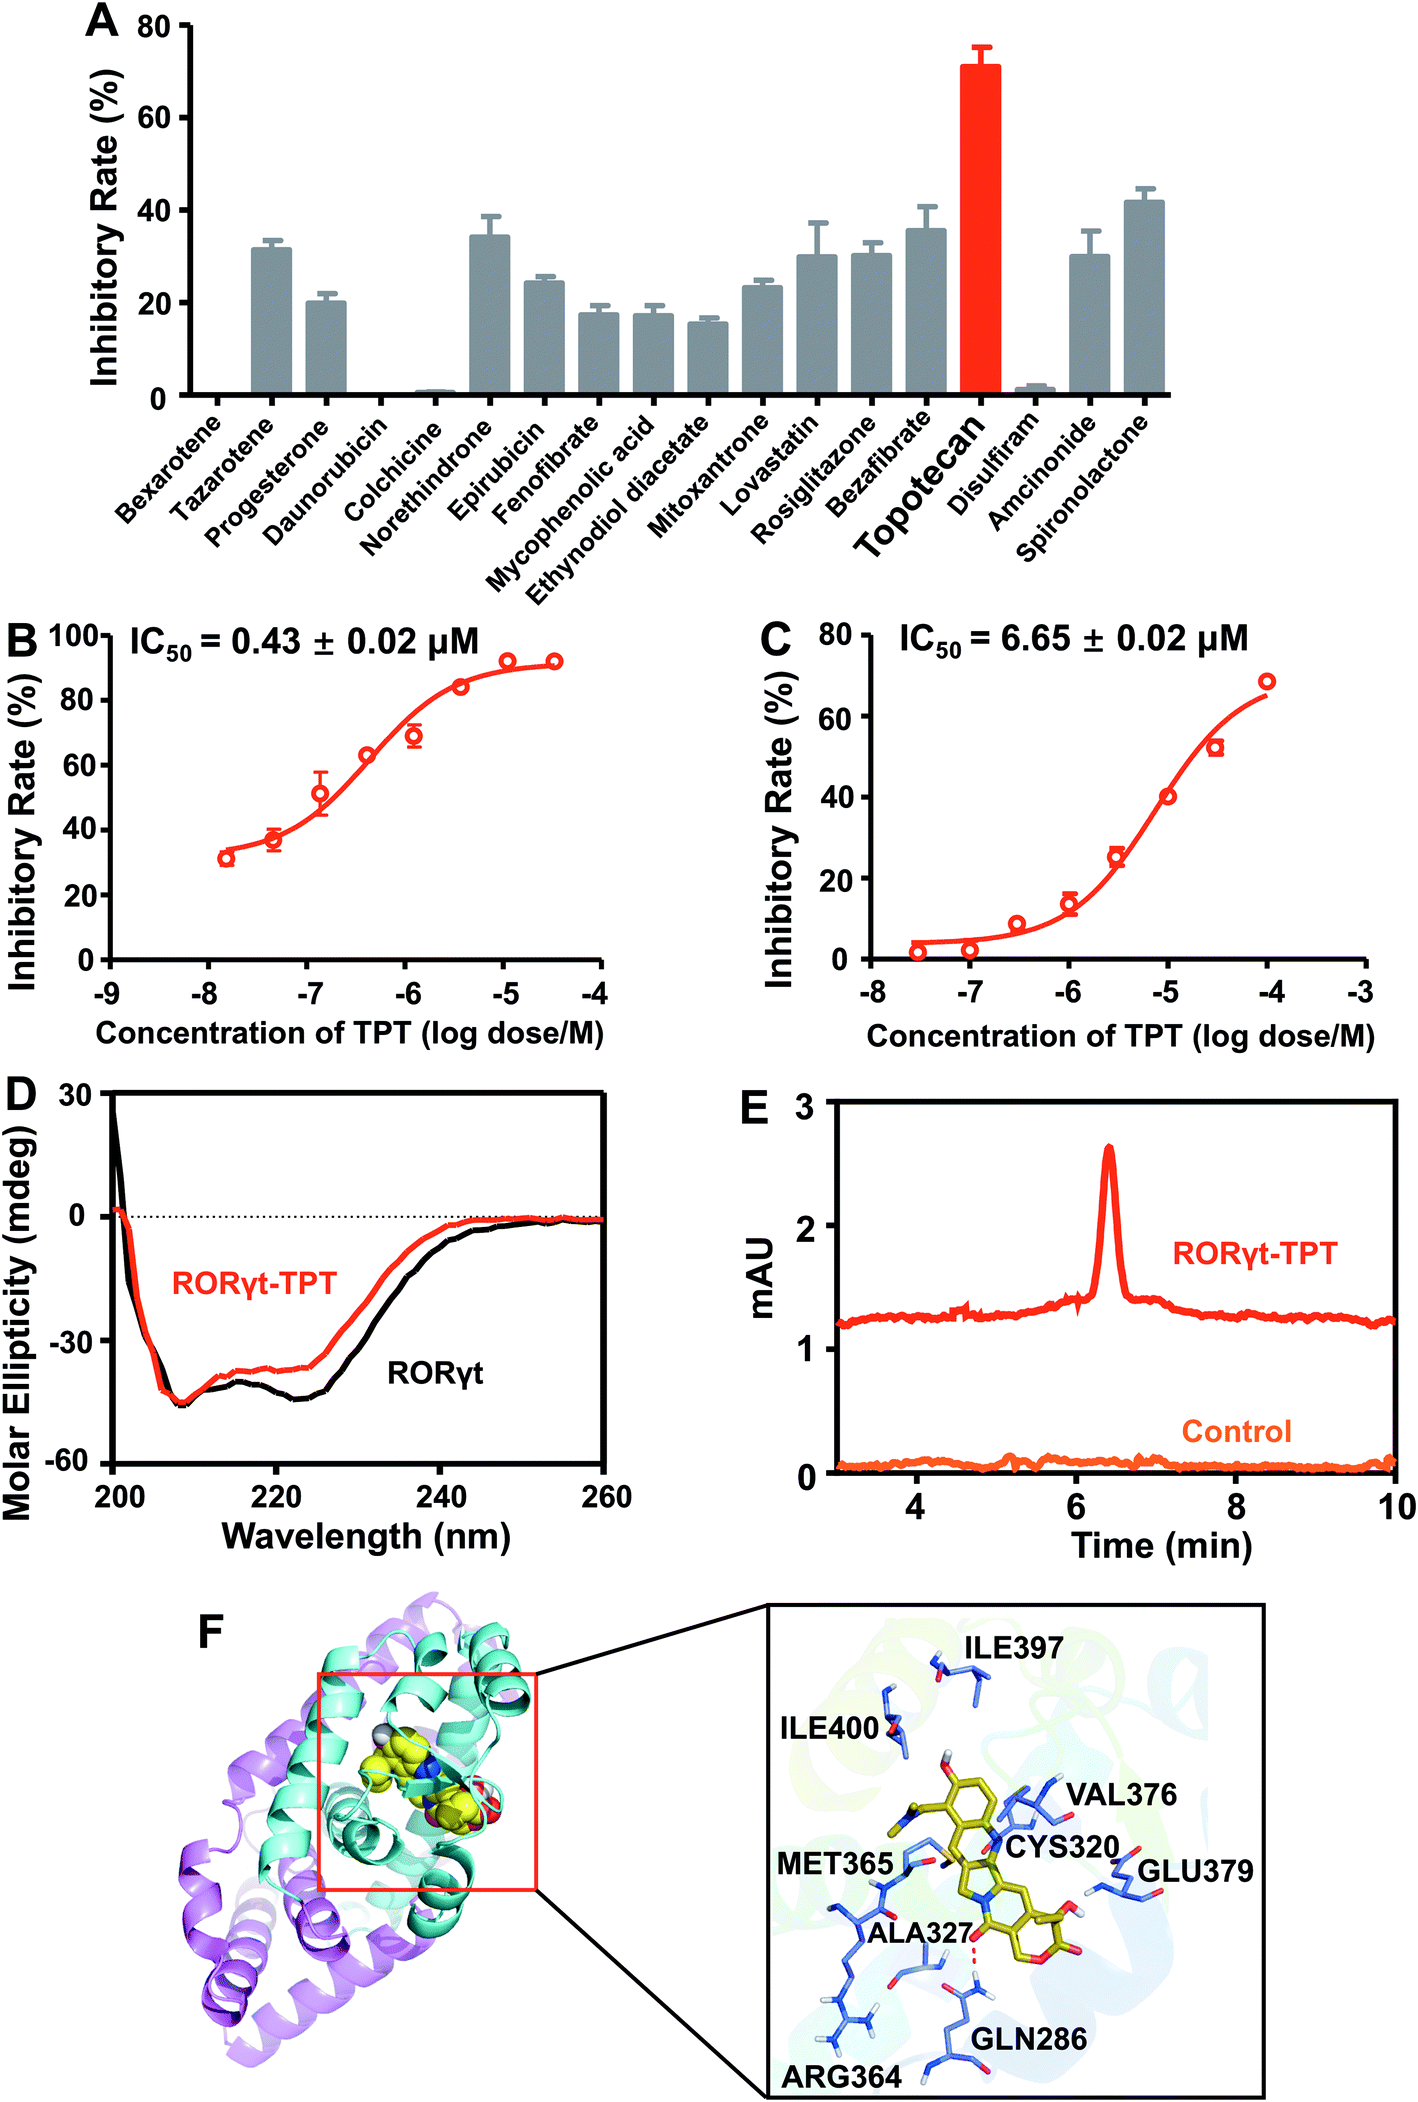


 and
and  , and these matrices share a low dimensional latent space, satisfying k ≪ Nd, Nt.
 measures the deviation between the predictions and observations is formulated as:
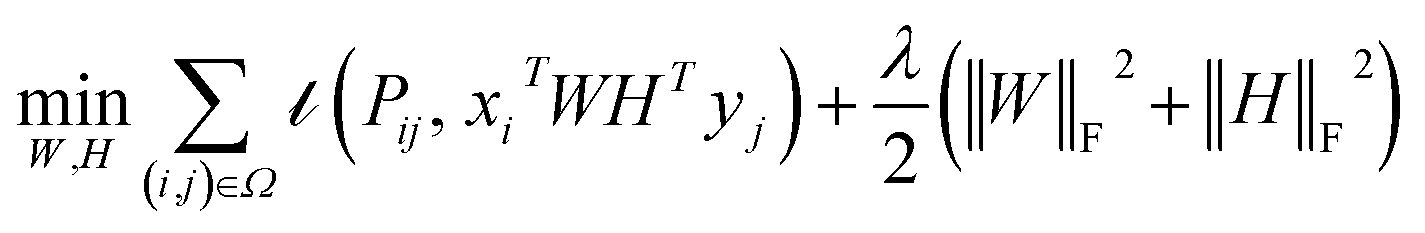
 denotes the feature vector for drug i and
  denotes the feature vector for target j.
 , where Nd is the number of drugs and Nt is the number of targets. When Pij = 1, infers drug i is linked to target j while zero indicates the relationship is unobserved. After the feature extraction process, we construct a decomposing function to recover a low-rank matrix
  from the known associations matrix P with the form of Z = WHT, where
  and
and  , k ≪ Nd, Nt. The optimization problem of our model is parameterized as: