 Open Access Article
A localized molecular automaton for in situ visualization of proteins with specific chemical modifications†
Lu
Liu
,
Siqiao
Li
,
Anwen
Mao
,
Guyu
Wang
,
Yiran
Liu
,
Huangxian
Ju
 and
Lin
Ding
 *
*
State Key Laboratory of Analytical Chemistry for Life Science, School of Chemistry and Chemical Engineering, Chemistry and Biomedicine Innovation Center (ChemBIC), Nanjing University, Nanjing 210023, China. E-mail: dinglin@nju.edu.cn
First published on 2nd January 2020
Abstract
Given the powerful regulation roles of chemical modification networks in protein structures and functions, it is of vital importance to acquire the spatiotemporal chemical modification pattern information in a protein-specific fashion, which is by far a highly challenging task. Herein, we design a localized DNA automaton, equipped with an anticoding–coding sequential propagation algorithm, for in situ visualization of a given protein subtype with two chemical modifications of interest on the cell surface. The automaton is composed of three probes respectively for the protein and two types of modifications. Once anchored on the cell surface and triggered, the automaton performs sequential protein-localized, DNA hybridization-based computations on the proximity status of each modification type with the protein and contracts the set of close proximity information into a single fluorescence signal turn-on using the designed algorithm. The modular and scalable features of the automaton enable its operation in scaled-down versions for protein-specific identification of one given modification. Thus, this work opens up the possibility of using automata for revealing complex regulation mechanisms of protein posttranslational modifications.
Introduction
Chemical modification of proteins is a major means which nature uses to diversify the structure up to functionality of proteins, which involves the covalent attachment of different chemical groups, such as phosphate, carbohydrate, acetyl groups etc., to amino acid residues of proteins.1,2 These modifications play important roles in the regulation of protein properties and activities and govern their dynamic and intricate interactions in biological processes.3–5 More importantly, proteins can be multiply modified with different groups at different residues or at the same residue either competitively or sequentially, creating a continuous regulatory network.6 Owing to the rapid development of MS-based proteomic techniques, hundreds of modifications have been identified.7,8 However, the revelation of the individual functions of these modifications and the effects of their mutual interactions on a given protein are largely hampered by the lack of protein-specific imaging techniques, particularly those capable of acquiring the in situ spatiotemporal distribution information of a specific protein subtype carrying a certain set of chemical modifications.9To meet the challenge, one needs to respectively label the target protein and modifications of interest (MOIs) with probes and design physical or (bio)chemical interactions to report the close proximity of each probe pair (one on the protein and the other on a MOI). On this basis, the key obstacle is how to link these protein-localized interactions in isolation into an information propagation pathway, which will terminate by a signal switch to indicate the existence of a particular protein subtype with a given modification pattern on the cell surface. In this context, DNA nanodevices, which can operate sophisticated computation at the molecular level in a complex biological environment,10–14 offer a robust, elegant and versatile tool, owing to the predictable hybridization and programmable assembly of DNA. For example, several innovative cell discrimination platforms have been developed by combining DNA strand displacement cascade with antibody11- or aptamer12-based recognition for the evaluation of cell surface markers. However, DNA nanodevices designed for in situ computation of chemical modification patterns of a given protein on the cell surface are still missing.
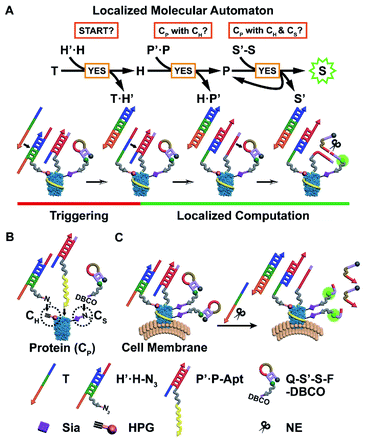
Herein, we have developed a localized DNA automaton capable of in situ translation of a particular protein subtype with dual MOIs on the cell surface into a fluorescence output signal, which relies on performing protein-confined computation according to a designed anticoding–coding sequential propagation algorithm (Fig. 1). For proof-of-concept demonstration, we chose a cancer-associated transmembrane glycoprotein, epithelial cell adhesion molecule (EpCAM), as the model protein, which can serve as a diagnostic and prognostic marker and an immunotherapeutic target,15,16 and introduced two types of model MOIs into cells: (1) incorporating homopropargylglycine (HPG) into proteins to yield alkyne modification;17,18 (2) displacing termini sialic acids (Sia) of protein-carried glycan chains with azide Sia.19,20 The first one represents direct chemical modification of amino acid residues of the protein backbone, while the second one illustrates an important and common protein posttranslational modification (PTM) type, i.e. glycosylation.4 Sia was chosen as the model glycan due to the fact that sialylation is one of most widely occurring cancer-associated changes in glycosylation4 and might add a new dimension to direct therapeutic interventions.21 Thus the protein identity (CP), HPG installation (CH), and azide Sia (CS) are the three illustrative “protein characteristics (PCs)” subjected to computation by the automaton.
The automaton contains three probes respectively for CH, CP, and CS (Fig. 1B), which are designed in a modular manner. Each probe is composed of (1) a reaction/recognition motif (azide (N3) for CH, an EpCAM-specific aptamer sequence SYL3C (Apt) for CP,22 and dibenzocyclooctyne (DBCO) for CS) as the anchoring module for specifically directing probe assembly onto PCs and (2) an anticoding–coding oligonucleotide part (partially complementary DNA duplex H′·H and P′·P for CH and CP, respectively, and hairpin S′-S for CS) as the computation module for collecting identity and proximity information of PCs. The DNA sequences without the prime symbol (H, P, and S) are coding oligonucleotides and linked with the corresponding anchoring motifs. They carry the “identity information” of PCs during the computation. Those marked with the prime symbol (H′, P′, and S′) are anticoding ones, which originally “mask” the coding partners, and can later be triggered by hybridization with the upstream coding sequences to release their masked coding partners. This action propagates “identity information” between coding parts of probes located in close spatial proximity in the order CH → CP → CS (Fig. 1A). Only when the three types of probes are co-localized within the region of a single protein, i.e. the EpCAM carries CH and CS simultaneously, can the automaton complete the calculation and output a final fluorescence signal on the cell surface (Fig. 1C). Note that CP is set as the connecting link for checking its proximity status with CH or CS due to (1) scalability consideration: the program can be simply scaled down by curtailing the first or third step for identification of the specific protein with one MOI; (2) efficiency consideration: CH → CP and then CP → CS information propagation can benefit from accelerated DNA reaction and catalytic signal generation, respectively (vide infra).
The detailed anticoding–coding sequential propagation algorithm is as follows: after anchoring the probes onto the corresponding PCs, a time coding strand T is added to initiate the program. The algorithm performs a three-step sequential YES logic-gate computation, through two steps of toehold-mediated strand displacement reactions23,24 and one step of restriction endonuclease nicking reaction,25 according to a “if YES then proceed” rule on individual proteins on the cell surface (Fig. 1A): T binds to the exposed toehold sequence of anticodingH′, thus exposing the entire length of the codingH (eqn (S1) in Fig. S1A†). The released H can bind to the toehold of anticodingP′ and displace codingP (eqn (S2) in Fig. S1B†), indicating the close proximity of CH and CP. Then the liberated P binds to the fluorescence-quenched anticoding–coding hairpin S′-S (with a quencher and fluorophore modified at S′ and S, respectively), yielding a nicking site for nicking endonuclease (NE, Nt.BbvCI).26 The cleavage enables not only fluorescence recovery due to the separation of the fluorophore from the quencher, but also the re-liberation and thus reuse of P (eqn (S3) in Fig. S2†). The latter achieves the cyclic cleavage of S′-S, thus yielding a downstream catalytic signal propagation mode, which enables the assessment of the protein (or protein subtype)-specific CS level. The finally obtained single signal turn-on indicates the close proximity of CH and CS with CP.
Results and discussion
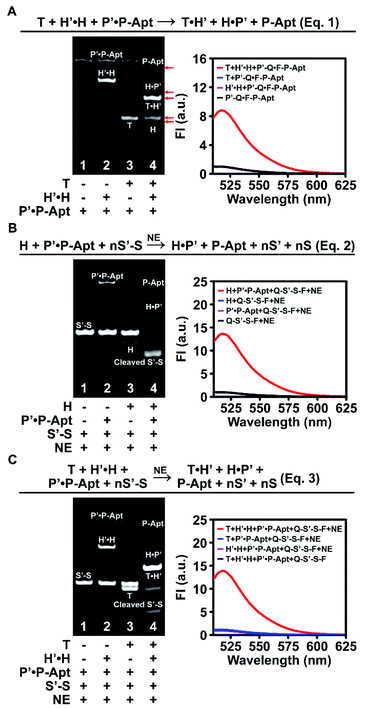
We first designed a whole set of anticoding and coding sequences (Table S1†) and demonstrated the working principles for each individual DNA reaction step in vitro by native polyacrylamide gel electrophoresis (PAGE) and fluorescence analysis (Fig. S1–S3†). To exclude possible interference of the Apt sequence in DNA reactions, P-Apt was used instead of P for in vitro experiments. Then we went on to check the feasibility of the cascades of sequential two or three step reactions. For the cascade reaction composed of two steps of strand displacement (eqn (1) in Fig. 2A), only when T and H′·H were both added to P′·P-Apt could new bands for H, T·H′, H·P′, and P-Apt be generated, indicating the occurrence of a sequential two-step strand displacement reaction (Fig. 2A, left). In the absence of T, H′ and P′ exhibited excellent masking capabilities toward their respective partners (lane 2). The significant enhancement of fluorescence intensity (FI) at 518 nm of P′-Q·F-P-Apt (9-fold) upon incubation with both T and H′·H and the background-leveled signals of P′-Q·F-P-Apt alone or in the presence of either T or H′·H further provided proof for the cascade strand displacement and efficient masking of H (or P-Apt) by H′ (or P′) (Fig. 2A, right).The feasibility of cascading the second strand displacement with the cyclic nicking cleavage reaction (eqn (2) in Fig. 2B) was evaluated likewise (Fig. 2B and S4A†). The addition of both H and P′·P-Apt to S′-S (Q-S′-S-F, for fluorescence analysis) and NE resulted in the disappearance of the S′-S band, the appearance of new bands for P-Apt, H·P′ and the cleavage product, and a 13-fold enhancement of FI (Fig. 2B), demonstrating successful connection of the two reactions. The indispensable role of H in boosting this cascade reaction and the efficient masking of P-Apt (or S) by P′ (or S′) were also confirmed (Fig. 2B and S4†). Note that the complete depletion of S′-S was achieved at a 0.1![[thin space (1/6-em)]](https://www.rsc.org/images/entities/char_2009.gif) :
:![[thin space (1/6-em)]](https://www.rsc.org/images/entities/char_2009.gif) 1 molar ratio of P-Apt and S′-S (lane 4, Fig. 2B, left), demonstrating the recycling usage of P-Apt for S′-S cleavage (also demonstrated in Fig. S2†). Considering that there are usually abundant glycans linked to a single protein, this P recycling usage feature endows the automaton with the capability to reflect the sialylation extent of the target protein (or protein subtype).
1 molar ratio of P-Apt and S′-S (lane 4, Fig. 2B, left), demonstrating the recycling usage of P-Apt for S′-S cleavage (also demonstrated in Fig. S2†). Considering that there are usually abundant glycans linked to a single protein, this P recycling usage feature endows the automaton with the capability to reflect the sialylation extent of the target protein (or protein subtype).
For the holo three-step cascade reaction (eqn (3) in Fig. 2C), as expected, only when T, H′·H, P′·P-Apt, S′-S (or Q-S′-S-F, for fluorescence analysis), and NE were mixed together, can the cleavage of S′-S (or Q-S′-S-F) be observed (Fig. 2C and S4B†). Taken together, these in vitro experiments verified the feasibility of all the DNA reactions along the anticoding–coding signal propagation axis. Moreover, the possibilities of undesired hybridization were eliminated exquisitely, owing to the efficient masking capability of the anticoding strands toward their coding partners. This ensures that during probe anchoring processes, the coding strands will not be liberated to yield or propagate false positive signals, which is the prerequisite to using the algorithm for in situ automaton execution.
The successful implementation of the automaton on the cell surface relies on the specific probe assembly on the corresponding PCs. The model protein with dual MOIs was constructed by co-adding Ac4ManNAz and HPG to the culture medium during the MCF-7 cell culturing process. Considering that HPG acts as the replacement of methionine (Met) to be incorporated into proteins,17,18 a Met-free culture medium is used here. Probes are assembled onto the cell surface PCs in the following order (Fig. S5†): P′·P-Apt binding to CPviaApt recognition, Q-S′-S-F-DBCO linking to CSvia the copper-free click reaction, and H′·H-N3 conjugating to CHvia Cu(I)-catalysed azide–alkyne cycloaddition.18,27 Each type of probe docking was respectively examined by confocal laser scanning microscopy (CLSM) observation of individual binding signals using appropriately modified probes in two set of experiments: (1) only one type of probe was assembled and (2) the complete set of probes was assembled. In the first group of experiments, as expected, for each type of PC, the corresponding counterpart probes displayed bright fluorescence on the cell surface, while in the absence of either moiety of the click reaction/recognition pair, an indiscernible binding signal could be observed (Fig. S6–S10†). These results verified the successful incorporation of the two MOIs into cells and the specificities of probe docking. Additionally, the maintaining of the duplex structure of P′·P-Apt and H′·H-N3 during the assembly process was confirmed (Fig. S11†) and the installation of HPG onto EpCAM was also validated by immunoprecipitating azide-PEG3-biotin treated cell lysate, followed by western blotting analysis with anti-biotin antibody (Fig. S12†). The incubation time for Ac4ManNAz and HPG with MCF-7 cells was optimized to be 48 h (Fig. S8 and S10†), which was used for cellular incorporation of the two MOIs unless otherwise stated. In the second experimental group, when performing complete PC labeling using P′·P-Apt, Q-S′-S-F-DBCO and H′·H-N3, only negligible background signal was observed (Fig. S13†), demonstrating the stability of Q-S′-S-F-DBCO in real cell experimental settings. On this basis, using appropriately modified probes, each type of PC was respectively lighted up (Fig. S13†) and also, the three types of PCs were simultaneously lighted up (Fig. S14†), confirming the successful assembly of probes and exclusion of the cross interference among the labeling processes.
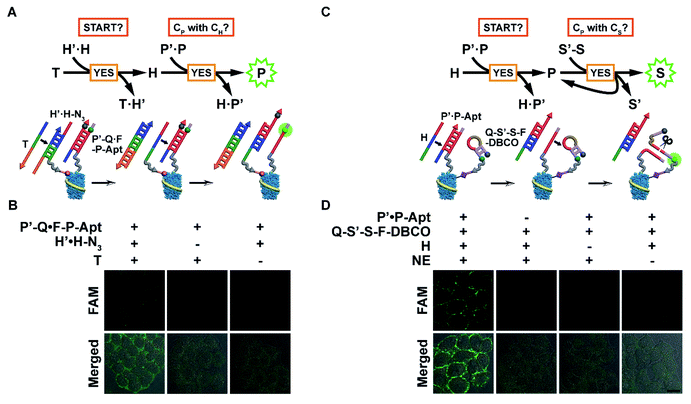
With probes anchored in place, the automaton can be executed in situ to visualize protein subtypes with specific chemical modification patterns. The modular nature of the automaton and the connecting position of CP between CH and CS enable us to use the first or last two computation steps for identification of the protein subtype with one MOI. The first scaled-down version (automaton I, Fig. 3A) involves the anchoring of H′·H-N3 and P′-Q·F-P-Apt on the cell surface and executes according to eqn (1) by computing on two questions: “START?”, followed by “Is CP with CH?”. Indeed, using CH-installed MCF-7 cells as the model, the addition of T led to an obvious fluorescence signal of liberated F-P-Apt on the cell membrane (Fig. 3B), indicating the existence of EpCAM with HPG installed. However, without T addition (particularly, the toehold region of T) or H′·H-N3 binding, only very weak background fluorescence could be observed, suggesting that the automaton completed the computation just as prescribed (Fig. 3B and S15A†). A time-resolved visualization of CH-installed EpCAM on the cell surface was performed and a greater output signal was observed along with longer HPG incubation time with cells (Fig. S16†). The enhancement of the output might be attributed to higher expression of newly synthesized, HPG-installed EpCAM and higher effective HPG concentration on individual proteins, and the latter could accelerate the strand displacement rate.28
The other scaled-down version (automaton II) just covers the last two steps and computes based on eqn (2), which requires the assembly of P′·P-Apt and Q-S′-S-F-DBCO on the CS-installed cell surface, and uses codingH as the time coding strand. Upon being triggered, this automaton analyses “START” and then “Is CP with CS?”. Specifically, after H displaces P-Apt, the released P-Apt exhibits protein-localized hybridization with Q-S′-S-F-DBCO in a cyclic fashion assisted by NE nicking, thus propagating the identity information of CP to multiple CS in close proximity (Fig. 3C). Analogously, automaton II successfully completed computation by displaying bright fluorescence on the cell surface, illuminating the CS only carried by EpCAM (Fig. 3D and S15B†). The output FI was 2.3 times that for automaton I, which could be attributed to the signal propagation from single CP to multiple CS, thus reflecting the sialylation level of EpCAM. The dynamic EpCAM-specific CS incorporation was monitored using automaton II (Fig. S17A†), and a gradual increase of output FI was observed with longer Ac4ManNAz incubation time (Fig. S17B†). This result demonstrated that the proposed automaton could be used for protein-specific monitoring of the dynamic incorporation of MOIs.
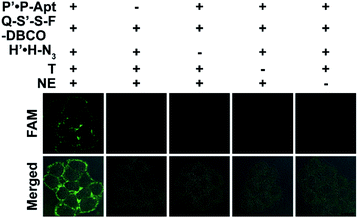
The docking of automaton I and II generates the holo automaton (i.e. automaton III), which enables the identification of EpCAM with dual MOIs based on eqn (3) using the complete set of probes (Fig. 4). On the basis of the two questions just the same as those for automaton I, the third question is “Is CP with both CH and CS?” (Fig. 1A). Similarly, the recycled use of P-Apt enabled the output to represent the expression level of CS on a given protein subtype, i.e. HPG-installed EpCAM. The binding stability of P′·P-Apt was evidenced by executing a counterpart automaton using P′-Q·F-P-Apt and S′-S-DBCO to replace P′·P-Apt and Q-S′-S-F-DBCO. The fluorescence recovery of the probe P′-Q·F-P-Apt after the addition of T and NE was observed, which was due to the hybridization between H and P′-Q (Fig. S18†).
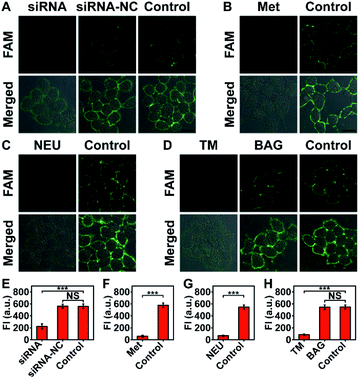
The imaging specificity of automaton III was scrutinized from both protein and MOI aspects. For protein specificity, negligible output could be observed with the omission of P′·P-Apt (Fig. 4), suggesting the dependence of output generation on Apt recognition. In further support, EpCAM expression was downregulated by siRNA, as confirmed by both western blotting analysis (Fig. S19A†) and F-P-Apt binding (Fig. S19B and C†), which led to an obvious reduction of output (Fig. 5A and E), thus verifying that the output indeed came from EpCAM rather than other proteins. To exclude the possibility of DNA hybridization between probes anchored on different proteins, either H′·H or Q-S′-S-F was guided to anchor at an adjacent protein, using a large-sized and highly expressed glycoprotein mucin 1 (MUC1) as the model, while the other two probes in both cases were assembled just as before. As expected, only negligible signals could be observed upon executing the two counterpart automatons (Fig. S20†). The dependence on HPG (or H′·H-N3) for executing automaton III was confirmed from the indiscernible signal obtained when displacing HPG with Met for treating cells (Fig. 5B and F) or executing automaton III in the absence of H′·H-N3 (Fig. 4). Finally, the CS detection specificity was verified from the significant decrease of output when using α2-3,6,8,9 neuraminidase A (NEU) to cleave terminal Sia on the outer cell surface (Fig. 5C and G).29
Next, the feasibility of automaton III for quantification of the target protein was evaluated systematically. Executing the automaton on dual-labeled cells after being treated with NEU of different concentrations revealed a linear relationship between FI from CLSM images and the NEU concentration, thus demonstrating the capability of relative quantification of the azide Sia level of the HPG-installed EpCAM (Fig. S21†). Similarly, the feasibility of quantification of EpCAM containing dual MOIs was also examined on cell samples treated with siRNA with different concentrations. The linear FI decrease with increasing siRNA concentration verified that the output of the automaton could reflect the expression level of the target protein subtype with two MOIs quantitatively (Fig. S22†).
The ability of automaton III to identify specific proteins carrying dual MOIs with CS as the terminal computation target can be used for monitoring the glycan expression variation of a specific protein subtype during disturbed glycan biosynthesis processes. The extracellular domain of EpCAM is N-glycosylated only;30 thus the inhibition of N-glycosylation, rather than O-glycosylation pathways, may influence the glycoforms of EpCAM. Consistent with this, a remarkable decrease of output was obtained when treating MCF-7 cells with an N-glycosylation inhibitor, tunicamycin (TM),31 and negligible change could be observed after benzyl-α-GalNAc (BAG, an O-glycosylation inhibitor) treatment (Fig. 5D and H).32 Considering that the EpCAM expression and HPG installation levels in MCF-7 cells showed little change during drug treatment (Fig. S23 and S24†), the observed output decrease upon TM treatment indicated a reduced sialylation level in HPG-installed EpCAM. The indiscernible change upon BAG treatment also verified the sugar specificity of automaton III, as O-glycans carried by adjacent proteins could not contribute to the output.
To demonstrate the modular and generically adaptable design of the automaton for other proteins containing natural PTMs, an automaton (automaton IV) that can illustrate the phosphorylation of an HPG-incorporated epidermal growth factor receptor (EGFR) upon epidermal growth factor stimulation is designed using HeLa cells as the model. In this context, the three probes are H′·H-N3, P′·P-AptE, and Q-S′-S-F-Ab, respectively, for CH, EGFR, and phosphotyrosine. Upon the addition of T, obvious fluorescence could be observed inside HeLa cells (Fig. S25†), indicating the existence of phosphorylated and HPG-labeled EGFRs.
Conclusions
In conclusion, unlike prior studies mainly focusing on computing cell identity by performing DNA reactions at the global cell membrane,11–13 we have built a localized molecular automaton capable of in situ assessment of the chemical modification characteristics of the target protein on the cell surface. The automaton has harnessed different types of exquisite DNA nanotechnology to choreograph the anticoding–coding sequential propagation algorithm, achieving the visualization of a protein subtype with dual MOIs. The automaton is modular and scalable, which enables the operation of scaled-down versions for protein-specific identification of one MOI as desired. The automata have also been used for MOI tracking in a protein-specific and further protein subtype-specific manner. The automata can be readily expanded to more complex algorithms by simply inserting other probe layers to reflect the hierarchical structure of biomacromolecules. Thus this work opens up the possibility of using automata for in situ visualization and tracking of protein PTMs and also paves the way for revelation of the sophisticated mechanisms of the PTM network (including PTM crosstalk) for regulation of protein functions.Conflicts of interest
There are no conflicts to declare.Acknowledgements
We gratefully acknowledge support from the National Natural Science Foundation of China (21974067, 21675082), the National Key Research and Development Program of China (2018YFC1004704), the Fundamental Research Funds for the Central Universities (020514380184), and the State Key Laboratory of Analytical Chemistry for Life Science (5431ZZXM1903).Notes and references
- J. Munoz and A. J. R. Heck, Angew. Chem., Int. Ed., 2014, 53, 10864–10866 CrossRef CAS PubMed.
- C. T. Walsh, S. Garneau-Tsodikova and G. J. Gatto, Angew. Chem., Int. Ed., 2005, 44, 7342–7372 CrossRef CAS PubMed.
- P. Cohen, Nat. Cell Biol., 2002, 4, 127–130 CrossRef PubMed.
- S. S. Pinho and C. A. Reis, Nat. Rev. Cancer, 2015, 15, 540–555 CrossRef CAS PubMed.
- M. D. Resh, Nat. Chem. Biol., 2006, 2, 584–590 CrossRef CAS PubMed.
- Y. L. Deribe, T. Pawson and I. Dikic, Nat. Struct. Mol. Biol., 2010, 17, 666–672 CrossRef CAS PubMed.
- Y. Kho, S. C. Kim, C. Jiang, D. Barma, S. W. Kwon, J. K. Cheng, J. Jaunbergs, C. Weinbaum, F. Tamanoi, J. Falck and Y. M. Zhao, Proc. Natl. Acad. Sci. U. S. A., 2004, 101, 12479–12484 CrossRef CAS PubMed.
- M. Mann and O. N. Jensen, Nat. Biotechnol., 2003, 21, 255–261 CrossRef CAS PubMed.
- W. Lin, L. Gao and X. Chen, Curr. Opin. Chem. Biol., 2015, 28, 156–163 CrossRef CAS PubMed.
- S. M. Douglas, I. Bachelet and G. M. Church, Science, 2012, 335, 831–834 CrossRef CAS PubMed.
- M. Rudchenko, S. Taylor, P. Pallavi, A. Dechkovskaia, S. Khan, V. P. Butler, S. Rudchenko and M. N. Stojanovic, Nat. Nanotechnol., 2013, 8, 580–586 CrossRef CAS PubMed.
- M. X. You, G. Z. Zhu, T. Chen, M. J. Donovan and W. H. Tan, J. Am. Chem. Soc., 2015, 137, 667–674 CrossRef CAS PubMed.
- X. Chang, C. Zhang, C. Lv, Y. Sun, M. Z. Zhang, Y. M. Zhao, L. L. Yang, D. Han and W. H. Tan, J. Am. Chem. Soc., 2019, 141, 12738–12743 CrossRef CAS PubMed.
- K. Quan, J. Li, J. L. Wang, N. L. Xie, Q. M. Wei, J. L. Tang, X. H. Yang, K. M. Wang and J. Huang, Chem. Sci., 2019, 10, 1442–1449 RSC.
- G. Gastl, G. Spizzo, P. Obrist, M. Dunser and G. Mikuz, Lancet, 2000, 356, 1981–1982 CrossRef CAS.
- D. Maetzel, S. Denzel, B. Mack, M. Canis, P. Went, M. Benk, C. Kieu, P. Papior, P. A. Baeuerle, M. Munz and O. Gires, Nat. Cell Biol., 2009, 11, 162–171 CrossRef CAS PubMed.
- M. Grammel and H. C. Hang, Nat. Chem. Biol., 2013, 9, 475–484 CrossRef CAS PubMed.
- S. H. Li, L. Wang, F. Yu, Z. L. Zhu, D. Shobaki, H. Q. Chen, M. Wang, J. Wang, G. T. Qin, U. J. Erasquin, L. Ren, Y. J. Wang and C. Z. Cai, Chem. Sci., 2017, 8, 2107–2114 RSC.
- E. Saxon and C. R. Bertozzi, Science, 2000, 287, 2007–2010 CrossRef CAS PubMed.
- K. K. Palaniappan and C. R. Bertozzi, Chem. Rev., 2016, 116, 14277–14306 CrossRef CAS PubMed.
- E. Rodriguez, S. T. T. Schetters and Y. van Kooyk, Nat. Rev. Immunol., 2018, 18, 204–211 CrossRef CAS PubMed.
- Y. Song, Z. Zhu, Y. An, W. Zhang, H. Zhang, D. Liu, C. Yu, W. Duan and C. J. Yang, Anal. Chem., 2013, 85, 4141–4149 CrossRef CAS PubMed.
- D. Y. Zhang and G. Seelig, Nat. Chem., 2011, 3, 103–113 CrossRef CAS PubMed.
- D. Y. Zhang and E. Winfree, J. Am. Chem. Soc., 2009, 131, 17303–17314 CrossRef CAS PubMed.
- S.-H. Chan, B. L. Stoddard and S.-Y. Xu, Nucleic Acids Res., 2011, 39, 1–18 CrossRef CAS PubMed.
- H. Yardimci, X. D. Wang, A. B. Loveland, I. Tappin, D. Z. Rudner, J. Hurwitz, A. M. van Oijen and J. C. Walter, Nature, 2012, 492, 205–209 CrossRef CAS PubMed.
- M. Meldal and C. W. Tornøe, Chem. Rev., 2008, 108, 2952–3015 CrossRef CAS PubMed.
- W. Engelen, L. H. H. Meijer, B. Somers, T. F. A. de Greef and M. Merkx, Nat. Commun., 2017, 8, 14473 CrossRef CAS PubMed.
- S. Q. Li, Y. R. Liu, L. Liu, Y. M. Feng, L. Ding and H. X. Ju, Angew. Chem., Int. Ed., 2018, 57, 12007–12011 CrossRef CAS PubMed.
- M. Pavsic, G. Guncar, K. Djinovic-Carugo and B. Lenarcic, Nat. Commun., 2014, 5, 4764 CrossRef CAS PubMed.
- S. S. Sun, P. Shah, S. T. Eshghi, W. M. Yang, N. Trikannad, S. Yang, L. J. Chen, P. Aiyetan, N. Hoti, Z. Zhang, D. W. Chan and H. Zhang, Nat. Biotechnol., 2016, 34, 84–88 CrossRef CAS PubMed.
- D. O. Croci, J. P. Cerliani, T. Dalotto-Moreno, S. P. Mendez-Huergo, I. D. Mascanfroni, S. Dergan-Dylon, M. A. Toscano, J. J. Caramelo, J. J. Garcia-Vallejo, J. Ouyang, E. A. Mesri, M. R. Junttila, C. Bais, M. A. Shipp, M. Salatino and G. A. Rabinovich, Cell, 2014, 156, 744–758 CrossRef CAS PubMed.
Footnote |
| † Electronic supplementary information (ESI) available. See DOI: 10.1039/c9sc04161c |
| This journal is © The Royal Society of Chemistry 2020 |

