Continuous hydrothermal leaching of LiCoO2 cathode materials by using citric acid†
Qingxin
Zheng
 *a,
Kensuke
Shibazaki
b,
Tetsufumi
Ogawa
b,
Atsushi
Kishita
a,
Yuya
Hiraga
a,
Yuta
Nakayasu
 c and
Masaru
Watanabe
*ad
aResearch Center of Supercritical Fluid Technology, Department of Chemical Engineering, Graduate School of Engineering, Tohoku University, 6-6-11 Aoba, Aramaki, Aoba-ku, Sendai, 980-8579 Japan. E-mail: qingxin.zheng.a2@tohoku.ac.jp; masaru.watanabe.e2@tohoku.ac.jp
bFaculty of Environmental Studies, Tohoku University, 6-6-11 Aoba, Aramaki, Aoba-ku, Sendai, 980-8579 Japan
cFrontier Research Institute for Interdisciplinary Sciences, Tohoku University, 6-6-11-406 Aoba, Aza, Aramaki, Aoba-ku, Sendai 980-8578, Japan
dEnvironment Conservation Center, Department of Chemical Engineering, Graduate School of Engineering, Tohoku University, 6-6-11 Aoba, Aramaki, Aoba-ku, Sendai, 980-8579 Japan
First published on 3rd August 2020
Abstract
The first run of continuous hydrothermal leaching of lithium-ion battery cathode materials, LiCoO2, was performed using citric acid as the leachant at 200 °C. The flow system was specially designed and customized. Prior to the hydrothermal leaching experiments, a three-layer model was used to predict the flow state in this flow system, and a cold flow test using two kinds of flow lines was performed to determine the conditions in the preliminary experiments. Finally, the pulp density of the slurry and the flow rate were set to 10 g L−1 and 30 ml min−1, respectively, for the continuous hydrothermal leaching experiments. At 60 min after the start of slurry feeding, the leaching efficiency of Li and Co reached 81.3% and 92.7%, respectively, and can continue to increase with the extension of time. The successful run indicated that the process of hydrothermal leaching is feasible and promising to be applied in practice. Meanwhile, a problem of acid corrosion caused by the use of citric acid during this process was revealed and is expected to be resolved using inner coating materials with high acid corrosion resistance or organic acids with low or no acid corrosion as the leachant.
1 Introduction
Due to their high voltage, high stability, long life, and light weight, lithium-ion batteries (LIBs) are being widely applied from portable electronic devices to electric vehicles.1 To meet the global demand for power sources, the manufacture of LIBs is increasing greatly,2 followed by huge consumption of various cathode materials used in LIBs and massive generation of spent LIBs.3–5LIB cathode materials are usually composed of lithium-containing oxides of transition metals, such as LiCoO2, LiNiO2, LiMn2O4, LiFePO4, LiMnPO4, LiCoPO4, and their mixtures.4 The metal components in LIBs need a stable supply to meet the increasing consumption; however, some of them are mainly produced from a limited number of countries or geographically remote areas and thus have unstable supplies caused by geopolitical issues.6,7 For example, about 70% of Co is produced by Congo (59%), Australia (5%), and Russia (7%).8 The mining supply of metals, such as Li and Co, is predicted to reach their limits and will be exceeded by the demand soon. On the other hand, spent LIBs are regarded as a kind of hazardous solid waste, which would bring a tremendous burden on the environment and resource conservation.2 Therefore, efficient recovery of valuable metals (e.g., Li, Co, Ni, and Mn) from spent LIBs under mild conditions will be essential to conserve natural resources, reduce environmental problems, keep resource stability and security, and bring economic benefits.9 As the first type of commercialized cathode material, LiCoO2 has been widely employed in most commercial LIBs, and recently, the quantity of discarded LiCoO2 has increased regularly and continuously.10 Compared with other LIB materials, spent LiCoO2 is always regarded as a worthy target for recycling because it is rich in Li and Co.11
Hydrometallurgy is one of the conventional methods for recovering metal components from spent LIBs in the lab and industry, composed of acid leaching in the first step and separation in the second step.12,13 In the leaching stage, spent LIB cathode materials, such as LiCoO2, LiNiO2, and LiMn2O4, are converted to an aqueous solution of mixed metal ions. A traditional and well-known process is leaching metal ions with a mineral or an inorganic acid (e.g., sulfuric acid or nitrate acid) in non-pressurized hot water.14 Meanwhile, chemical reductants (e.g., H2O2, NaHSO3, or Na2S2O3)15 are added to improve the leaching efficiency and lower the required concentration of acids. Due to its drawbacks in terms of high-concentration inorganic acids, consumption of reductants, batch-style apparatus, long time, and strong acid corrosion, the traditional leaching process always brings severe environmental pollution and economic burden. Therefore, making this process a greener and more environmentally-friendly step-by-step one is attracting increasing attention.
As shown in Scheme 1, looking for alternatives to inorganic acids is the first stage in the green progress of the acid leaching process for LiCoO2. Compared to inorganic acids, organic acids are milder with lower acid corrosion and pollution. To date, there have been plenty of reports on the leaching of metal ions from spent LIB cathode materials using organic acids as the leachant, such as succinic acid,16 malic acid,17 aspartic acid,17 citric acid (H3Cit),18–20 acetic acid,21 lactic acid,22 tartaric acid,23 oxalic acid,24 glycine,25 and so on. These achievements have proved that organic acids could displace inorganic acids for the acid leaching process. However, reductants are still indispensable for reducing the transition metal ions from a high to a low state.18 For example, without reductants, the leaching efficiencies of Li and Co decreased significantly, despite the use of inorganic or organic acids.6,7,17,26
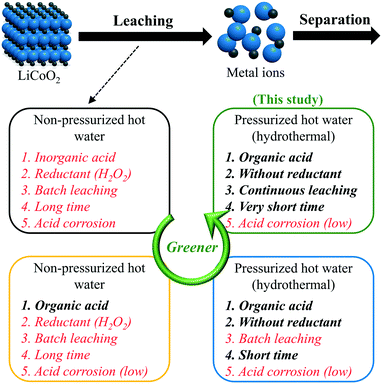 | ||
| Scheme 1 The green progress of the acid leaching process for LiCoO2. The words marked in red color are the problems to be resolved. | ||
To date, two feasible paths have been reported to avoid the consumption of additional reductants. The one is leaching with ascorbic acid.27 During this process, ascorbic acid plays the roles of both a leachant and reductant. Another one was proposed in 2017, using pressurized hot water to leach Li and Co from LiCoO2 with H3Cit, and the process was also called ‘hydrothermal leaching’.26 Without using any reductant like H2O2, hydrothermal leaching with H3Cit (0.4 mol L−1) achieved a leaching efficiency of 94% for both Li and Co at 200 °C for 10 min.26 This good performance was attributed to H3Cit which supplies a proton, forms a soluble complex with Co, and shows reducibility even though H3Cit does not work as a reductant below 100 °C. Different from the traditional leaching process using non-pressurized hot water, the temperature of the hydrothermal leaching process is not limited by the boiling point of water at 100 °C. The use of high temperature greatly accelerates the reaction, shortens the reaction time, and decreases the required concentration of acid.28 With a lower concentration of acids, no consumption of reductants, and a higher reaction rate, hydrothermal leaching is more efficient and environmentally friendly than the traditional leaching method, although an organic acid is used in each of them.
One of the next targets in the green progress is developing the leaching apparatus from a batch to a continuous flow system, which can enhance the productivity, reduce the processing time, improve the quality, have lower reagent and power consumption, save the costs, facilitate the scale-up, and move forward to the industrial application.29,30 To our knowledge, continuous acid leaching of metal components from LIB cathode materials using a flow system has never been achieved in any conventional hydrometallurgy process, due to possible reasons such as the long reaction time and severe acid corrosion caused by the use of inorganic acids or high-concentration organic acids. Performed in pressurized hot water with low-concentration organic acids, the hydrothermal leaching method becomes one of the promising candidates to realize continuous leaching, but its development is still in the initial stage and the device is currently limited to the batch-style apparatus with a small scale. Therefore, at the current stage, a flow system, in which the hydrothermal leaching can be performed continuously, is urgently demanded.
In this study, we applied a specifically designed and customized flow system to perform the continuous hydrothermal leaching of LiCoO2 using H3Cit as the leachant for the first time. The preliminary conditions such as the pulp density of the slurry and flow rate were determined based on the results of a three-layer model and a cold flow test without heating. During the first run of continuous hydrothermal leaching experiments, the experimental conditions were given in detail, the flow system was modified, the results of leaching efficiency were obtained, and problems such as acid corrosion as well as feasible resolutions were considered.
2 Experimental
2.1 Reactants
A commercial LIB cathode material, LiCoO2 (>98%, STREM Chemicals, layered rocksalt), and H3Cit (>99.5%, FUJIFILM Wako Pure Chemical) were purchased and used without further purification or treatment. Based on the light scattering results (Fig. S1†), the diameter of LiCoO2 particles mainly distributed in the range of 5–40 μm. Ultra-pure water was supplied using a distillation apparatus (WG-220, Yamato Co.) and had a conductivity of 5.5 μS m−1.2.2 Apparatus
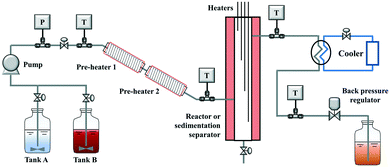
Scheme 2 shows the schematic diagram of a laboratory-scale continuous hydrothermal leaching system. Two feeding tanks (tank A and B, with a stirrer inside), a slurry pump (JASCO Corporation, PU-2100S), two pre-heaters (pre-heaters 1 and 2, twined by a piping tube and wrapped by a heat insulator), a reactor or sedimentation separator (SUS304, 1 inch; twined by four coil heaters and wrapped by a heat insulator), a cooler (SIBATA), a back-pressure regulator (JASCO, BP-2080-M), and a product collector were connected in series. The lines between the feeding tanks and the slurry pump were made of Teflon, and the other piping tubes (GL Sciences, 1/8 inch) and connectors (Swagelok) were made of stainless steel SUS316. The heaters (Hakko Electric, DGT0010) in the reactor from top to bottom were denoted as heater 1, heater 2, heater 3, and heater 4, respectively. In the reactor, the liquid and solid products were separated from the top and bottom, respectively. To restrain the sedimentation of solid particles in the slurry, the position of the feeding tank is higher than the collector. Many thermocouples in the system were used to monitor the temperature conditions and control the heaters accurately.2.3 Cold flow test
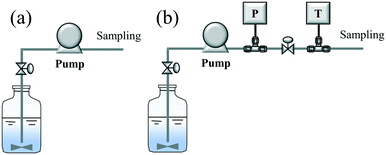
Prior to the hydrothermal leaching experiment, a flow test without heating (or cold flow test) was conducted to explore the initial conditions, such as the flow rate and pulp density. Here, two flow lines (A and B) were used for the flow test, as shown in Scheme 3. In a typical experiment, tanks A and B were filled with pure water and a mixed slurry of LiCoO2/water (pulp density: 1–50 g L−1), respectively. First, pure water was pumped into the system with a specific flow rate (10 or 30 ml min−1). After confirming that the water reached the outlet, the supply of the pure water was stopped and the supply of the slurry began. After continuous flowing for 10 min, sampling was started and performed 6 times with an interval of 5 min. After evaporating the water, the solid product contained in the recovered solution could be obtained. The pulp density of the recovered solution was calculated using the weight of the slurry and the weight of the solid product contained in the slurry. Based on the pulp density of each recovered solution, the flowing or pumping stability was determined and evaluated.2.4 Continuous hydrothermal leaching of LiCoO2 with H3Cit
A 0.4 mol L−1 H3Cit aqueous solution (>2 L) was prepared and placed in tank A. A slurry (pulp density: 10 g L−1) was prepared by mixing 20 g of LiCoO2 with 1980 g of 0.4 mol L−1 H3Cit aqueous solution, and was placed into tank B. In a typical experiment, pure water was pumped to the system with a flow rate of 30 ml min−1, and the system pressure was controlled to 20 MPa with the back-pressure regulator. In consideration of safety, the pressure was increased by 5 MPa at a time. After confirming that the system pressure was maintained and there was no liquid leakage from the system, heating was started. In this study, the leaching temperature was 200 °C, and the setting temperatures of pre-heaters and heaters were increased step by step, as shown in Table 1. The setting temperature of the heater at the bottom of the reactor was lower than that at the top. This is to restrain the density difference of the liquid due to the difference in temperature, which can generate convection in the reactor and reduce the separation performance, promote the precipitation of the unleached materials, and prevent the blocking at the outlet of the reactor.| Step 1 | Step 2 | Step 3 | Step 4 | Step 5 | Step 6 | |
|---|---|---|---|---|---|---|
| a The preheaters or heaters were heated step by step to the specific temperatures. | ||||||
| Pre-heater 1 | 150 | 180 | 180 | 200 | 200 | 200 |
| Pre-heater 2 | 150 | 180 | 180 | 200 | 200 | 200 |
| Heater 1 | 100 | 125 | 150 | 180 | 200 | 200 |
| Heater 2 | 100 | 125 | 150 | 180 | 200 | 200 |
| Heater 3 | 70 | 100 | 125 | 150 | 180 | 195 |
| Heater 4 | 40 | 80 | 100 | 120 | 150 | 190 |
After the temperature became unchanged, the supply of pure water was stopped, and the H3Cit aqueous solution was supplied into the system from tank A. After about 15 min, the water in the system was completely displaced by the H3Cit solution. After confirming that the pressure was maintained, there was no leakage, and the heating was stable, the supply of the H3Cit aqueous solution was stopped, and the supply of the slurry was started. During the experiment, the slurry in the feeding tank was stirred at a speed of 600–800 rpm using a 4-blade stirrer (AS ONE, SM-101) to suppress solid–liquid separation. Sampling was started after the slurry was fed for 15 min, and performed 10 times with an interval of 5 min.
2.5 Analyses and definition
The size distribution of raw LIB material LiCoO2 was obtained using a particle size analyzer (MT3300EXII, Microtrac). The composition of metal ions in the leachate was qualified and quantified by inductively coupled plasma atomic emission spectroscopy (ICP-AES; iCAP6500, Thermo Fisher), in which the wavelengths for identifying Li and Co were 670 and 228 nm, respectively. Before the ICP test, the solution was diluted to 1/200.Leaching efficiency is defined as the percentage of the mass of the metal ion in the recovered solution against the total mass of the metal ion in the starting material. The calculation equation (eqn (1)) is shown as follows.
 | (1) |
2.6 Three-layer model
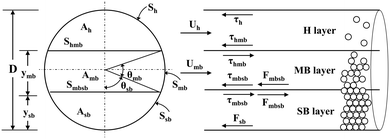
In this study, a three-layer model was used to predict the characteristics of the solid–liquid flow (slurry flow). As supposed in the three-layer model and shown in Scheme 4,31 when a solid–liquid mixture flows in a horizontal pipe at a given flow rate, three layers exist in the pipe: a stationary bed (SB layer) at the bottom, a moving bed (MB layer) above it, and a heterogeneous suspended flow (H layer) at the top. The detailed formula derivation process follows a previous report,32 and is described in the ESI.† Finally, a flow pattern map, which expresses the relationship between the pulp density and the flow rate of the LiCoO2 slurry, was constructed and used to predict the flow state of the slurry and set the conditions under which accumulation or deposition does not occur.3 Results and discussion
3.1 Cold flow test
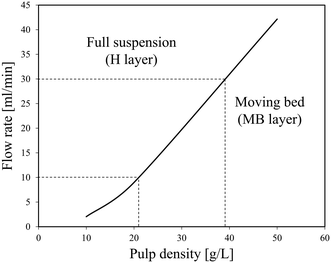
The results of cold flow tests without heating were obtained to determine the conditions in the further continuous leaching experiments, mainly the flow rate and pulp density.Fig. 2 shows the relationship between the pulp density and the flow rate of the LiCoO2 slurry calculated using the three-layer model. The density of LiCoO2 is 5000 kg m−3, and the average particle size is 12.4 μm based on the particle size distribution shown in Fig. S1.† The density (ρL) and viscosity (μL) of the H3Cit aqueous solution were assumed to be similar to those of water. The viscosity of the slurry (μs) was assumed to be similar to that of water. In Fig. 2, the area above the solid line represents the full suspension area (H layer), where the liquid flows without forming a deposit, and the bottom area is the moving bed area (MB layer) that is transported while forming a deposit. From Fig. 2, it was found that at a flow rate of 10 ml min−1, the slurry can be transferred without deposition when the pulp density was less than about 21 g L−1, while at a pulp density of 50 g L−1, the LiCoO2 particles can deposit in the tube, making a stable liquid transfer difficult to achieve. This gave a good explanation for the experimental results shown in Fig. 1.
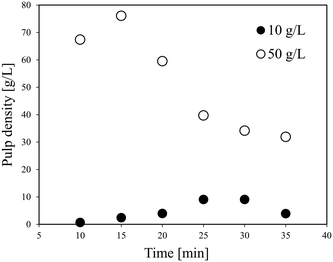
Fig. 3 shows the effect of time on the pulp density of the recovered solution using flow line B. When the pulp density of the slurry was 1 g L−1, the recovered solution has a stable pulp density in each of the six samplings. When the slurry pulp density increased to 10 or 20 g L−1, the pulp density of the recovered solution was stable in the first five samplings, but then dropped in the 6th time. Particularly at a slurry pulp density of 20 g L−1, the pulp density of the recovered solution in the 6th sampling decreased a lot to almost a half. From Fig. 2, under the conditions of 10 or 20 g L−1 (pulp density of the feeding slurry) and 30 ml min−1 (flow rate), it is in the full suspension range and accumulation should not occur. The conflict again illustrates the difference between the theoretical model results and the actual experimental results. A possible reason for the decrease in the 6th time is that the particles accumulate in the slurry pump as time elapses from the start of the slurry feeding, and then the feeding performance is impaired. The LiCoO2 particles might deposit in the slurry pump and cause blockage, thereby lowering the transfer rate. That is, it can be expected that a long-term operation will be difficult for this flow system when the pulp density of the slurry is high.
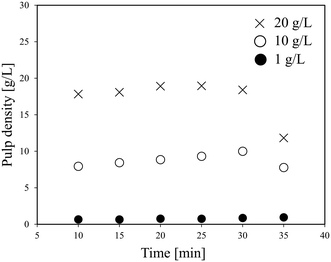 | ||
| Fig. 3 Effect of time on the pulp density of the recovered solution using flow line B (LiCoO2, 30 ml min−1). | ||
Based on the above results, the pulp density of the slurry and the flow rate were set to 10 g L−1 and 30 ml min−1, respectively, in the next continuous hydrothermal acid leaching experiments.
3.2 Continuous hydrothermal leaching of LiCoO2 with H3Cit
As the most expensive LIB cathode material with a large market share, LiCoO2 was chosen to be the research target of the first-time continuous hydrothermal leaching process. The conditions for the preliminary experiments were decided according to the results of the three-layer model and cold flow test.Fig. 4 shows the leaching efficiency of Li and Co at different times during the continuous hydrothermal leaching of LiCoO2 with H3Cit (0.4 mol L−1). At 15 min after the start of slurry feeding, which was the first sampling, the leaching efficiencies of Li and Co were 64% and 74%, respectively. Then, the leaching efficiency of the metals increased gradually with the extension of time, which can be attributed to the replacement of the H3Cit aqueous solution in the system with the slurry being insufficient immediately after the switching. At 60 min, which was the 10th sampling, the leaching efficiency of Li and Co achieved 81.3% and 92.7%, respectively, approaching the data obtained using a batch-style apparatus at 15 min.26 Therefore, the recovered solution or leachate with a high leaching efficiency can be collected continuously after 60 min of slurry feeding, even if the leaching efficiencies of Li and Co are expected to increase even after 60 min.
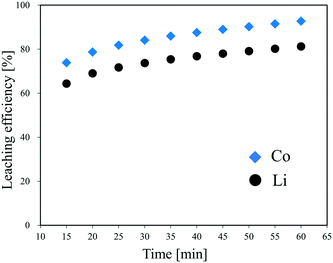 | ||
| Fig. 4 Effect of time on the leaching efficiency of Li and Co during the continuous hydrothermal leaching of LiCoO2 with H3Cit. | ||
This is the first time to achieve continuous leaching of LIB cathode materials by a hydrothermal method. Even though the current conditions may be far from the optimum, the results are sufficient to prove the feasibility of the continuous hydrothermal leaching process and the applicability of this flow system.
3.3 Problem analysis during continuous hydrothermal leaching of LiCoO2 with H3Cit
As this is the first run of a flow system for hydrothermal leaching, problems existed inevitably. Problem analysis is beneficial to the improvement of this technology. One of the most obvious problems is that metal ions other than Li and Co were analyzed from the recovered solution.Table 2 shows the concentration of each metal ion in the recovered solutions at different times during hydrothermal leaching of LiCoO2 with H3Cit. Except for Li and Co, Ni, Fe, Cr, and a tiny amount of Mn were detected. As a pure LiCoO2 compound was used in this study, the source of the other metal ions might be the steel materials used in the flow system. After comparing with the elemental composition of the stainless steel used in the flow system, SUS306 and SUS3016, as listed in Table 3, it can be inferred that the other metal ions must originate from the steel tubes used in the flow system. Additionally, the variation trend of the concentration with the extension of time was different for different metal ions. With the extension of time, the concentration of Li, Co, and Ni increased, while that of Mn, Fe, and Cr decreased first and then tended to be unchanged. This is probably because at the beginning of the reaction, H3Cit corrodes the pipe and then the wall of the tube is ‘protected’ by the accumulation of LiCoO2 as the reaction proceeds.
| Time [min] | Li [ppm] | Co [ppm] | Ni [ppm] | Mn [ppm] | Fe [ppm] | Cr [ppm] |
|---|---|---|---|---|---|---|
| a H3Cit: 0.4 mol L−1; flow rate: 30 ml min−1. | ||||||
| 15 | 472.9 | 4553.2 | 103.7 | 7.9 | 301.0 | 85.5 |
| 20 | 528.1 | 5138.2 | 103.9 | 6.4 | 275.7 | 79.3 |
| 25 | 555.8 | 5358.5 | 109.0 | 6.1 | 258.6 | 77.1 |
| 30 | 573.0 | 5551.5 | 115.9 | 5.9 | 246.1 | 74.8 |
| 35 | 591.3 | 5682.3 | 120.2 | 5.8 | 240.8 | 73.6 |
| 40 | 596.7 | 5800.4 | 126.6 | 5.6 | 235.9 | 74.6 |
| 45 | 611.7 | 5899.4 | 131.4 | 5.4 | 230.8 | 75.1 |
| 50 | 638.9 | 6071.5 | 139.0 | 5.8 | 236.9 | 77.5 |
| 55 | 650.5 | 6255.9 | 148.0 | 5.8 | 235.8 | 78.0 |
| 60 | 666.0 | 6412.9 | 151.8 | 5.6 | 234.2 | 78.4 |
| Ni [wt%] | Mn [wt%] | Fe [wt%] | Cr [wt%] | |
|---|---|---|---|---|
| a The steel types include SUS304 and SUS316. | ||||
| SUS304 | 8–11 | <2 | 67–69 | 18–20 |
| SUS316 | 10–14 | <2 | 64–66 | 16–18 |
The acid corrosion revealed here is an obvious problem in the further application, but its severity is much lower than that caused by the use of inorganic acids or high-concentration organic acids in the conventional leaching method. It is known that the acids must be used in all current leaching processes. Even though the corrosion caused by the acids cannot be eliminated completely, its damage is being reduced gradually in the green progress. For example, there are several feasible ways to avoid or suppress acid corrosion. One is to apply Teflon or coating materials with high acid corrosion resistance to the inner wall of the tubes. Another one is to choose organic acids with low or no acid corrosion as the leachant. In addition, continuous manufacturing is an unavoidable step before the practical application. Therefore, this research is believed to be beneficial and significant to the sustainable development of continuous leaching of LIB cathode materials in the future.
Conclusions
Continuous hydrothermal leaching of LiCoO2 with H3Cit was successfully achieved using a specially designed and customized flow system. Prior to the hydrothermal acid leaching experiment, a three-layer model was used to predict the flow state in this flow system, and a cold flow test using two kinds of flow lines was performed to determine the conditions in the preliminary experiments. From the viewpoints of suppressing the deposition and improving the operability, the pulp density of the slurry and the flow rate were set to 10 g L−1 and 30 ml min−1, respectively, and the position of feeding tanks was rearranged. In the first run of continuous hydrothermal leaching of LiCoO2 with H3Cit, the leaching efficiency of Li and Co reached 81.3% and 92.7%, respectively, at 60 min after the start of slurry feeding, and is expected to increase even after 60 min. It is promising to continuously obtain the recovered solution or leachate with a high leaching efficiency by continuing the operation, indicating that the continuous hydrothermal leaching process is feasible and promising to be applied. Except for Li and Co, other metal ions were detected in the recovered solution, which was proven to originate from the stainless steel used in the flow system. Meanwhile, the acid corrosion caused by H3Cit was revealed, which is expected to be resolved by using inner coating materials with high acid corrosion resistance or organic acids with low or no acid corrosion as the leachant.Conflicts of interest
There are no conflicts to declare.Acknowledgements
This work was supported by the Japan Science and Technology Agency (JST)-Mirai program [grant number JP18077450] and the Japan Society for the Promotion of Science (JSPS)-Grant-in-Aid for Challenging Exploratory Research [grant number No. 18K18966].Notes and references
- Y. Nishi, J. Power Sources, 2001, 100, 101–106 CrossRef CAS.
- B. Scrosati, J. Hassoun and Y. K. Sun, Energy Environ. Sci., 2011, 4, 3287–3295 RSC.
- W. Gao, J. Song, H. Cao, X. Lin, X. Zhang, X. Zheng, Y. Zhang and Z. Sun, J. Cleaner Prod., 2018, 178, 833–845 CrossRef CAS.
- J. W. Fergus, J. Power Sources, 2010, 195, 939–954 CrossRef CAS.
- C. Liu, J. Lin, H. Cao, Y. Zhang and Z. Sun, J. Cleaner Prod., 2019, 228, 801–813 CrossRef CAS.
- M. K. Jha, A. Kumari, A. K. Jha, V. Kumar, J. Hait and B. D. Pandey, Waste Manage., 2013, 33, 1890–1897 CrossRef CAS PubMed.
- C. K. Lee and K.-I. Rhee, J. Power Sources, 2002, 109, 17–21 CrossRef CAS.
- M. Chen, X. Ma, B. Chen, R. Arsenault, P. Karlson, N. Simon and Y. Wang, Joule, 2019, 3, 2622–2646 CrossRef CAS.
- F. Gu, P. A. Summers and P. Hall, J. Cleaner Prod., 2019, 237, 117657 CrossRef CAS.
- R. Golmohammadzadeh, F. Faraji and F. Rashchi, Resour., Conserv. Recycl., 2018, 136, 418–435 CrossRef.
- Q. Meng, Y. Zhang and P. Dong, J. Cleaner Prod., 2018, 180, 64–70 CrossRef CAS.
- X. Chen, C. Luo, J. Zhang, J. Kong and T. Zhou, ACS Sustainable Chem. Eng., 2015, 3, 3104–3113 CrossRef CAS.
- X. Zheng, Z. Zhu, X. Lin, Y. Zhang, Y. He, H. Cao and Z. Sun, Engineering, 2018, 4, 361–370 CrossRef CAS.
- D. A. Ferreira, L. M. Z. Prados, D. Majuste and M. B. Mansur, J. Power Sources, 2009, 187, 238–246 CrossRef CAS.
- P. Meshram, Abhilash, B. D. Pandey, T. R. Mankhand and H. Deveci, JOM, 2016, 68, 2613–2623 CrossRef CAS.
- L. Li, W. Qu, X. Zhang, J. Lu, R. Chen, F. Wu and K. Amine, J. Power Sources, 2015, 282, 544–551 CrossRef CAS.
- L. Li, J. B. Dunn, X. X. Zhang, L. Gaines, R. J. Chen, F. Wu and K. Amine, J. Power Sources, 2013, 233, 180–189 CrossRef CAS.
- L. Li, J. Ge, F. Wu, R. Chen, S. Chen and B. Wu, J. Hazard. Mater., 2010, 176, 288–293 CrossRef CAS PubMed.
- F. Meng, Q. Liu, R. Kim, J. Wang, G. Liu and A. Ghahreman, Hydrometallurgy, 2020, 191, 105160 CrossRef CAS.
- G. P. Nayaka, J. Manjanna, K. V. Pai, R. Vadavi, S. J. Keny and V. S. Tripathi, Hydrometallurgy, 2015, 151, 73–77 CrossRef CAS.
- S. Natarajan, A. B. Boricha and H. C. Bajaj, Waste Manage., 2018, 77, 455–465 CrossRef CAS PubMed.
- L. Li, E. Fan, Y. Guan, X. Zhang, Q. Xue, L. Wei, F. Wu and R. Chen, ACS Sustainable Chem. Eng., 2017, 5, 5224–5233 CrossRef CAS.
- L.-P. He, S.-Y. Sun, Y.-Y. Mu, X.-F. Song and J.-G. Yu, ACS Sustainable Chem. Eng., 2017, 5, 714–721 CrossRef CAS.
- X. Zeng, J. Li and B. Shen, J. Hazard. Mater., 2015, 295, 112–118 CrossRef CAS PubMed.
- G. P. Nayaka, K. V. Pai, G. Santhosh and J. Manjanna, J. Environ. Chem. Eng., 2016, 4, 2378–2383 CrossRef CAS.
- T. Aikawa, M. Watanabe, T. M. Aida and R. L. Smith Jr, Kagaku Kogaku Ronbunshu, 2017, 43, 313–318 CrossRef CAS.
- L. Li, J. Lu, Y. Ren, X. X. Zhang, R. J. Chen, F. Wu and K. Amine, J. Power Sources, 2012, 218, 21–27 CrossRef CAS.
- D. Azuma, T. Aikawa, Y. Hiraga, M. Watanabe and R. L. Smith Jr, Kagaku Kogaku Ronbunshu, 2019, 45, 147–157 CrossRef CAS.
- G. S. Calabrese and S. Pissavini, AIChE J., 2011, 57, 828–834 CrossRef CAS.
- L. Rogers and K. F. Jensen, Green Chem., 2019, 21, 3481–3498 RSC.
- P. Doron and D. Barnea, Int. J. Multiphase Flow, 1993, 19, 1029–1043 CrossRef CAS.
- P. Doron, D. Granica and D. Barnea, Int. J. Multiphase Flow, 1987, 13, 535–547 CrossRef CAS.
Footnote |
| † Electronic supplementary information (ESI) available: Information of the linear fitting lines for the plots used in the kinetic study. See DOI: 10.1039/d0re00286k |
| This journal is © The Royal Society of Chemistry 2020 |

