Active learning-driven quantitative synthesis–structure–property relations for improving performance and revealing active sites of nitrogen-doped carbon for the hydrogen evolution reaction†
Elvis Osamudiamhen
Ebikade‡
ab,
Yifan
Wang‡
ab,
Nicholas
Samulewicz
ab,
Bjorn
Hasa
a and
Dionisios
Vlachos
 *ab
*ab
aCatalysis Center for Energy Innovation, University of Delaware, 221 Academy St., Newark, DE 19716, USA. E-mail: vlachos@udel.edu
bDepartment of Chemical and Biomolecular Engineering, University of Delaware, 150 Academy St., Newark, DE 19716, USA
First published on 4th September 2020
Abstract
While quantitative structure–property relations (QSPRs) have been developed successfully in multiple fields, catalyst synthesis affects structure and in turn performance, making simple QSPRs inadequate. Furthermore, catalysts often have multiple active sites preventing one from obtaining insights into structure–property relations. Here, we develop a data-driven quantitative synthesis–structure–property relation (QS2PRs) methodology to elucidate correlations between catalyst synthesis conditions, structural properties and observed performance and to provide fundamental insights into active sites and a systematic way to optimize practical catalysts. We demonstrate the approach to the synthesis of nitrogen-doped catalysts (NDCs) made via pyrolysis for the performance of the electrochemical hydrogen evolution reaction (HER), quantified by the onset potential and the current density. We determine crystallinity, nitrogen species type and fraction, surface area, and pore structure of the NDCs using XRD, XPS, and BET characterization. We demonstrated that an active learning-based optimization combined with various elementary machine learning tools (regression, principal component analysis, partial least squares) can efficiently identify optimum pyrolysis conditions to tune structural characteristics and performance with concomitant savings in materials and experimental time. Unlike previous reports on the importance of pyridinic or graphitic nitrogen, we discover that the electrochemical performance is not driven by a single catalyst property; rather, it arises from a multivariate influence of nitrogen dopants, pore structure and disorder in the NDC materials. Identification of active sites can help mechanistic understanding and further catalyst improvement.
1. Introduction
Quantitative structure–property relations (QSPR) have been used widely by materials science and systems communities to create a map that relates structure with performance. As an example the composition of complex, multicomponent materials of batteries can be linked to performance1,2 and the properties fuels can be related to the mixture composition.3,4 QSPRs are powerful as they allow one to optimize materials and design systems. The UNIFAC modeling platform,5–7 and in general the group additivity framework, is such an example of how molecular structure is correlated with thermophysical properties for both fluid6,8 and catalytic systems.9–11 In catalysis, such QSPRs are generally lacking. The catalyst structure and composition dictate reaction performance but the structure is often not the thermodynamically most stable one; rather it is some metastable structure. As a result, performance optimization12,13 requires careful control of the catalyst synthesis and/or of the pre-treatment. This fact requires extension of typical QSPRs to link synthesis to structure and structure to performance, i.e., to develop QS2PR (quantitative synthesis–structure–performance relations). Another complexity in catalysis is that multiple active sites can be present on a catalyst and play a different role in performance. Identification of the active site(s) is critical to perform mechanistic studies and find ways to maximize their density. Yet, relation between performance and active site is frequently non-trivial. A methodology is needed to develop these correlations in an unsupervised or semi-supervised manner to provide fundamental insights and a systematic way to optimize practical catalysts. This is the overarching goal of this contribution. We choose the hydrogen evolution reaction (HER) to illustrate our approach.HER is a key process for renewable energy technologies,14 such as fuel cells, batteries, and water-splitting. Nitrogen-doped metal-free carbon catalysts (NDCs) have been found to perform electrocatalytic HER,15–18 providing a cheaper but equally efficient alternative to Pt-based materials.19 The presence of N species changes the spin density, electronic properties, and charge distribution of the carbon framework by introducing electron-donor characteristics from its lone pair electrons and enhancing the carbon catalytic activity in electron-transfer reactions.14,20,21 Generally, three types of N are found in NDCs: pyridinic N, pyrrolic N, and graphitic N (Scheme 1), categorized based on the N species hybridization and the number of neighboring C atoms. Graphitic and pyridinic nitrogens are sp2 hybridized. Graphitic N binds to three carbon atoms and shares the additional electron with the carbon framework in a partially occupied π*-bond, while pyridinic N typically occupies edges of the carbon framework, forming σ-bonds22 with two neighboring carbon atoms. Pyrrolic N is sp3 hybridized, contributing two electrons to the π system, and bound into the five-membered ring, as in pyrrole.
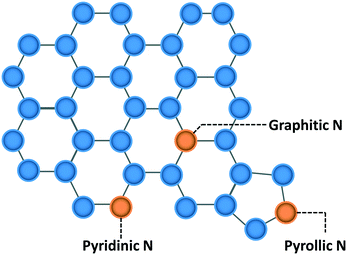 | ||
| Scheme 1 Different types of nitrogen in the carbon framework (blue circles are carbon atoms; orange circles are nitrogen atoms). | ||
Despite progress in developing NDCs, identifying the active N species driving the observed electrochemical activity remains controversial.14,21,23 Reports suggest that the active catalyst site is either pyridinic nitrogen20 or graphitic nitrogen.17 Aside from the nitrogen doping content, other parameters or features of a catalyst, such as the nitrogen species distribution, the presence of surface defects, the porosity, and the pore size distribution, may also influence the electrochemical performance. Therefore, to navigate such highly multidimensional systems, we often change experimentally one parameter at a time, and this prevents us from understanding (a) correlations between parameters, (b) the active site, and (c) how to optimize catalytic performance by changing all features at once. Factorial design of experiments (DoE) has been proposed long ago24,25 and is occasionally employed to optimize the catalyst performance, for example the catalyst composition of multicomponent catalysts.17,26–29 However, the traditional DoE is static in nature. Therefore, methods, which capture interactions in multidimensional systems and more importantly relate synthesis conditions, characterization, and performance, are clearly needed.
Active learning refers to the broad idea of a model “learning” from data, proposing next experiments or calculations and eventually improving model accuracy with less training or less data.30,31 Bayesian optimization, known also as kriging, is an efficient active learning methodology applied32–34 in artificial intelligence35,36 and engineering problems.37–41 It can produce accurate surrogate models and efficiently locate global optima. Despite its application in computational studies, its deployment in designing physical experiments has been limited. This provides a great opportunity to apply kriging-based active learning to facilitate the design of physical experiments, e.g., in our testcase to optimize the NDC synthesis, catalyst structure and HER performance.
Here, we employed a data-driven experimental design using kriging-based active learning optimization towards synthesizing NDC electrocatalysts for the HER reaction. The electrocatalytic performance was evaluated using the rotating disk electrode (RDE), and the catalyst structural characteristics were examined using X-ray photoelectron spectroscopy (XPS), X-ray diffraction (XRD), and nitrogen-sorption measurements. Kriging-based active learning guides the synthesis towards an optimum NDC structure. Using principal component analysis (PCA), partial least squares (PLS), and ordinary least squares (OLS) regressions on the type of doped nitrogen, pore structure, porosity, degree of crystallinity and catalyst synthesis conditions, we develop QS2PRs that relate synthesis conditions to structure and electrocatalyst properties. With such relations and additional active learning optimization, we can tailor the hierarchical structures and surface dopants of the NDC catalysts for optimal HER performance. To the best of our knowledge, a systematic data-driven experimental design combined with machine learning analysis for physical experiments has not been reported, specifically for developing and evaluating NDC materials towards the HER in our case. Our machine learning analysis reveals the inherent multi-dimensionality of these systems as the observed HER performance (onset potential and maximum current density) is driven by combined contributions from nitrogen dopants, pore structure and disorder incorporation in the NDC materials.
2. Materials and methods
2.1. List of chemicals
Solid crystalline urea (99.3 +%) and activated carbon (Ketjenblack® EC-300J) were purchased from Alfa Aesar and Akzo Nobel, respectively, and were used as received. Nafion® solution and sulfuric acid were purchased from Sigma Aldrich.2.2. Catalyst preparation
The N-doped catalysts were prepared by simple pyrolysis of nitrogen precursors onto various supports under helium gas at 300–500 °C. The preparation of N-doped catalysts is typically as follows: 1 g of urea was dissolved in 10 ml of deionized water and mixed with 0.5 g of activated carbon followed by evaporation at 60 °C, overnight to remove water. The obtained catalyst precursor was ground using a ceramic mortar and pestle into fine powder, transferred into a quartz boat crucible and pyrolyzed in a tube furnace (Thermo Scientific Lindberg Blue M model) setup with an inert gas (He) at conditions specified by the experimental design.2.3. Catalyst characterization
SEM analysis of the materials was performed on an Auriga 60 microscope (Carl Zeiss NTS GmbH, Germany) equipped with a Schottky field emission gun (FEG). All samples were deposited on adhesive carbon tape and sputtered by a DESK IV sputter unit (Denton Vacuum Inc. NJ, USA) equipped with Au/Pd target. XRD patterns of the NDC catalysts were recorded on a diffractometer (Bruker D8) equipped with a CuKα radiation source (λ = 0.154 nm) at 40 kV and 40 mA. A Thermo-Fisher K-alpha + X-ray photoelectron spectrometer (XPS) equipped with a monochromatic aluminum K-alpha X-ray source (400 μm) was used. N2 adsorption measurements were performed using a micrometrics ASAP 2020 surface area and porosity analyzer. The carbon![[thin space (1/6-em)]](https://www.rsc.org/images/entities/char_2009.gif) :
:![[thin space (1/6-em)]](https://www.rsc.org/images/entities/char_2009.gif) nitrogen ratio of the urea impregnated carbon catalyst was obtained using a carbon, nitrogen, hydrogen, and sulfur (CHNS) elemental cube analyzer.
nitrogen ratio of the urea impregnated carbon catalyst was obtained using a carbon, nitrogen, hydrogen, and sulfur (CHNS) elemental cube analyzer.
Analysis of the XPS data was carried out using the Thermo Fisher Avantage surface chemical analysis program. All XPS spectra presented were performed following subtraction of a Shirley background and were fitted using components with a mixed Gaussian–Lorentzian line shape with a standard peak type. Full-width-half-maximum (FWHM) values42–44 were constrained within the range 0.8–1.2 eV for C 1s, 1.0–1.4 eV for N 1s, and 1.6–2.0 eV for O 1s spectra. These parameters were consistently used for all spectra fittings. N 1s spectra binding energy assignments were based on literature reports14,17,43,45 and the Thermo Fisher Avantage XPS knowledge library. The O 1s and C 1s spectra peak assignments were based on Schlögl et al.43 and the Thermo Fisher Avantage XPS knowledge library. These peak assignments are summarized in Table 1.
| C 1s | O 1s | N 1s | |||
|---|---|---|---|---|---|
| sp2-C | 284.8 | C–O | 532.8 | Pyridinic N | 398.3 |
| sp3-C | 285.7 | C–OH | 533.7 | Pyrrolic N | 399.8 |
| C–O | 286.2 | Adsorbed H2O | 534.8 | Graphitic N | 401.1 |
C![[double bond, length as m-dash]](https://www.rsc.org/images/entities/char_e001.gif) O/C–N O/C–N |
288.3 |
2.4. Electrochemical measurements
Nitrogen doped carbon (2 mg) was ultrasonically dispersed in a 50![[thin space (1/6-em)]](https://www.rsc.org/images/entities/char_2009.gif) :
:![[thin space (1/6-em)]](https://www.rsc.org/images/entities/char_2009.gif) 50 by volume water and isopropanol mixture containing 10 μL of 5 wt% Nafion® solution until a homogeneous catalyst ink was obtained. Thereafter, 10 drops of 5 μL of the above dispersion was drop-casted onto a pre-cleaned glassy carbon electrode (GCE) with 0.185 cm2 geometrical area. The catalyst modified GCE was dried under ambient conditions and served as the working electrode (WE). Electrochemical measurements were carried out using a standard three-electrode cell using a large area Pt wire as a counter electrode and a saturated calomel electrode (SCE) as a reference electrode for studying HER activity in acidic medium (0.5 M H2SO4). Linear scanning voltammetry (LSV) experiments were conducted at a potential window −0.3 to 1.1 V (vs. SCE) with a scan rate of 5 mVs−1 in order to evaluate electrochemical activity for the hydrogen evolution reaction (HER).
50 by volume water and isopropanol mixture containing 10 μL of 5 wt% Nafion® solution until a homogeneous catalyst ink was obtained. Thereafter, 10 drops of 5 μL of the above dispersion was drop-casted onto a pre-cleaned glassy carbon electrode (GCE) with 0.185 cm2 geometrical area. The catalyst modified GCE was dried under ambient conditions and served as the working electrode (WE). Electrochemical measurements were carried out using a standard three-electrode cell using a large area Pt wire as a counter electrode and a saturated calomel electrode (SCE) as a reference electrode for studying HER activity in acidic medium (0.5 M H2SO4). Linear scanning voltammetry (LSV) experiments were conducted at a potential window −0.3 to 1.1 V (vs. SCE) with a scan rate of 5 mVs−1 in order to evaluate electrochemical activity for the hydrogen evolution reaction (HER).
2.5. Kriging-based active learning methods and software
The initial DoE and subsequent sampling points were generated using pyKriging, an open source kriging software in Python.46 The mathematical foundation of the software originates from the work of Jones47,48 and Forrester.492.6. Machine learning analysis
PCA and PLS regression were carried out using the Minitab software.503. Selection of variables and mappings via expert knowledge
Improving the performance of the catalyst is the overarching objective of this work. In order to achieve this, first we need to define the number and specific variables of each of the three spaces, synthesis, structure, and performance. The number of (linearly independent) variables defines the dimensionality of a space. We elaborate on the variables for our specific example and the topic of linear independence of variables framed in a more general way.Expert knowledge is used to define the variables of each space, based on what matters in a process, what important variables can be controlled in synthesis, and what are good structural features that can be measured. For electrochemical performance, we focus on the onset potential and the current density, which together define a two-dimensional (2D) performance space. Other metrics, such as process cost and sustainability, could also be considered.
For synthesis, the final temperature, the heating rate during pyrolysis, and the hold time at the maximum pyrolysis temperature are selected as tunable parameters. These parameters define a three dimensional (3D) experimental synthesis space. One could easily consider additional synthesis parameters and let the important synthesis parameters be auto-selected as described below. For example, the ratio of reagents and drying conditions in preparation of the catalyst precursor could have also be considered but this was not done here as we found that the urea concentration was unimportant above a certain value and pyrolysis conditions control chiefly the material made. The feasible bounds of these parameters are shown in Table 2. Tuning the synthesis conditions within the bounds would lead to desired structural features, and ultimately to improved electrochemical performance.
| Lowest value | Highest value | ||
|---|---|---|---|
| Final temperature (°C) | 300 | 500 | |
| Heating rate (°C min−1) | 3 | 8 | |
| Hold time (h) | 2 | 6 |
Since the nitrogen species are the active sites for the electrochemical HER reactions,17 we hypothesize that the type and amount of nitrogen potentially control HER electrochemical performance. Note that the three types and the total content of N are not independent as the sum of the three types equals the total. The current hypothesis is that the higher the N content, the higher the performance.14,17,20,51–53 However, the active site is somewhat controversial, as mentioned above, and we would be interested in identifying the active site using our approach. Aside from the total amount and type of N atoms, the pore volume, the surface area, and the degree of crystallinity could affect performance. We define these six collective variables as our structural features, which are often referred to as materials characteristics, traits, or descriptors in literature. This defines a 6D materials structure space. Depending on the problem to be tackled, we propose to include also other spectroscopic features, if available, in the characterization space.
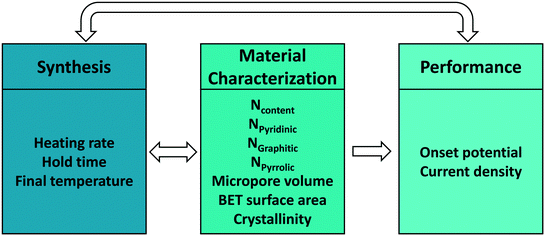
Upon defining the variables for each space, our goal is to develop mappings between spaces. Each mapping is, in a mathematical sense, a set of data-driven models describing the relations between two spaces (Fig. 1). Active learning, denoted by the double-sided arrows, enables the data flowing in both directions, connecting synthesis and characterization, and synthesis and performance in our case. While one could directly connect synthesis with performance without characterization, developing both synthesis–structure and structure–performance maps is essential in identifying the active site and deriving other fundamental insights. These may lead to tailored synthesis methods for increasing the active site concentration and enhancing the overall performance.
4. Prototypical characterization results
The NDC synthesis was initially exploited with respect to urea loading during the wet impregnation step. A fixed amount of carbon precursor – 0.5 g activated carbon was added to different concentrations of urea (0.1, 0.2, 0.4 and 0.6 g ml−1) and oven dried. After drying the urea-impregnated carbon materials, the C![[thin space (1/6-em)]](https://www.rsc.org/images/entities/char_2009.gif) :
:![[thin space (1/6-em)]](https://www.rsc.org/images/entities/char_2009.gif) N ratio was determined using the CHNS analyzer. The results indicate that above a urea concentration of 0.2 g ml−1, the C
N ratio was determined using the CHNS analyzer. The results indicate that above a urea concentration of 0.2 g ml−1, the C![[thin space (1/6-em)]](https://www.rsc.org/images/entities/char_2009.gif) :
:![[thin space (1/6-em)]](https://www.rsc.org/images/entities/char_2009.gif) N ratio plateaus with increasing urea concentration (Fig. S1†). This is likely a result of the carbon being saturated with urea at high loadings, as urea deposits are seen after drying the impregnated catalysts for loadings >0.1 g ml−1 (Fig. S2†). Therefore, we use 0.5 g carbon precursor in 10 ml of 0.1 g ml−1 urea solution for further studies. The surface morphology of the catalyst raw materials (urea and activated carbon (ECBJ-300)) is shown in Fig. 2. The activated carbon precursor has a well-defined porous structure (Fig. 2A), while urea exists as dense non-porous solid blocks (Fig. 2B).
N ratio plateaus with increasing urea concentration (Fig. S1†). This is likely a result of the carbon being saturated with urea at high loadings, as urea deposits are seen after drying the impregnated catalysts for loadings >0.1 g ml−1 (Fig. S2†). Therefore, we use 0.5 g carbon precursor in 10 ml of 0.1 g ml−1 urea solution for further studies. The surface morphology of the catalyst raw materials (urea and activated carbon (ECBJ-300)) is shown in Fig. 2. The activated carbon precursor has a well-defined porous structure (Fig. 2A), while urea exists as dense non-porous solid blocks (Fig. 2B).
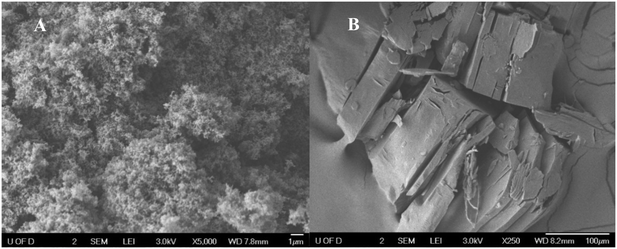 | ||
| Fig. 2 Scanning electron micrographs. A) Ketjenblack® EC-300J – carbon precursor. B) Urea – nitrogen precursor. | ||
The obtained NDC catalysts were characterized using different techniques. XRD shows two broad diffraction peaks at 2θ of 24.8° and 44.1° (Fig. S3†) indexed54 to the (002) and (101) facets of graphite. The crystallinity of NDC catalysts has been shown to change by the addition or removal of structural defects54 and nitrogen incorporation52,55 and is hereafter used as a measure of defect/disorder.55,56 The Scherrer equation provides an estimate of the degree of crystallinity of each catalyst, and our XRD patterns indicate that nitrogen doping changes the degree of crystallinity (Table S1†).
The surface area and porous structure of the resulting samples were also characterized by N2 adsorption/desorption measurements. N2 physisorption isotherms are shown in Fig. 3A and S4.† All catalysts exhibit well-defined adsorption–desorption isotherms with a clear hysteresis loop associated with capillary condensation of inert species at higher relative pressures in the mesopores. Rapid nitrogen uptake (P/P0 ∼ 0.1) confirms the existence of micropores in NDCs. The existence of micropores greatly enhances the specific surface area, providing channels for electron transport. The pore geometry, surface area, and micropore volume were analyzed using the BET (Braunauer, Emmett and Teller) equation and BJH (Barrett–Joyner–Halenda) pore-size distributions measurements (Fig. 3B). The pore size distribution indicates that the NDC catalysts possess large pores mainly composed of mesopores and macropores. Mesopores facilitate transport of reagents and reaction intermediates toward and from the catalytic sites. Sharp rise in N2 adsorption uptake at higher relative pressure indicates the presence of macropores.57 Altogether, it is expected that such a hierarchical structure enhances diffusion of H2 and the HER activity.
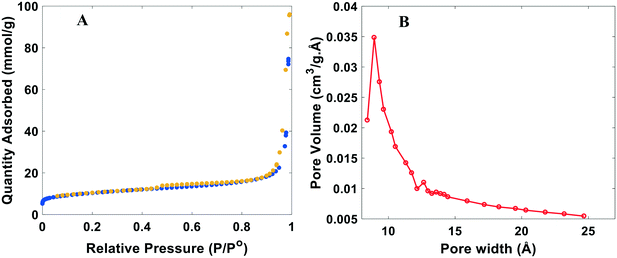 | ||
| Fig. 3 Typical BET analysis of the nitrogen doped catalysts (NDC). A) N2 adsorption (blue)/desorption (yellow) isotherm. B) BJH pore size distribution. Plots shown are for the NDC19, with synthesis conditions for this catalyst and others in Table S1.† | ||
XPS was performed to investigate the chemical composition and bonding configurations of elements in the NDC catalysts. Fig. 4 and S5† confirm the presence of C, O, and N in the NDCs. The corresponding atomic percentages of N are listed in Table S1.† The fitted high-resolution C 1s spectrum shows four peaks43 at about 284.8, 285.7, 286.2, and 288.3 eV, corresponding to sp2-C, sp3-C, C–O and C![[double bond, length as m-dash]](https://www.rsc.org/images/entities/char_e001.gif) O/C–N, respectively (Fig. 4B). The O 1s XPS spectra of the NDC catalysts are shown in Fig. 4C. Three types of O species are observed. The peak at 532.8 eV, 533.7, eV and 534.8 eV can be assigned to C–O, C–OH, and adsorbed water species, respectively.43
O/C–N, respectively (Fig. 4B). The O 1s XPS spectra of the NDC catalysts are shown in Fig. 4C. Three types of O species are observed. The peak at 532.8 eV, 533.7, eV and 534.8 eV can be assigned to C–O, C–OH, and adsorbed water species, respectively.43
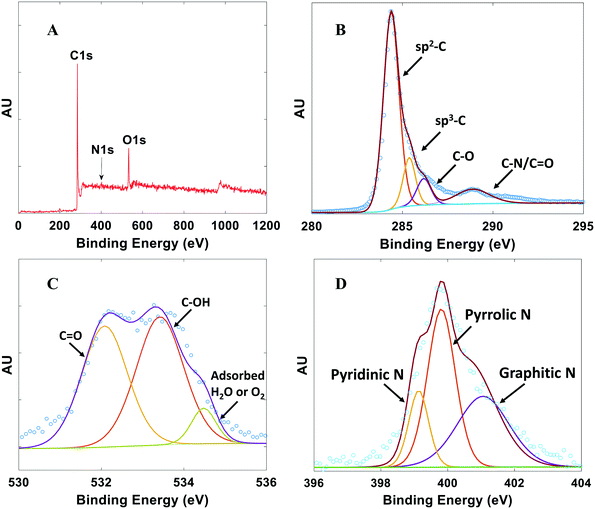 | ||
| Fig. 4 Typical XPS spectra for NDCs. A) Full survey scan. B) High resolution C 1s scan. C) High resolution O 1s scan. D) High resolution N 1s scan. Plots shown are for NDC19 with synthesis conditions for this catalyst and others in Table S1.† | ||
Successful doping of N atoms into the carbon skeleton is evidenced from the corresponding high-resolution N 1s spectrum (Fig. 4D). Pyridinic N (398.3 eV), pyrrolic N (399.8 eV), and graphitic N (401.1 eV) species are observed.14,17,43,45
5. Kriging-based active learning
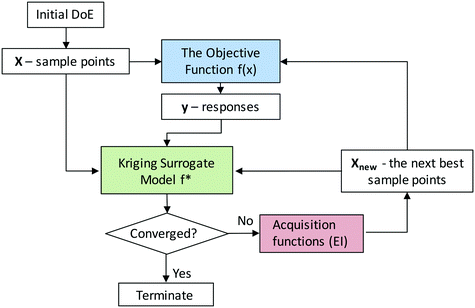
Here we consider the NDC synthesis process as the objective function with the synthesis conditions as the input parameters and the total N content as the response that we would like to optimize. Since the true objective function is typically unknown, one needs to approximate it with a surrogate model, which is cheap to evaluate in the optimization process. Kriging methods can be used to construct accurate surrogate models and locate global optima given bounds of input parameters. The kriging-based active learning algorithm is described in Fig. 5. The first step requires a training set of initial sample points including both the input parameter values and the response values from the experiments. We use a latin hypercube design (Fig. S6†) to sample the three-dimensional experimental space.49 Second, a surrogate model is constructed using a normally distributed multivariate function (a Gaussian process (GP))58 given this initial training set. By learning from the data and measuring the similarity between points, GP can predict the response value for an unseen point with an uncertainty estimate. The uncertainty is low near the sampled regions but high in regions with a low number of sampling points. Third, the expected improvement (EI) acquisition function helps the model decide where to sample next, i.e., what experiments to do next. Generally, EI directs additional sampling in regions of higher uncertainty or better performance, and by doing so, it significantly reduces the number of experiments required to identify the optimum with improved accuracy. Sampling in regions of high uncertainty is usually referred as “exploration”, whereas sampling in regions of high expected performance is referred as “exploitation”. EI offers a good balance between the exploration and exploitation tradeoff.59,60 Next, the response values at these additional sampling points are obtained from a new set of experiments and added to the training set. The model is then updated, and the process is iterated until the observed optimum converges.For our specific example, with an initial design of 10 points, we trained an initial surrogate model and further used kriging to generate 3 additional points per iteration, i.e., a third of the initial test size, to adequately capture changes as the experimental design evolved. All sampling points are visualized in the 3-dimensional space shown in Fig. S6.†
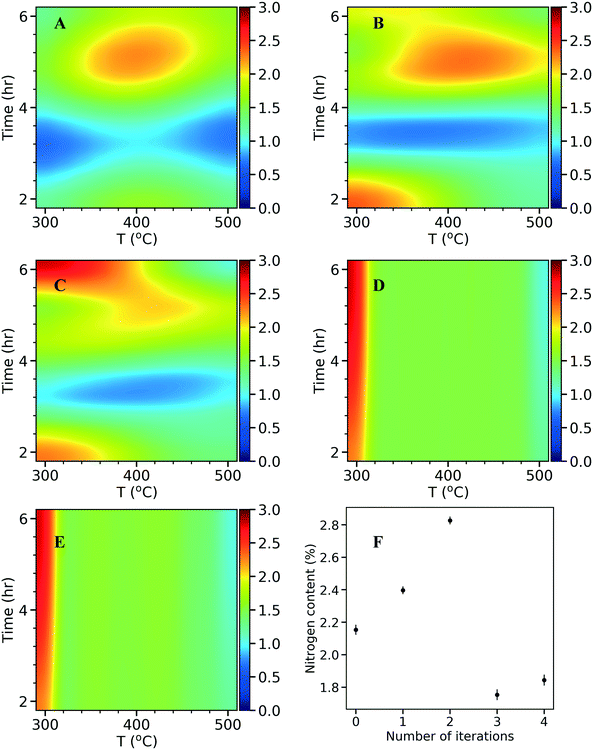
In each iteration, the surrogate model can be visualized in 2D by varying the final temperature and hold time at a constant heating rate. As described in the kriging method above, the total N content was optimized as the response variable and the model predicted values are plotted as response surfaces (Fig. 6A–E). The N content found in experiments in each iteration is plotted as a function of the number of iterations (Fig. 6F). The model of the initial 10 points (Fig. 6A) indicates an optimum N content around 2 wt%. Therefore, the algorithm suggests an optimum around the edge points where one of the input parameters takes its extreme value. After the first iteration (Fig. 6B), the nitrogen content increases (intensified orange color on the heat map), and shifts to the top and bottom left corners. After the second iteration (Fig. 6C), a stronger intensity in the heat map is observed at the top left corner where a higher N content of 2.8 wt% is discovered. In the following iterations, since the algorithm has sampled enough in the region (i.e., exploitation), it explores other regions improving the overall accuracy of the model (from Fig. 6C and D) and the response surfaces remains unchanged (from Fig. 6D to E). This can also be seen in Fig. 6F, as the N content decreases in the third and fourth iterations, suggesting an exploration with no increased N. This process highlights the utility of a data driven approach for optimizing the catalysts synthesis. If a traditional central composite design with three factors was used, a total of 40 experiments would had been needed to obtain a response surface which might not cover the true optimum. With kriging based active learning, we efficiently reduced experimental time (<20 runs to identify an optimum) and consumables. Optimal conditions for synthesizing NDCs from activated carbon and urea precursors with maximum N content are at a final temperature of 300 °C, heating rate of 8 °C min−1, and a hold time of 6 h. Extending the hold time did not improve the N content further, as the N content was at 2.79 wt% at a hold time of 8 h (vs. 2.82 wt% at a hold time of 6 h).
The kriging model relates the synthesis conditions to the N content; however, its mathematical expression is elusive. To obtain an explicit expression, we build a simple model (eqn (1)), using multivariate OLS regression with three synthesis conditions as the independent variables and the total N content as the response variable, as typically done in building response surfaces in design of experiments.
| Total N Content = 2.78 + 8.01 × 10⁻³ Temperature − 0.343 Heating rate − 0.806 Hold time − 1.02 × 10⁻⁵ Temperature2 − 3.26 × 10⁻⁴ Temperature·Heating rate − 4.17 × 10⁻⁴ Temperature·Hold time + 3.34 × 10⁻² Heating rate2 + 2.57 × 10⁻² Heating rate·Hold time + 0.113 Hold time2 | (1) |
The total N content, temperature, heating rate, and the hold time are in units of wt%, °C, °C min−1 and h. We use MAE (mean absolute error) to quantify errors in model predictions. The model gives a reasonable MAE of 0.31 wt%. These equations are used later to gain insights into how to optimize the HER performance.
5.1. Synthesis–structure causalities via machine learning
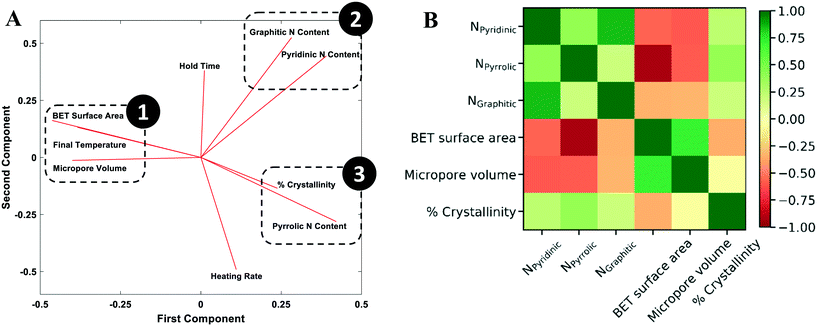
To understand how synthesis affects the catalyst structural characteristics (Table S1†), PCA was performed. PCA is a useful statistical tool for identifying the number of independent factors, reduction of dimensionality,61 and revealing correlations62 and the importance of various factors. It emphasizes variation between parameters and brings out patterns in a dataset, making data easy to explore and visualize. In our case, the dataset consists of 9 features; six are the structural features (BET surface area, micropore volume, crystallinity, graphitic nitrogen content, pyridinic nitrogen content, and pyrrolic nitrogen content) and three are the synthesis conditions (final temperature, hold time, and heating rate). The scree plot (Fig. S7†) shows that three principal components explain 75% of the variation and are sufficient for an exploratory analysis. Generally, factors that are clustered together show strong positive correlation and those orthogonal to each other show little or no correlation. Factors on opposite side of the PCA plot possess an inverse correlation.The two principal components that account for most of the variability in the dataset are shown in the loading plot (Fig. 7A). The results clearly show three clustered groups: group 1 includes the surface area, the micropore volume, and the final temperature; group 2 includes the graphitic and pyridinic N content; and group 3 includes the defect/disorder capturing the % crystallinity and the pyrrolic N content. Fig. 7 reveals several interesting points. The final pyrolysis temperature is positively correlated with the surface area and the micropore volume. As the temperature increases, the nitrogen species embedded in the pores and the carbon framework gasify, resulting in a higher surface area and a more porous catalyst.63–65 The final temperature (group 1) is nearly antiparallel with the graphitic and pyridinic N in group 2 and the pyrrolic N in group 3, indicating an inverse relationship between them, i.e., as the final temperature increases, all three types of N are reduced. This fact also indicates that there is tradeoff between increasing surface area and microporous volume and controlling the N content.
There is a clear relation between the pyridinic and graphitic nitrogen content with the hold time; the longer the hold time, the more these types of N form. These two N species are the most dominant nitrogen species in NDC materials,20 with pyrrolic nitrogen sometimes converting into the graphitic and pyridinic species over time.26 The heating rate is almost orthogonal to these N types, i.e., it does not affect them. An underlying assumption made is that the N species distribution measured macroscopically, using XPS, is represented by three N types. Obviously, each type captures the spatial average distribution, including any defects, of the local environment of N atoms that cannot be identified by measurements. Computational studies and atomic scale microscopy, which can elucidate species distribution in finer detail, will be important for future work.
The degree of crystallinity and the pyrrolic nitrogen content (group 3) are strongly correlated. As pyrrolic nitrogen is doped onto the carbon material, disorder is induced in the framework.56 Pimenta et al. had observed a localization of the d-band intensity at the edges of the carbon framework.56 Also, pyrrolic N is thermolabile17,26,54 and evaporates from the carbon material with increasing temperature, leaving behind surface defects. The heating rate affects positively and the final pyrolysis temperature negatively these two structural characteristics. On the other hand, the hold time does not affect these structural features.
The covariance matrix (Fig. 7B) indicates that the 3 structural feature pairs are strongly correlated with each other, including (1) BET surface area and pyrrolic N content (covariance = −0.92), (2) pyridinic N content and graphitic N content (covariance = 0.84), and (3) micropore volume (VM) and BET surface area (covariance = 0.71). The observations agree with the PCA results shown in Fig. 7A. The features in pair (1) are in 180 degrees in the principal component (PC) 1-principal component (PC) 2 space suggesting a strong negative correlation; and the features in pair (2) and (3) are found in the same clustered groups suggesting a strong positive correlation.
Mathematically, since the synthesis conditions control the structural characteristics, it is more appropriate to refer to these relations as causalities rather than correlations. We used PCA to provide physical insights into which synthesis conditions control the key physical characteristics of the catalyst. In this respect, we use PCA as an interpretive tool of the synthesis-characterization mapping.
5.2. Electrochemical performance–structural characteristics correlations
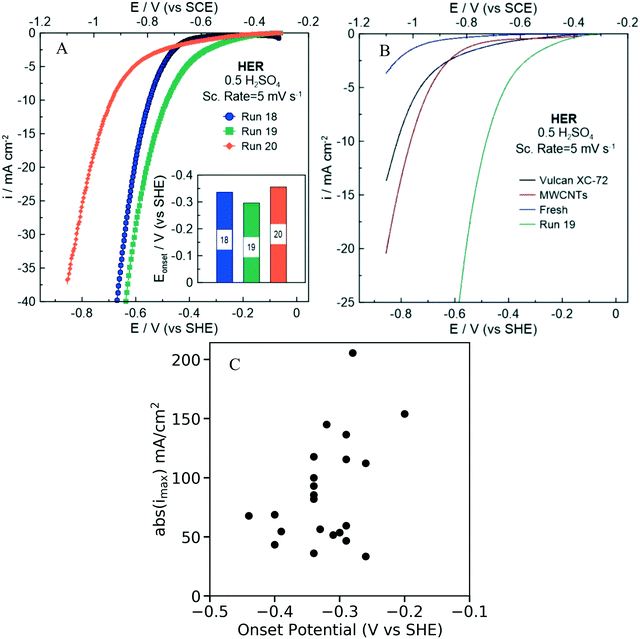
The electrochemical HER activity and specifically the onset potential (V vs. SHE) and the maximum current density (mA cm−2) were evaluated for each of the 22 NDC catalysts (labeled as NDCx, x = 1,…,22) synthesized in He-saturated 0.5 M H2SO4 electrolyte. Since both variables are negative, we choose the onset potential and the absolute value of the maximum current density as the performance metrics, since a desired NDC catalyst should have higher values in both metrics (an onset potential as close to zero as possible and as high current density as possible). As displayed in.Fig. 8A and S8,† each synthesized catalyst exhibits different electrochemical performance, manifested with a different onset potential and maximum current density (Table S2†).
In order to evaluate the HER activity of the synthesized NDC catalyst, we compared the onset potentials (evaluated at a current density of 1 mA cm−2) of each catalyst. Fig. 8B shows the polarization curves obtained for the NDC19, fresh carbon (undoped) precursor (Ketjenblack® EC-330J), Vulcan XC-72, and multiwall carbon nanotubes (MWCNTs). The HER performance is significantly improved after the doping of the fresh carbon with nitrogen. Interestingly, the onset overpotentials (η = Eo–Ep) of the NDC samples are relatively low and comparable to values reported in literature (Table S3†). The results suggest that nitrogen doping could provide HER active sites facilitating charge transfer through the catalyst. Electron supply for the hydrogen evolution current has been shown to depend linearly on the current density,66 necessitating high current density for faster reaction rates.
Fig. 8C shows the onset potential of the 22 NDCs plotted against the maximum current density (absolute value) indicate some correlation between the two metrics. Importantly, one could have high onset potential and high current density (absolute values) at once, i.e., there is not a Pareto line. The Pearson coefficient, which is a measure for linear correlation, is determined to be −0.4, indicating a weak linear correlation. This trend is also consistent at lower onset potentials (Fig. S9†). It is important to note that comparing the onset potential and the maximum current density has some limitations related with the insufficient transfer of the produced H2 on the electrode surface to the bulk electrolyte.67
Eqn 2 and 3 relate the catalyst structural features to the onset potential (V) and maximum current density (absolute values) (mA cm−2), respectively. The N species content (NPyridinic, NPyrrolic, NGraphitic) is expressed as the fraction of the total N content. The BET surface area, micropore volume, and crystallinity are in units of m2 g−1, cm3 g−1, and percentage. Note that the coefficients are for the original (unscaled) values. The standardized coefficients are represented in Fig. 9.
| Onset potential = 0.486 + 0.0438 NPyridinic − 0.102 NPyrrolic − 0.141 NGraphitic − 1.03 × 10⁻³ BET surface area + 1.36 Micropore volume − 1.80 × 10⁻³ Crystallinity | (2) |
| abs(imax) = −119 + 87.6 NPyridinic − 98.0 NPyrrolic − 192 NGraphitic − 0.103 BET surface area − 56.8 Micropore volume + 5.50 Crystallinity | (3) |
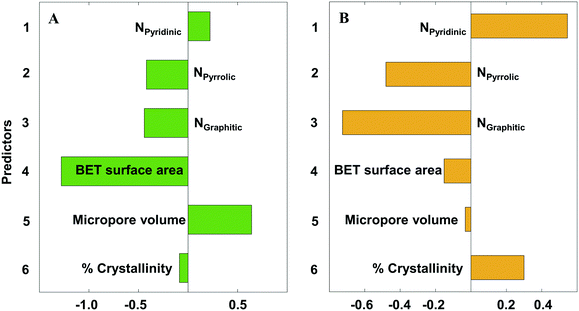 | ||
| Fig. 9 Partial least squares (PLS) standardized coefficient plot for A) the onset potential (V vs. SHE) and B) the maximum current density (absolute value) (mA cm−2). | ||
The MAE for onset potential and maximum current density are 0.03 V and 26.74 mA cm−2, respectively. These errors correspond to 14% and 16% of the observed range for the two variables in our dataset. One should note that these relations are linear and adequate for our system, but nonlinear models could also be considered to potentially improve the prediction accuracy.
From Fig. 9, we clearly observe the multivariate contributions of various features on the observed electrochemical performance. Contrary to prior research attributing electrochemical performance to one or the other N species, all N species21,68,69 affect the electrochemical performance, a fact that may explain the conflicting reports in the literature. However, their effect is not the same: pyrrolic54 and graphitic17,53,54 Ns cooperate, whereas pyridinic20,53 is antagonistic to the other two. In particular, the graphitic N has the strongest influence amongst the three N species, especially for the current density. The other catalyst properties (micropore volume, surface area and crystallinity) also influence the electrochemical performance; crystallinity is more important for the current density and surface area is the most important materials descriptor for the onset potential.
Towards increasing the onset potential, PLS analysis indicates that increasing both pyridinic N and micropore volume (Fig. 9A) will provide the desired output. Likewise, reducing the graphitic N, pyrrolic N, as well as surface area will also increase the onset potential. The pore related properties (surface area and micropore volume) have the strongest influence on the onset potential, with the N species contributing to a lesser effect. We believe that the microporous structure provides interconnected paths and short diffusion channels enabling the absorption of H+ and desorption of H2, facilitating the mass and charge transfer.
Conversely, the N species have the strongest influence on the current density, with the pore related properties having a weaker effect. Current density is a kinetic property, explaining its dependence on the distribution and concentration of HER active sites (N species) for charge transfer through the catalyst (Fig. 9B). To increase the maximum current density, increasing both pyridinic N and % crystallinity (Fig. 9B) will meet the desired target. Unfortunately, the pyridinic and graphitic Ns are almost colinear (Fig. 7B), which implies that one cannot increase pyridinic N without also increasing the graphitic N. In contract, one could decrease pyrrolic N without affecting the other types of N. Catalyst crystallinity introduced by d-band disorder facilitates shuttling of electron carriers between crystallites in the material, reducing electrical resistivity,56 and consequently increases the maximum current density (absolute value) of NDC catalysts. Similarly, reducing the graphitic N and pyrrolic N also increases the maximum current density.
We further performed kriging-based active learning to optimize the HER performance using surrogate models without performing additional experiments. In the first step, we related the 6 structural features to synthesis conditions using multivariate OLS regression (eqn (S1)–(S6), parity plots shown in Fig. S10B–G†). Next, direct relations between synthesis conditions and HER performance were constructed by substituting eqn (S1)–(S6)† into eqn (2) and (3). The resulting relations were used as surrogate models to optimize HER performance and locate optimal synthesis conditions. Due to their complexity, we do not display the functional forms of these two models. The two models have reasonable MAEs of 0.03 (V vs. SHE) and 26.74 (mA cm−2) for the onset potential and maximum current density, respectively (parity plots shown in Fig. S9†).
To enhance the performance, the onset potential and the maximum current density (absolute value) need to be maximized. We performed an initial sampling of 15 points from a latin hypercube design and 75 active learning iterations with a single point added per iteration. The algorithm converged quickly to the optimum within the first 20 iterations (see Fig. S10† for the learning curves). The optimization (Fig. 10) can be accomplished separately for the onset potential (scenario i), maximum current (scenario ii), or simultaneously (scenario iii; multi-objective optimization) by assigning equal weights of 0.5 to both normalized performance variables and optimizing the sum (a scaled performance metric). Scenario iv, as a comparison, represents the synthesis conditions that gave the optimum N content in Fig. 5. We show the optimal synthesis conditions with the corresponding structural features, as well as the performance in Table S4† for the 4 scenarios. The optimal HER performance for scenarios i–iii are close in value (Table S4C†), suggesting again that a Pareto front behavior does not apply to this system. Interestingly, by co-optimizing both performance metrics (scenario iii), the algorithm directs the optimum between those of scenario i and ii, compromising both performances. Fig. 10 indicates that scenarios i–iii (optimizing all structural features) gives better HER performance in comparison to scenario iv, where only the N content was optimized, indicating that the HER performance is not just driven by the N species, but has contributions from other features of the NDC as proposed above. In other words, the initial consideration of N as an optimization metric turns out to be a suboptimal objective function. All scenarios suggest that low temperatures (300 °C) in synthesis and catalysts with high crystallinity give best HER performances, with implications on energy savings. We validated the predictions by synthesizing a catalyst using the conditions of scenario iii of the multi-objective optimization (Table S4A†). The NDC shows better electrochemical performance compared to the original 22 catalysts with an onset potential of −0.1 V (vs. SHE) and a maximum current density of 227 mA cm−2 (the comparison with the original optimum (NDC19) is shown in Fig. S11†). The predicted optimal absolute maximum current density value (133.6 mA cm−2) is considerably lower than the experimental value (227 mA cm−2) for the validation point. The predicted lower performance is attributed to the error in the surrogate models. In addition, poor sampling near the optimum in the experimental set could contribute to this. Irrespective of the specific values, the general trends still hold. In order to improve the model accuracy, additional experiments, with recommended synthesis conditions from kriging, using performance optimization as the goal, are recommended.
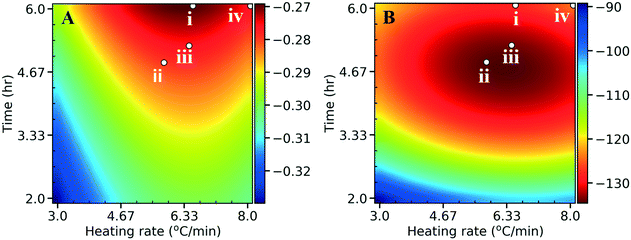 | ||
| Fig. 10 Heat maps for A) the onset potential (V vs. SHE) and B) the maximum current density (absolute values) (mA cm−2) as a function of the heating rate and hold time. Fig. 5 and Table S4† both indicate 300 °C as the best temperature for optimal HER performance, and hence we choose to graph the heating rate and hold time at a fixed final temperature of 300 °C. The red colors indicate desired performance, whereas the blue colors indicate poor performance. The points indicate optimization of the onset potential (scenario i), maximum current (scenario ii), both (scenario iii; multi-objective optimization with equal weights of 0.5), or total N (scenario iv) which was the initial target. | ||
Summarizing these findings, the results expose the multidimensional and complex nature of such systems contrary to simplistic perceptions attributing performance to one single feature (e.g., the graphitic or the pyridinic N) and neglecting important contributions from other catalyst features. The observed electrochemical performance is effected not by a single feature (pyridinic or graphitic N) but by a combined contribution of various nitrogen species, pore structure and disorder of the NDC catalyst. Additional synthesis parameters, e.g., using templating agents, alternative nitrogen precursors, and vapor deposition synthesis methods provide additional handles toward breaking causal relations between key features and allowing the tailoring of catalyst properties through controlled synthesis.
6. Conclusions
We introduce a quantitative synthesis–structure–property relations (QS2PR) framework, by combining active learning-based experimental design and machine learning analysis towards understanding active sites and improving catalyst performance. We apply the framework to the synthesis of nitrogen-doped carbon catalysts for the hydrogen evolution reaction (HER). The synthesis space consists of three tunable synthesis parameters: final temperature, the heating rate during pyrolysis, and the hold time at the maximum pyrolysis temperature. Using XRD, XPS, and BET characterization techniques, we determine 6 structure features of the catalysts: percent crystallinity, fraction of three types of nitrogen species (pyridinic N, pyrrolic N, and graphitic N), BET surface area, and micropore volume. The performance metrics for the catalysts are the onset potential and the maximum current density (absolute value), both of which need to be maximized for electrochemical performance. We relate the performance to structure features and these to synthesis conditions by constructing surrogate models via machine learning. In general, all N species as well as the porosity and defects affect the electrochemical performance, with the graphitic N having the strongest influence amongst the three active N sites. We identify active catalyst sites; specifically, the pyridinic N increases the current density, whereas pyrrolic and graphitic Ns reduce the current density. We discover that the pyridinic and graphitic Ns are colinear, i.e., one cannot increase one without increasing also the other. Fundamental studies are worth pursuing to understand the reasons. Kriging-based active learning locates the optimal synthesis conditions with less experimental time and materials. We do not observe a Pareto front, hence both onset potential and maximum current density (absolute values) can be co-optimized (the optima are not identical but are close enough). The co-optimization results suggest that low synthesis temperature and NDC catalysts with high crystallinity are important towards maximizing HER performance by having relatively higher heating rates and longer final hold times. This work highlights the inherent multidimensionality of the catalyst synthesis design space and the need for data-driven analysis to unravel correlations and causalities in multivariate systems and potentially identify the active sites.Conflicts of interest
There are no conflicts to declare.Acknowledgements
This work was supported as part of the Catalysis Center for Energy Innovation, an Energy Frontier Research Center funded by the U.S. Department of Energy, Office of Science, and Office of Basic Energy Sciences under award number DE-SC0001004. E. E. also acknowledges support from the Delaware Environmental Institute Fellows Program from the University of Delaware. We also thank Yushan Yan for providing access to his laboratory for the electro-chemical testing experiments.References
- W. Wu, C. Zhang, W. Lin, Q. Chen, X. Guo, Y. Qian and L. Zhang, PLoS One, 2015, 10, 1–16 Search PubMed.
- U. Safder, K. J. Nam, D. Kim, M. Shahlaei and C. K. Yoo, Ecotoxicol. Environ. Saf., 2018, 162, 17–28 CrossRef CAS.
- J. C. Dearden, M. T. D. Cronin and K. L. E. Kaiser, SAR QSAR Environ. Res., 2009, 20, 241–266 CrossRef CAS.
- P. Thanikaivelan, V. Subramanian, J. Raghava Rao and B. Unni Nair, Chem. Phys. Lett., 2000, 323, 59–70 CrossRef CAS.
- F. Aage, J. Russell and P. John, AIChE J., 1975, 21, 1086–1099 CrossRef.
- Z. Lei, C. Dai, X. Liu, L. Xiao and B. Chen, Ind. Eng. Chem. Res., 2012, 51, 12135–12144 CrossRef CAS.
- J. Gmehling, J. Li and M. Schiller, Ind. Eng. Chem. Res., 1993, 32, 178–193 CrossRef CAS.
- I. Kikic, M. Fermeglia and P. Rasmussen, Chem. Eng. Sci., 1991, 46, 2775–2780 CrossRef CAS.
- S. T. Lin, J. Chang, S. Wang, W. A. Goddard and S. I. Sandler, J. Phys. Chem. A, 2004, 108, 7429–7439 CrossRef CAS.
- G. H. Gu and D. G. Vlachos, J. Phys. Chem. C, 2016, 120, 19234–19241 CrossRef CAS.
- M. Salciccioli, Y. Chen and D. G. Vlachos, J. Phys. Chem. C, 2010, 114, 20155–20166 CrossRef CAS.
- L. M. Rios and N. V. Sahinidis, in Journal of Global Optimization, Springer, 2013, vol. 56, pp. 1247–1293 Search PubMed.
- N. V. Sahinidis, Comput. Chem. Eng., 2004, 28, 971–983 CrossRef CAS.
- M. Scardamaglia and C. Bittencourt, Beilstein J. Nanotechnol., 2018, 9, 2015–2031 CrossRef CAS.
- Y. Ito, W. Cong, T. Fujita, Z. Tang and M. Chen, Angew. Chem., Int. Ed., 2015, 54, 2131–2136 CrossRef CAS.
- Y. Zhao, F. Zhao, X. Wang, C. Xu, Z. Zhang, G. Shi and L. Qu, Angew. Chem., Int. Ed., 2014, 53, 13934–13939 CrossRef CAS.
- H. Jiang, J. Gu, X. Zheng, M. Liu, X. Qiu, L. Wang, W. Li, Z. Chen, X. Ji and J. Li, Energy Environ. Sci., 2019, 12, 322–333 RSC.
- T. Sun, S. Zhao, W. Chen, D. Zhai, J. Dong, Y. Wang, S. Zhang, A. Han, L. Gu, R. Yu, X. Wen, H. Ren, L. Xu, C. Chen, Q. Peng, D. Wang, Y. Li, S. Zhao and S. Zhang, Proc. Natl. Acad. Sci. U. S. A., 2018, 115, 12692–12697 CrossRef CAS.
- S. A. Giles, Y. Yan and D. G. Vlachos, ACS Catal., 2019, 9, 1129–1139 CrossRef CAS.
- Q. Lv, W. Si, J. He, L. Sun, C. Zhang, N. Wang, Z. Yang, X. Li, X. Wang, W. Deng, Y. Long, C. Huang and Y. Li, Nat. Commun., 2018, 9, 1–11 CrossRef.
- H. Wang, T. Maiyalagan and X. Wang, ACS Catal., 2012, 2, 781–794 CrossRef CAS.
- J. Shui, M. Wang, F. Du and L. Dai, Sci. Adv., 2015, 1, 1–7 Search PubMed.
- Z. Wu, M. Song, J. Wang and X. Liu, Catalysts, 2018, 8, 1–17 Search PubMed.
- B. A. Ogunnaike, Random phenomena : fundamentals of probability and statistics for engineers, CRC Press, Boca Raton, 2010 Search PubMed.
- G. E. P. Box and N. R. Draper, Empirical model-building and response surfaces, Wiley, 1987 Search PubMed.
- H. Jiang, Y. Liu, W. Li and J. Li, Small, 2018, 14, 1–10 Search PubMed.
- R. Vijay and J. Lauterbach, Stud. Surf. Sci. Catal., 2007, 171, 325–359 CrossRef CAS.
- A. Seubsai, P. Phon-In, T. Chukeaw, C. Uppala, P. Prapainainar, M. Chareonpanich, B. Zohour, D. Noon and S. Senkan, Ind. Eng. Chem. Res., 2017, 56, 100–110 CrossRef CAS.
- L. M. Baumgartner, C. W. Coley, B. J. Reizman, K. W. Gao and K. F. Jensen, React. Chem. Eng., 2018, 3, 301–311 RSC.
- B. Settles, Active Learning Literature Survey, 2010 Search PubMed.
- X. Lei and A. J. Medford, Phys. Rev. Mater., 2019, 3, 63801 CrossRef CAS.
- J. P. C. Kleijnen, Eur. J. Oper. Res., 2009, 192, 707–716 CrossRef.
- J. P. C. Kleijnen, Eur. J. Oper. Res., 2017, 256, 1–16 CrossRef.
- F. Milella and M. Mazzotti, React. Chem. Eng., 2019, 4, 1284–1302 RSC.
- B. Shahriari, K. Swersky, Z. Wang, R. P. Adams and N. De Freitas, Proc. IEEE, 2016, 104, 148–175 Search PubMed.
- E. Brochu, V. M. Cora and N. de Freitas, A tutorial on Bayesian optimization of expensive cost functions, with application to active user modeling and hierarchical reinforcement learning, 2010, pre-print, arXiv:1012.2599 Search PubMed.
- T. W. Simpson, T. M. Mauery, J. Korte and F. Mistree, AIAA J., 2001, 39, 2233–2241 CrossRef.
- J. T. Hwang and J. R. R. A. Martins, Aerosp. Sci. Technol., 2018, 75, 74–87 CrossRef.
- F. Boukouvala, F. J. Muzzio and M. G. Ierapetritou, Ind. Eng. Chem. Res., 2011, 50, 6743–6754 CrossRef CAS.
- T. Ueno, T. D. Rhone, Z. Hou, T. Mizoguchi and K. Tsuda, Mater. Discov., 2016, 4, 18–21 CrossRef.
- Z. W. Ulissi, A. R. Singh, C. Tsai and J. K. Nørskov, J. Phys. Chem. Lett., 2016, 7, 3931–3935 CrossRef CAS.
- R. Blume, D. Rosenthal, J.-P. Tessonnier, H. Li, A. Knop-Gericke and R. Schlögl, ChemCatChem, 2015, 18, 2871–2881 CrossRef.
- R. Schlögl, D. S. Su, M. Lerch, J. A. Zeitler, E. P. J. Parrott, M. Hävecker, A. Knop-Gericke, R. Arrigo, S. Wrabetz, L. F. Gladden, J. McGregor and R. Blume, J. Am. Chem. Soc., 2010, 132, 9616–9630 CrossRef.
- Y. Hu, N. Goodeal, Y. Chen, A. M. Ganose, R. G. Palgrave, H. Bronstein and M. O. Blunt, Chem. Commun., 2016, 52, 9941–9944 RSC.
- Y. Zheng, Y. Jiao, L. H. Li, T. Xing, Y. Chen, M. Jaroniec and S. Z. Qiao, ACS Nano, 2014, 8, 5290–5296 CrossRef CAS.
- PyKriging, 2018 Search PubMed.
- D. R. Jones, M. Schonlau and W. J. Welch, J. Glob. Optim., 1998, 13, 455–492 CrossRef.
- D. R. Jones, J. Glob. Optim., 2001, 21, 345–383 CrossRef.
- A. I. J. Forrester, A. Sbester and A. J. Keane, Engineering Design via Surrogate Modelling, John Wiley & Sons, Ltd, Chichester, UK, 2008 Search PubMed.
- Minitab, Example of Principal Components Analysis Search PubMed.
- Y. Zheng, Y. Jiao, Y. Zhu, L. H. Li, Y. Han, Y. Chen, A. Du, M. Jaroniec and S. Z. Qiao, Nat. Commun., 2014, 5, 1–8 Search PubMed.
- H. Liu, Y. Zhang, R. Li, X. Sun, S. Désilets, H. Abou-Rachid, M. Jaidann and L. S. Lussier, Carbon, 2010, 48, 1498–1507 CrossRef CAS.
- L. Lai, J. R. Potts, D. Zhan, L. Wang, C. K. Poh, C. Tang, H. Gong, Z. Shen, J. Lin and R. S. Ruoff, Energy Environ. Sci., 2012, 5, 7936–7942 RSC.
- X. Liu, L. Li, W. Zhou, Y. Hou, W. Niu and S. Chen, ChemElectroChem, 2015, 2, 803–810 CrossRef CAS.
- L. Hlekelele, P. J. Franklyn, P. K. Tripathi and S. H. Durbach, RSC Adv., 2016, 6, 76773–76779 RSC.
- M. A. Pimenta, G. Dresselhaus, M. S. Dresselhaus, L. G. Cançado, A. Jorio and R. Saito, Phys. Chem. Chem. Phys., 2007, 9, 1276–1291 RSC.
- L. Liu, S. Tan, T. Horikawa, D. D. Do, D. Nicholson and J. Liu, Adv. Colloid Interface Sci., 2017, 250, 64–78 CrossRef CAS.
- C. E. Rasmussen, in Developments in Psychoanalysis, ed. J. Riviere and E. Jones, Routledge, 2004, pp. 63–71 Search PubMed.
- P. I. Frazier, A Tutorial on Bayesian Optimization, 2018, pp. 1–22 Search PubMed.
- C. L. Hanselman, W. Zhong, K. Tran, Z. W. Ulissi and C. E. Gounaris, J. Phys. Chem. C, 2019, 123, 29209–29218 CrossRef CAS.
- J. Lever, M. Krzywinski and N. Altman, Nat. Methods, 2017, 14, 641–642 CrossRef CAS.
- A. J. Medford, M. R. Kunz, S. M. Ewing, T. Borders and R. Fushimi, ACS Catal., 2018, 8, 7403–7429 CrossRef CAS.
- H. Qu, X. Zhang, J. Zhan, W. Sun, Z. Si and H. Chen, ACS Sustainable Chem. Eng., 2018, 6, 7380–7389 CrossRef CAS.
- Z. Ma, H. Zhang, Z. Yang, G. Ji, B. Yu, X. Liu and Z. Liu, Green Chem., 2016, 18, 1976–1982 RSC.
- X. Li, B. Y. Guan, S. Gao and X. W. Lou, Energy Environ. Sci., 2018, 648–655 CAS.
- T. Shinagawa, A. T. Garcia-Esparza and K. Takanabe, Sci. Rep., 2015, 5, 1–21 Search PubMed.
- J. Zheng, Y. Yan and B. Xu, J. Electrochem. Soc., 2015, 162, 1470–1481 CrossRef.
- M. Wassner, M. Eckardt, A. Reyer, T. Diemant, M. S. Elsaesser, R. J. Behm and N. Hüsing, Beilstein J. Nanotechnol., 2020, 11, 1–15 CrossRef CAS.
- K. Qu, Y. Zheng, X. Zhang, K. Davey, S. Dai and S. Zhang Qiao, ACS Nano, 2017, 11, 7293–7300 CrossRef CAS.
Footnotes |
| † Electronic supplementary information (ESI) available. See DOI: 10.1039/d0re00243g |
| ‡ E. E. and Y. W. contributed equally to this work. |
| This journal is © The Royal Society of Chemistry 2020 |

