 Open Access Article
Creative Commons Attribution 3.0 Unported Licence
3D-printed PEEK reactors and development of a complete continuous flow system for chemical synthesis†
Florian
Menzel
 ,
Thomas
Klein
 ,
Thomas
Ziegler
 and
Jochen M.
Neumaier
 *
*
Institute of Organic Chemistry, University of Tübingen, Auf der Morgenstelle 18, 72076 Tübingen, Germany. E-mail: jochen.neumaier@uni-tuebingen.de
First published on 5th June 2020
Abstract
The possibility of 3D printing high temperature and chemically resistant polymers creates opportunities for applications in flow chemistry. Herein we describe the development of milli- and microfluidic reactors made of polyether ether ketone (PEEK) with a high temperature 3D printer and examine their mixing performance and suitability for flow reactions at elevated temperatures. Additionally, we present a 3D-printed separator, back pressure regulator and continuous syringe pump, which provide a complete flow system for a fraction of the cost of commercially available flow equipment. Different 3D printed mixing geometries were tested and the influence of mixing on fluorination of a ribose derivative was evaluated. To demonstrate the usability of our self-made flow equipment we performed a multistep reaction of a ribose derivative in excellent yield which could be used as a precursor for the synthesis of nucleoside anti-cancer drugs.
Introduction
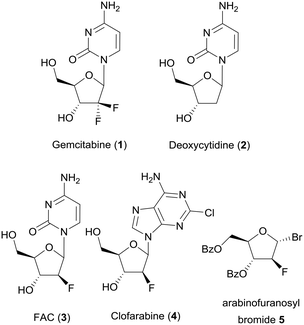
Over the last two decades flow chemistry attracted considerable attention in academic research.1–4 The chemical industry takes full advantage of reactions in flow like an easier scale up of a production process due to better mixing and heat transfer.5 Another benefit of performing reactions in flow lies in better control over reaction parameters, which is especially important when working with hazardous chemicals and unstable intermediates.6 In the pharmaceutical industry flow chemistry also has become an important technology for the manufacture of active pharmaceutical ingredients (APIs).7 One example of an API is gemcitabine (1), which is used for treatment of pancreatic cancer. It is a deoxycytidine (2) derivative and can be phosphorylated by deoxycytidine kinase (dCK) and inhibits the dCTP synthesis.8 A derivative of gemcitabine, 1-(2′-deoxy-2′-fluoroarabinofuranosyl)cytosine (FAC, 3), is also a substrate for dCK and could be used for detection of dCK activity by using positron emission tomography (PET), if it is labeled with 18F.9 Particularly for the synthesis of radioactive PET tracers, the use of microreactors could increase yields, purity and reaction time, leading to higher specific activity.10 Another nucleoside analogue is clofarabine (4),11 which is used as an anticancer drug for the treatment of acute lymphoblastic leukemia. One possible precursor for the synthesis of clofarabine is 2-deoxy-2-fluoro-3,5-di-O-benzoyl-α-D-arabinofuranosyl bromide (5) (Chart 1).12,13 In this work we performed a multistep flow reaction for the synthesis of this precursor 5 in excellent yield using 3D-printed PEEK flow reactors (Scheme 1). The use of 3D printers for manufacturing microreactors is a great opportunity for fast and easy prototyping and had a great impact on flow chemistry in the last few years.14–22 There are several technologies for 3D printing of flow reactors which all have advantages and disadvantages.23,24 Although technologies like selective laser sintering (SLS) or stereolithography (SLA) achieve very good resolution, our focus lies on the technology of fused deposition molding (FDM) because of the wide range of chemically resistant printing materials. We chose polypropylene (PP) which could be printed on a low-cost desktop 3D printer and polyether ether ketone (PEEK) which needs a special high temperature 3D printer.Although PP can't withstand high temperatures, chlorinated solvents or hydrocarbons for an extended period of time,25 the benefits are e.g. the transparency and the good printability of this material. In contrast, PEEK shows an excellent chemical resistance to a wide range of chemicals and withstands temperatures up to 250 °C,26,27 which makes it an excellent material for flow reactors for organic synthesis.
Most common equipment for multistep flow reactions consists of pumps, reactors, pressure regulators and liquid–liquid extraction systems.28 The regulation of the system pressure is very important in flow chemistry.29 An increased system pressure could be obtained using a back pressure regulator (BPR). Operating under an increased inner pressure, solvents can be heated above their boiling points which could lead to faster kinetics.30 Also, if volatiles or gases are formed during the reaction, it can prevent outgassing and reduces possible inhomogeneity of the flow rate.
For multistep synthesis, liquid–liquid extraction steps followed by phase separation are common processes.28 Membrane-based separation techniques are widely used in analytical31,32 and synthetic chemistry33–35 and are excellent tools for true continuous liquid–liquid separation. The basic idea behind a membrane separator is that the mixture of organic and aqueous phases is separated using a hydrophobic, porous membrane.
Commercially available continuous flow systems are rather expensive which is why we decided to develop a completely 3D-printed flow system with all the components mentioned above.
In our previous publication we focused on constructing inexpensive flow equipment without the need to buy costly, commercially available flow reactors or syringe pumps.36
In this work we first printed various mixing geometries with PP and performed Villermaux–Dushman (VD) experiments to evaluate their printability and mixing efficiency. Further, we printed flow reactors and crucial flow equipment from PEEK which opens up new possibilities for flow chemistry. The aim of this paper is to show that 3D printed PEEK flow equipment meets the same requirements for multistep synthesis as a commercial flow setup with additional advantages of being cheaper, more customizable and almost instantly available.
Experimental
Fabrication of 3D printed parts
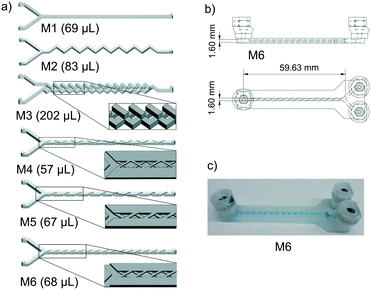 | ||
| Fig. 1 Flow path of mixers M1 to M6 with detailed mixing geometries (a); CAD drawing (b) and picture (c) of M6. | ||
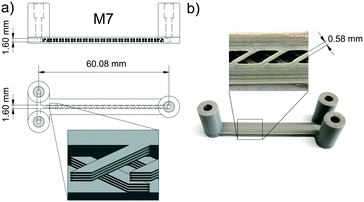
When printing with PEEK, one problem is polymer spreading during extrusion, resulting in a channel width which is always smaller than the theoretical channel width in the CAD drawing.23 Thus, channels containing the crossed barriers could only be scaled down to a nominal channel width of 1.6 mm. Additionally, every second layer of the mixing geometry had to be removed in the CAD model to reduce the material flow (see Fig. 3a). A picture of M7 and an open cutout is shown in Fig. 3b. The measured volume of M7 shows that it's reduced by 33% in comparison to the CAD drawing.
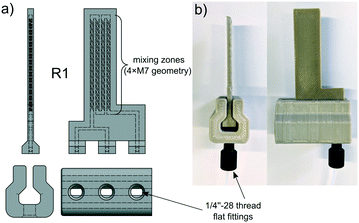
One critical component of every flow chemistry device is the connection to the tubes. In the beginning, we used an exact replica of a 10-32 female HPLC fitting as a connection to the PEEK reactors. Because of the printer's inaccuracy, we just designed a step at the bottom and cut the cone afterwards with a center drill. This method did not reliably result in leakproof reactors and it limits the tube size to 1/16′′. Therefore, we switched to a system with a guide rail printed from PEEK where the reactor is slit in. Here the flangeless flat bottom 1/4′′-28 fitting is just pressed against the flat honed surface of the reactor (Fig. 2). Not only is this system leakproof but it also allows the use of 1/8′′ tubing.
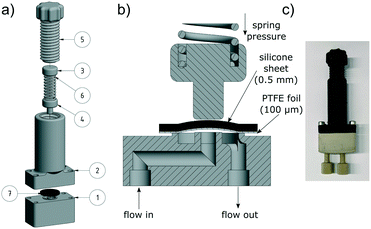
The top parts (No. 2–6) are printed with polylactic acid (PLA), since they have no contact to the solvent. The solvent conducting part (No. 1) was made from PEEK and the upper, PTFE touching side was sanded with 1000 grit abrasive paper to ensure a smooth surface.
Previous versions of the back pressure regulator and the membrane separator were made out of PP. Although these devices worked very well in most situations, the softness of the PP forced us to use custom aluminium plates on top of the screw fittings to distribute the contact pressure evenly. The upgrade to PEEK as a printing material makes reinforcing plates redundant and eliminates the risk of malfunctions because of swelling, for instance. Even if it's entirely possible to make the presented laboratory equipment with a low-cost printer and polypropylene, PEEK devices are more reliable, especially under harsher reaction conditions.
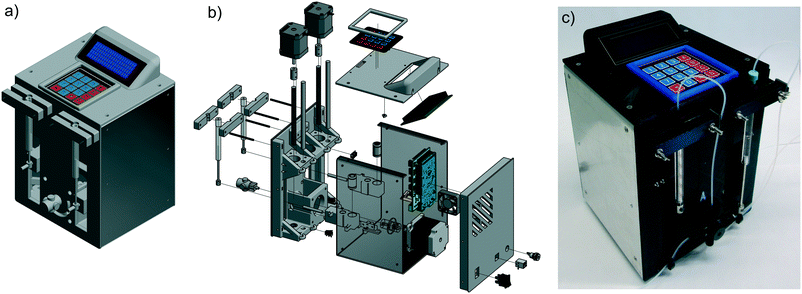
Principally this pump works like a dual piston pump. While the first syringe pumps the solution into the reactor, the second syringe draws the solution from a reservoir. To realize this, we chose a four-way valve with diagonal flow from UPCHURCH SCIENTIFIC. After manufacturing, the pump has been tested for its accuracy and calibrated to ensure a deviation of around 1%. The minimum reasonable flow rate is 1.0 μL min−1 and the maximum is 3000 μL min−1, which should be sufficient for most continuous flow applications. At lower flow rates, the slow movement of the stepper motor could result in pulsation of the flow. At higher flow rates, the motors could reach their maximum power level and skip steps, which would lead to an inappropriate flow rate.
Mixing tests
For the Villermaux–Dushman (VD) experiments we used water (HiPerSolv CHROMANORM® for HPLC) from VWR. The acid and buffer solutions were freshly prepared before use with set concentrations, shown in Table 1. The chemicals for these solutions were used without further purification and obtained from AppliChem, Honeywell, Merck and Sigma-Aldrich. As syringe pumps we used previously described self-made Arduino driven pumps36 with two 60 mL polyethylene syringes. For measuring the absorbance, we made a flow cell from two QS quartz panes sandwiched in a holder (path length d = 0.53 cm) printed out of PLA. The absorbance of I3− was measured on a Lambda 25 UV-vis spectrometer from Perkin Elmer at different flow rates from 5 ml min−1 per syringe to 0.25 mL min−1. After each change of the flow rate we waited until a constant absorption value was reached and afterwards we performed three one minute runs with 20 single measurements at 353 nm (ε353 of triiodide = 26![[thin space (1/6-em)]](https://www.rsc.org/images/entities/char_2009.gif) 400 L mol−1 cm−1).38
400 L mol−1 cm−1).38
| Solution | Reagent | Concentration [mol L−1] |
|---|---|---|
| Buffer solution | H3BO3 | 0.030 |
| NaOH | 0.030 | |
| KI | 0.011 | |
| KIO3 | 0.002 | |
| Acid solution | H2SO4 (97%) | 0.010 |
Chemical reactions
As references for HPLC measurements, 2-deoxy-2-fluoro-1,3,5-tri-O-benzoyl-α-D-arabinofuranose (8) and 2-deoxy-2-fluoro-3,5-di-O-benzoyl-α-D-arabinofuranosyl bromide (5) were produced in a conventional batch-synthesis.![[thin space (1/6-em)]](https://www.rsc.org/images/entities/char_2009.gif) :
:![[thin space (1/6-em)]](https://www.rsc.org/images/entities/char_2009.gif) 1) a colorless oil (0.22 g, 88%) was obtained.
1) a colorless oil (0.22 g, 88%) was obtained.
1H-NMR (400 MHz, CDCl3): δ = 8.00–8.16 (m, 6H, aryl-H), 7.52–7.69 (m, 3H, aryl-H), 7.35–7.51 (m, 6H, aryl-H), 6.77 (d, J = 9.0 Hz, 1H, 1-H), 5.65 (ddd, J = 19.5 Hz, 3.1 Hz, 0.8 Hz, 1H, 3-H), 5.29–5.52 (d, J = 50.0 Hz, 1H, 2-H), 4.78–4.85 (m, 1H, 4-H), 4.74 (m, 5-H/5-H′) ppm. 19F-NMR (376 MHz, CDCl3): δ = −190.77 ppm.
![[thin space (1/6-em)]](https://www.rsc.org/images/entities/char_2009.gif) :
:![[thin space (1/6-em)]](https://www.rsc.org/images/entities/char_2009.gif) 1) a yellowish oil (0.09 g, 93%) was obtained.
1) a yellowish oil (0.09 g, 93%) was obtained.
1H-NMR (400 MHz, CDCl3): δ = 7.98–8.23 (m, 4H, aryl-H), 7.54–7.68 (m, 2H, aryl-H), 7.39–7.52 (m, 4H, aryl-H), 6.65 (d, J = 12.1 Hz, 1H, 1-H), 5.53–5.69 (d, J = 50.0 Hz, 1H, 2-H), 5.52–5.59 (ddd, J = 20.0 Hz, 4.0 Hz, 0.8 Hz, 1H, 3-H), 4.78–4.86 (m, 1H, 4-H), 4.65–4.77 (m, 2H, 5-H/5-H′) ppm. 19F-NMR (376 MHz, CDCl3): δ = −165.92 ppm.
Flow synthesis
For flow reactions the self-built continuous syringe pump was used with additional syringe pumps LA-30 from Landgraf Laborsysteme HLL GmbH. HPLC grade CHCl3 was passed through a column filled with molecular sieves (4 Å, 1 g mL−1 CHCl3) prior to use. The chemicals for the flow reactions were used without further purification and obtained from Sigma Aldrich, Merck, TCI, and Acros Organics. NMR spectra were recorded on a Bruker “Avance 400” spectrometer and calibrated to the solvent signal (CDCl3: 1H 7.27 ppm, 13C 77.0 ppm). HPLC measurements were made on a HPLC system containing a Sykam S 1121 solvent delivering system, a Sykam S5200 sample injector and a Linear UVVIS-205 absorbance detector (254 nm). As a column a GROM-SIL 120 ODS-3 CP, 5 μm column (250 × 4 mm) was used. Diethylaminosulfur trifluoride (DAST) must be handled with caution and must not be heated above 90 °C due to its highly reactive decomposition products.Conversion calculation
All used and manufactured substances have different extinction coefficients. A direct comparison of the peak integrals in relation to the concentration is therefore not possible. To determine each concentration, the concentration series of 1,3,5-tri-O-benzoyl-α-D-ribofuranose (6), 2-deoxy-2-fluoro-1,3,5-tri-O-benzoyl-α-D-arabinofuranose (8) and 2-deoxy-2-fluoro-3,5-di-O-benzoyl-α-D-arabinofuranosyl bromide (5) were examined by HPLC measurements. By determination of the integrals a calibration line was created, with which the concentration could be calculated.Further information for manufacturing and CAD files of the 3D printed parts, reactors, pressure tests of the BPR, mixing tests, and chemical reactions can be found in the ESI.†
Results and discussion
Mixing efficiency evaluation
For reactions in flow, the efficient mixing of the reagents is one of the most important factors. Mixing techniques can be divided into two different types: active and passive mixing. While active mixing requires an external force like ultrasound or small impellers, passive mixing is based on restructuring the laminar flows to intersect each other.41 Special geometries of these channels or microstructured objects in the channels induce chaotic mixing or force the flow to split and recombine, thus creating multi-laminar flow patterns.42–45Because mixing in flow reactions is essential, many tests for mixing characterization have been developed.46 Some are based on the mixing of two dyes or the dilution of one dye.47,48 Measuring the combination color or the time one dye is fully diluted allows a qualitative estimation of the mixing efficiency because initially, the dyes can be monitored very well. However, these tests are restricted to translucent mixers. Besides that, this sort of test can be misleading because the dyes seem to be mixed but in reality, the streams just overlay and the observer sees an averaged color through the mixing channels.49,50 This shortcoming can be addressed with confocal laser microscopy in order to obtain either cross sectional or three dimensional images of the mixing channels.44,51 Another type of test requires a reaction where a dye is formed or a color change is induced.52,53 Furthermore, it's possible to quantify the mixing performance of micromixers with competitive reactions.54–56 One of these is the VD reaction which is by far the most commonly used reaction.57,58 Because this is the benchmark reaction to investigate the mixing performance, the mixers in this work were tested according to the VD protocol. This method is based on the competition between the instantaneous neutralization of dihydrogenoborate anions (1) and the fast redox reaction of iodate and iodide to form iodine (2):
| H2BO3− + H+ ⇌ H3BO3 | (1) |
| IO3− + 5I− + 6H+ ⇌ 3I2 + 3H2O | (2) |
| I2 + I− ⇌ I3− | (3) |
 | (4) |
 | (5) |
 | (6) |
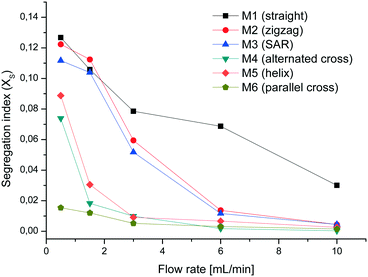
In our previous work we designed and manufactured several PP reactors and performed some glycosylation reactions.36 In this work, we tested some mixing geometries in order to improve the mixing efficiency. First, we started with one straight channel (M1) and a zigzag pattern (M2) to optimize printing quality. Next, we moved on to more complicated mixing geometries (see Fig. 1) like the “split and recombine” (SAR) mixer M3, derived from Xia et al.,61 or mixers M4, M5 and M6 containing crossed barriers, inspired by the work of Yoo et al.62 The authors designed mixers with alternating crosses which we scaled up to match our channel size (M4). Additionally, we modified the barrier geometry to a barely overlapping, helical geometry (M5) and parallel crosses (M6) in which the bars of a level in the mixer are arranged in parallel. All the mixers have a mixing zone of about 60 mm.
The VD experiments show that at low flow rates M1 and M2 are almost equal in mixing efficiency but with increasing flow rate the zigzag geometry has a better mixing performance. Surprisingly M3 performs relatively poorly in comparison to M4, M5 and M6. We noticed in some experiments with a dye solution that not all parts of M3 are filled. One possible reason for this behavior could be inaccuracies in the production process leaving split channels with an uneven width. Particularly at low flow rates, the fluid is not split and follows the easiest path which is essentially a smaller version of zigzag mixer M2. The mixers M4 to M6 exhibit a much better mixing performance than M1 to M3, particularly at flow rates of 1.5 and 3 mL min−1 (see Fig. 7). At a combined flow rate of 0.5 mL min−1 (0.25 mL min−1 per syringe) the VD experiments show a much higher mixing efficiency for M6 than for M4 and M5.
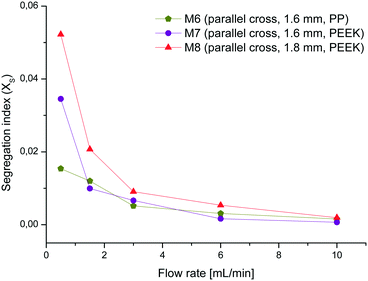
The best mixer M6 of this set was also printed with the same mixer geometry in PEEK (M7) to evaluate if there is any difference in the performance from the one made of PP. Additionally, the channel width was widened to 1.8 mm (M8) in order to see if this causes a difference in the mixing performance. As expected, M8 shows similar curve characteristics but slightly higher XS-values than M7 due to the lower energy dissipation rate in wider channels (see Fig. 8).60 Comparing the almost identical mixers M6 and M7 there are no major differences except at a flow rate of 0.5 mL min−1. This variance could again be attributed to uneven or blocked channel sections, which impinge on the mixing efficiency at low flow rates. These tests demonstrate that the mixing efficiency of the mixer with parallel crosses and a channel width of 1.6 mm is superior to the others and therefore this geometry was chosen for the chemical reactions.
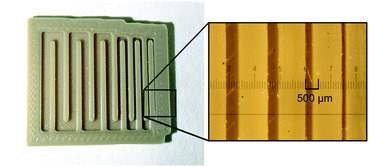
Channel width tests
With the standard printing parameters, we also tested how narrow straight channels could be printed without being blocked. We designed a test piece with various channel sizes down to 0.4 mm in width (see Fig. 9). We saw that the obtained channel width is about 0.2 mm to 0.24 mm smaller than that in the CAD drawing (see Table 2). Further, the channel with a width of 0.4 mm shows inaccurately printed areas, which could lead to blockage in a reactor.| Printed part | Channel width (channel width in CAD) [mm] | Width difference [mm] |
|---|---|---|
| Test piece (PEEK) | 1.76 (2.0) | 0.24 (13.6%) |
| 1.59 (1.8) | 0.21 (13.2%) | |
| 1.38 (1.6) | 0.22 (15.9%) | |
| 0.57 (0.8) | 0.23 (40.4%) | |
| 0.40 (0.6) | 0.20 (50.0%) | |
| 0.18 (0.4) | 0.22 (122.2%) |
Next, we printed reactors with channel cross sections of 0.8 × 0.8 mm, 0.6 × 0.6 mm and 0.4 × 0.4 mm. The reactor with the smallest dimensions was blocked which had already been indicated by the test piece. We determined the volume of the two working reactors with bigger cross sections and found that their volume is significantly smaller than that in the CAD drawing. The volumes of the reactors with lateral dimensions of 0.8 mm and 0.6 mm were just 38% and 42% of the volumes calculated with the CAD program, respectively. These tests demonstrate that it is possible to obtain 3D-printed PEEK reactors with channel dimensions below 0.5 mm, which falls in the category of microreactors.24,63
Chemical reactions
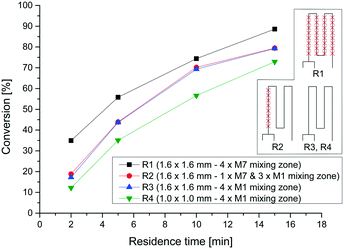
As a proof of concept for the utility of our 3D-printed continuous flow equipment, we wanted to synthesize glycosyl bromide 5 in a continuous multistep reaction (Scheme 1). The bromide 5 could be used as a precursor for the synthesis of gemcitabine analogs, like FAC (3), as mentioned in the Introduction. 18F-fluorination to fluoride [18F]-8 using our 3D-printed PEEK reactors, as well as a complete synthesis of [18F]-FAC, is currently in progress and will be published as soon as possible.First, the fluorination reaction of ribose derivative 6 with DAST (7) was investigated using four different reactors (Table 3). We used two reactors consisting of straight lines as mixing zones (M1) with different cross sections (R3 and R4). Reactor R1 contains four mixing zones (M7) (see Fig. 2), and reactor R2 contains only one mixing zone (M7). For all reactions the temperature was set to 75 °C and four different residence times were chosen. Fig. 10 shows the conversion to the desired product for all reactors and residence times. As expected, the conversion with just straight channels is lower compared to that of reactor R1 with four mixing zones. We found that for this particular reaction one mixing zone (R2) is not sufficient to increase the conversion compared to reactor R3. Further, the reactor with a smaller cross section (1.0 × 1.0 mm) shows a lower conversion. A lower flow rate at this regime of Reynolds number results in a decreased energy dissipation rate and thus lowers the mixing efficiency.60
| Reactor | Volume [μL] | Channel cross section | Number of mixing zones M7 |
|---|---|---|---|
| R1 | 360 | 1.6 × 1.6 mm | 4 |
| R2 | 480 | 1.6 × 1.6 mm | 1 |
| R3 | 510 | 1.6 × 1.6 mm | 0 |
| R4 | 290 | 1.0 × 1.0 mm | 0 |
The fluorination itself was optimized using four temperatures between 60 and 90 °C and four different residence times between 3 and 15 minutes. Fig. 11 shows the conversion of the reaction, determined by HPLC. At higher temperature the reaction proceeded much faster and the conversion reached 99% at 90 °C and a residence time of 15 minutes. In addition, different ratios of 6 and 7 were applied and different temperatures were used to optimize the reaction conditions (Table 4). Therefore a residence time of 15 min was set. The highest conversion of 90% could be measured with 3 equivalents of 7 at 85 °C. In comparison, several equivalents produce lower yields and are therefore not necessary. The yield at 75 °C is only slightly less than that at 85 °C. Due to the low boiling point of chloroform and the resulting high pressure, 75 °C is set as the optimal reaction temperature for the following experiments.
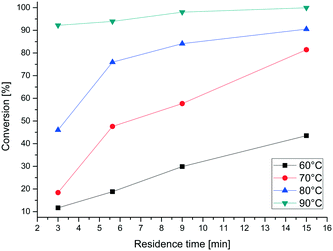 | ||
| Fig. 11 Conversion of ribose derivative 6 to 2-fluoro-arabinose derivative 8 at different temperatures. | ||
| Temperature | Residence time | Equivalents DAST | Conversion |
|---|---|---|---|
| 85 °C | 15 min | 3 | 90% |
| 85 °C | 15 min | 6 | 74% |
| 75 °C | 15 min | 3 | 89% |
| 75 °C | 15 min | 6 | 72% |
| 65 °C | 15 min | 3 | 44% |
| 65 °C | 15 min | 6 | 31% |
The bromination was first optimized at 55 °C using two different ratios of HBr (10 eq. and 25 eq.) and three different residence times of 5, 10 and 20 minutes (Table 5). The best results for the bromination of 8 to 5 were achieved between 10 and 20 min with 25 eq. HBr (>99% conversion). With these results a multistep synthesis of 5 was set up.
| Temperature | Residence time | Equivalents HBr | Conversion [%] |
|---|---|---|---|
| 55 °C | 5 min | 10 | 80% |
| 10 min | 10 | 99% | |
| 20 min | 10 | >99% | |
| 5 min | 25 | 98% | |
| 10 min | 25 | >99% | |
| 20 min | 25 | >99% |
For the multistep reaction, an individual reactor with a volume of 820 μL and three mixing channels (R5) was printed to generate higher flow rates and higher production capacity.
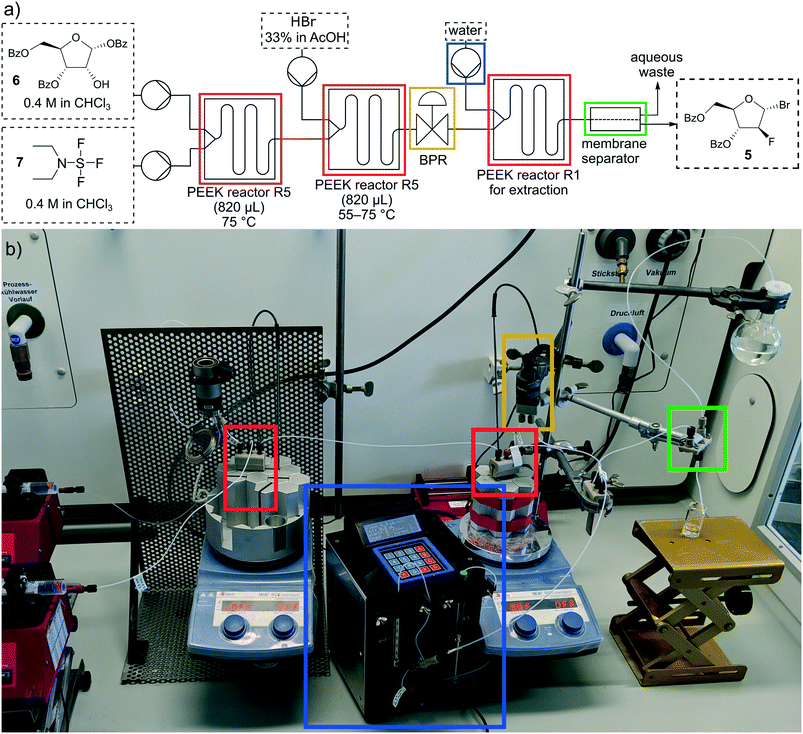
In Fig. 12 the setup of the multistep reaction is shown, consisting of four pumps, three PEEK reactors, one BPR and a membrane separator. For the extraction step our self-built syringe pump was used. In the first reactor R5 the fluorination reaction took place at 75 °C with an increased residence time of 20 min to ensure complete conversion to the fluoride 8. In the additional bromination the reaction mixture of step one and HBr (33% in AcOH) were pumped through a second PEEK reactor R5 at 55 °C and a residence time of 14 min. Since the temperature exceeded the boiling point of chloroform, the BPR was set to a pressure of 3 bar. The reaction mixture was quenched and washed with water in the third reactor R1 (residence time: 3 min) and the organic and water phases were separated through the membrane separator. The conversion was not complete at 55 °C so more optimization was necessary. Therefore, the temperature of the bromination was raised to 65 and 75 °C resulting in a conversion of >99% at 75 °C (Table 6).
| Temperature | Residence time | Equivalents HBr | Conversion to 5 [%] |
|---|---|---|---|
| 55 °C | 14 min | 25 | 93% |
| 65 °C | 14 min | 25 | 99% |
| 75 °C | 14 min | 25 | >99% |
With these conditions the multistep reaction was run continuously. A one hour sample of 2-deoxy-2-fluoro-3,5-di-O-benzoyl-α-D-arabinofuranosyl bromide (5) was collected (about 148 mg). Washing with water in the third reactor was sufficient to obtain very pure compound 5 with an isolated yield of 79%.
Conclusion
In this work, we present the development and fabrication of 3D-printed reactors and mixers out of PEEK. We tested several mixers made out of PP and PEEK with the Villermaux–Dushman reaction to evaluate their mixing efficiency. The mixer with parallel crossed barriers in the channel showed the best mixing performance with both materials. Further, the miniaturization of straight channels printed with PEEK was tested, which showed that it is possible to print microreactors with channel dimensions below 500 μm. The reactors we designed are fully customizable with CAD software and it takes only a few hours to obtain a finished flow reactor from an idea. Additionally, we presented a low-cost continuous syringe pump, back pressure regulator and membrane separator, which could be printed with either PEEK or PP. With a continuous multistep synthesis of a halogenated arabinose derivative we demonstrated the utility of our 3D-printed flow system. This facilitates the entry in flow chemistry and could be an alternative to commercially available flow equipment.Conflicts of interest
There are no conflicts to declare.Acknowledgements
We thank the Karl und Anna Buck Stiftung for funding the high temperature 3D printer.Notes and references
- A. R. Bogdan and A. W. Dombrowski, J. Med. Chem., 2019, 62, 6422–6468 CrossRef CAS PubMed.
- B. Gutmann and C. O. Kappe, J. Flow Chem., 2017, 7, 65–71 CrossRef CAS.
- R. L. Hartman and K. F. Jensen, Lab Chip, 2009, 9, 2495–2507 RSC.
- C. Wiles and P. Watts, Eur. J. Org. Chem., 2008, 1655–1671 CrossRef CAS.
- N. Kockmann, M. Gottsponer and D. M. Roberge, Chem. Eng. J., 2011, 167, 718–726 CrossRef CAS.
- M. Movsisyan, E. I. P. Delbeke, J. K. E. T. Berton, C. Battilocchio, S. V. Ley and C. V. Stevens, Chem. Soc. Rev., 2016, 45, 4892–4928 RSC.
- A. R. Bogdan and A. W. Dombrowski, J. Med. Chem., 2019, 62, 6422–6468 CrossRef CAS PubMed.
- J. Russell, N. Pillarsetty, R. M. Kramer, P. B. Romesser, P. Desai, A. Haimovitz-Friedman, M. A. Lowery and J. L. Humm, Mol. Imaging Biol., 2017, 19, 885–892 CrossRef CAS PubMed.
- R. E. Laing, M. A. Walter, D. O. Campbell, H. R. Herschman, N. Satyamurthy, M. E. Phelps, J. Czernin, O. N. Witte and C. G. Radu, Proc. Natl. Acad. Sci. U. S. A., 2009, 106, 2847 CrossRef CAS PubMed.
- P. Watts, G. Pascali and P. A. Salvadori, J. Flow Chem., 2012, 2, 37–42 CrossRef CAS.
- P. L. Bonate, L. Arthaud, W. R. Cantrell, K. Stephenson, J. A. Secrist and S. Weitman, Nat. Rev. Drug Discovery, 2006, 5, 855–863 CrossRef CAS PubMed.
- I. V. Fateev, K. V. Antonov, I. D. Konstantinova, T. I. Muravyova, F. Seela, R. S. Esipov, A. I. Miroshnikov and I. A. Mikhailopulo, Beilstein J. Org. Chem., 2014, 10, 1657–1669 CrossRef PubMed.
- W. E. Bauta, B. E. Schulmeier, B. Burke, J. F. Puente, W. R. Cantrell, D. Lovett, J. Goebel, B. Anderson, D. Ionescu and R. Guo, Org. Process Res. Dev., 2004, 8, 889–896 CrossRef CAS.
- A. Enders, I. G. Siller, K. Urmann, M. R. Hoffmann and J. Bahnemann, Small, 2019, 15, 1804326 Search PubMed.
- M. R. Penny, Z. X. Rao, B. F. Peniche and S. T. Hilton, Eur. J. Org. Chem., 2019, 2019, 3783–3787 CrossRef CAS.
- S. Rossi, A. Puglisi and M. Benaglia, ChemCatChem, 2018, 10, 1512–1525 CrossRef CAS.
- C. Parra-Cabrera, C. Achille, S. Kuhn and R. Ameloot, Chem. Soc. Rev., 2018, 47, 209–230 RSC.
- C. Chen, B. T. Mehl, A. S. Munshi, A. D. Townsend, D. M. Spence and R. S. Martin, Anal. Methods, 2016, 8, 6005–6012 RSC.
- N. Bhattacharjee, A. Urrios, S. Kang and A. Folch, Lab Chip, 2016, 16, 1720–1742 RSC.
- V. Dragone, V. Sans, M. H. Rosnes, P. J. Kitson and L. Cronin, Beilstein J. Org. Chem., 2013, 9, 951–959 CrossRef CAS PubMed.
- A. J. Capel, S. Edmondson, S. D. R. Christie, R. D. Goodridge, R. J. Bibb and M. Thurstans, Lab Chip, 2013, 13, 4583–4590 RSC.
- P. J. Kitson, M. H. Rosnes, V. Sans, V. Dragone and L. Cronin, Lab Chip, 2012, 12, 3267–3271 RSC.
- N. P. Macdonald, J. M. Cabot, P. Smejkal, R. M. Guijt, B. Paull and M. C. Breadmore, Anal. Chem., 2017, 89, 3858–3866 CrossRef CAS PubMed.
- M. J. Beauchamp, G. P. Nordin and A. T. Woolley, Anal. Bioanal. Chem., 2017, 409, 4311–4319 CrossRef CAS PubMed.
- D. Tripathi, Practical Guide to Polypropylene, RAPRA Technology, Shawbury, UK, 2002 Search PubMed.
- F. N. Cogswell, Thermoplastic Aromatic Polymer Composites, Butterworth-Heinemann, Oxford, UK, 1992 Search PubMed.
- P. A. Schweitzer, Mechanical and Corrosion-Resistant Properties of Plastics and Elastomers, Taylor & Francis, Boca Raton, 2000 Search PubMed.
- J. Britton and C. L. Raston, Chem. Soc. Rev., 2017, 46, 1250–1271 RSC.
- M. B. Plutschack, B. Pieber, K. Gilmore and P. H. Seeberger, Chem. Rev., 2017, 117, 11796–11893 CrossRef CAS PubMed.
- R. L. Hartman, J. P. McMullen and K. F. Jensen, Angew. Chem., Int. Ed., 2011, 50, 7502–7519 CrossRef CAS PubMed.
- T. Barri and J. Å. Jönsson, Chromatographia, 2004, 59, 161–165 CAS.
- Z.-X. Cai, Q. Fang, H.-W. Chen and Z.-L. Fang, Anal. Chim. Acta, 2006, 556, 151–156 CrossRef CAS PubMed.
- J. G. Kralj, H. R. Sahoo and K. F. Jensen, Lab Chip, 2007, 7, 256–263 RSC.
- K. Wang and G. Luo, Chem. Eng. Sci., 2017, 169, 18–33 CrossRef CAS.
- A. Adamo, P. L. Heider, N. Weeranoppanant and K. F. Jensen, Ind. Eng. Chem. Res., 2013, 52, 10802–10808 CrossRef CAS.
- J. M. Neumaier, A. Madani, T. Klein and T. Ziegler, Beilstein J. Org. Chem., 2019, 15, 558–566 CrossRef CAS PubMed.
- K. Singh, Int. J. Plast. Technol., 2018, 22, 177–184 CrossRef CAS.
- A. D. Awtrey and R. E. Connick, J. Am. Chem. Soc., 1951, 73, 1842–1843 CrossRef CAS.
- M. I. Elzagheid, E. Viazovkina and M. J. Damha, Curr. Protoc. Nucleic Acid Chem., 2002, 10, 1718–1719 Search PubMed.
- F. T. Chin, M. Namavari, J. Levi, M. Subbarayan, P. Ray, X. Chen and S. S. Gambhir, Mol. Imaging Biol., 2008, 10, 82–91 CrossRef PubMed.
- V. Hessel, H. Löwe and F. Schönfeld, Chem. Eng. Sci., 2005, 60, 2479–2501 CrossRef CAS.
- S. Hossain and K.-Y. Kim, Micromachines, 2014, 5, 913–928 CrossRef.
- L. Wang, S. Ma, W. Jing, H. Bi and X. Han, Asia-Pac. J. Chem. Eng., 2014, 9, 877–885 CrossRef CAS.
- A. D. Stroock, S. K. W. Dertinger, A. Ajdari, I. Mezić, H. A. Stone and G. M. Whitesides, Science, 2002, 295, 647–651 CrossRef CAS PubMed.
- F. Schönfeld, V. Hessel and C. Hofmann, Lab Chip, 2004, 4, 65–69 RSC.
- J.-M. Commenge and L. Falk, Chem. Eng. Process., 2011, 50, 979–990 CrossRef CAS.
- Z. A. Li, J. Yang, K. Li, L. Zhu and W. Tang, RSC Adv., 2017, 7, 3313–3320 RSC.
- M. Engler, N. Kockmann, T. Kiefer and P. Woias, Chem. Eng. J., 2004, 101, 315–322 CrossRef CAS.
- X. Fu, S. Liu, X. Ruan and H. Yang, Sens. Actuators, B, 2006, 114, 618–624 CrossRef CAS.
- V. Hessel, S. Hardt, H. Löwe and F. Schönfeld, AIChE J., 2003, 49, 566–577 CrossRef CAS.
- M. Hoffmann, M. Schlüter and N. Räbiger, Chem. Eng. Sci., 2006, 61, 2968–2976 CrossRef CAS.
- S. H. Wong, M. C. L. Ward and C. W. Wharton, Sens. Actuators, B, 2004, 100, 359–379 CrossRef CAS.
- K. Karthikeyan and L. Sujatha, Int. J. Chem. React. Eng., 2018, 17, 20180047 Search PubMed.
- K. J. Hecht, A. Kölbl, M. Kraut and K. Schubert, Chem. Eng. Technol., 2008, 31, 1176–1181 CrossRef CAS.
- S. Schwolow, J. Hollmann, B. Schenkel and T. Röder, Org. Process Res. Dev., 2012, 16, 1513–1522 CrossRef CAS.
- M. Tebboth, A. Kogelbauer and A. Bismarck, Ind. Eng. Chem. Res., 2015, 54, 5974–5981 CrossRef CAS.
- L. Falk and J. M. Commenge, Chem. Eng. Sci., 2010, 65, 405–411 CrossRef CAS.
- K. Wang, H. Zhang, Y. Shen, A. Adamo and K. F. Jensen, React. Chem. Eng., 2018, 3, 707–713 RSC.
- L. h. Nouri, L. Abouda and J. Legrand, Chem. Eng. Process., 2014, 78, 37–43 CrossRef CAS.
- S. R. L. Gobert, S. Kuhn, L. Braeken and L. C. J. Thomassen, Org. Process Res. Dev., 2017, 21, 531–542 CrossRef CAS.
- H. M. Xia, S. Y. M. Wan, C. Shu and Y. T. Chew, Lab Chip, 2005, 5, 748–755 RSC.
- W.-S. Yoo, J. Go, S. Park and S.-H. Park, J. Micromech. Microeng., 2012, 22, 035007 CrossRef.
- J. Wegner, S. Ceylan and A. Kirschning, Chem. Commun., 2011, 47, 4583–4592 RSC.
Footnote |
| † Electronic supplementary information (ESI) available. See DOI: 10.1039/d0re00206b |
| This journal is © The Royal Society of Chemistry 2020 |

