
The role of hydrogen coverage and location in 1,3-butadiene hydrogenation over Pt/SiO2†
Chaoquan
Hu
 *a,
Mingyuan
Shao
ab,
Maoqiao
Xiang
a,
Shaofu
Li
a and
Shuanghao
Xu
a
*a,
Mingyuan
Shao
ab,
Maoqiao
Xiang
a,
Shaofu
Li
a and
Shuanghao
Xu
a
aState Key Laboratory of Multiphase Complex Systems, Institute of Process Engineering, Chinese Academy of Sciences, Beijing 100190, China. E-mail: cqhu@ipe.ac.cn
bUniversity of Chinese Academy of Sciences, Beijing 100049, China
First published on 23rd October 2019
Abstract
Hydrogenation of 1,3-butadiene over supported Pt particles has long been known as a structure sensitive reaction, yet the nature of this phenomenon has not been well understood. We have previously addressed the reaction pathway for 1,3-butadiene hydrogenation over ∼22 nm Pt particles. In this study, the behaviors of SiO2 supported ∼2.9 nm Pt particles towards 1,3-butadiene hydrogenation have been investigated with the aim of providing a fundamental explanation for the structure sensitivity of this reaction. Interestingly, it was found that the product distribution for the present catalyst towards 1,3-butadiene hydrogenation was sensitive to temperature. However, the evolution of 1,3-butadiene hydrogenation over the catalyst with temperature was not captured by in situ diffuse reflectance infrared Fourier transform (DRIFT) spectroscopy. The detected carbonaceous species on the Pt surface are more likely to be spectators rather than reaction intermediates for the formation of butenes and n-butane. To understand the behaviors of the catalyst, density functional theory (DFT) calculations were employed to explore the pathways for the formation of the products with low activation barriers. The results show that the coverage and the location of the hydrogen atom are the two key factors for the interpretation of the behavior of Pt particles towards 1,3-butadiene hydrogenation.
1. Introduction
Selective hydrogenation of dienes is an important process in the food and oil refining industries.1–5 1,3-Butadiene, a simple unsaturated conjugated hydrocarbon, is widely chosen as a probe molecule for fundamental and mechanistic studies. Following the Horiuti–Polanyi mechanism,6 1,3-butadiene hydrogenation may involve a stepwise insertion of four hydrogen atoms to the two C![[double bond, length as m-dash]](https://www.rsc.org/images/entities/char_e001.gif) C bonds of 1,3-butadiene. As shown in Fig. 1, the insertion of the first H atom at an internal carbon of 1,3-butadiene produces the 1-buten-4-yl radical (1B4R), while the H-addition at a terminal carbon results in the 1-buten-3-yl radical (1B3R). The addition of a second H atom may lead to butenes and two intermediates (not shown), i.e., butan-1,4-diyl radical (B14R) and butan-1,3-diyl radical (B13R). These carbonaceous species can be further hydrogenated to produce n-butane with α- or β-butyl as an intermediate.
C bonds of 1,3-butadiene. As shown in Fig. 1, the insertion of the first H atom at an internal carbon of 1,3-butadiene produces the 1-buten-4-yl radical (1B4R), while the H-addition at a terminal carbon results in the 1-buten-3-yl radical (1B3R). The addition of a second H atom may lead to butenes and two intermediates (not shown), i.e., butan-1,4-diyl radical (B14R) and butan-1,3-diyl radical (B13R). These carbonaceous species can be further hydrogenated to produce n-butane with α- or β-butyl as an intermediate.
 | ||
| Fig. 1 Schematic of the reaction network for 1,3-butadiene hydrogenation. | ||
A main issue concerning 1,3-butadiene hydrogenation is the control of the product selectivity by using a heterogeneous catalyst. Over supported VIIIB transition monometals,7–23 1,3-butadiene hydrogenation in most cases yields four products: 1-butene, trans-/cis-2-butene, and n-butane. The product distribution has been demonstrated to be related to not only the electronic properties of metals,24 but also their particle size. This is particularly the case for supported Pt particles, which were found to produce three butenes with 60–90% selectivity by tuning the particle size of Pt.25–30 In our previous work, Pt particles with an average size of 22 nm could even induce partial hydrogenation of 1,3-butadiene with a selectivity of ∼97%.31 Obviously, hydrogenation of 1,3-butadiene over Pt is structure sensitive, a phenomenon which has attracted considerable attention in the field of catalysis.
Generally, the structure sensitivity of a hydrogenation reaction over supported metal particles is interpreted in terms of geometric and electronic effects.32 The former emphasizes the number and arrangement of sites on the metal surface, while the latter concerns the d-band center. These factors may affect hydrogenation reactions in various ways, such as the adsorption configuration and strength of reactants, reaction pathway, activation barrier of the rate-limiting step, product desorption, etc.
In the case of Pt-catalyzed 1,3-butadiene hydrogenation, the structure sensitivity is likely to be related to the variation of the reaction pathway with Pt particle size. By the use of in situ sum frequency generation (SFG) vibrational spectroscopy, Michalak et al. observed the vibrational stretches of methyl (CH3–) and methylene (–CH2–) groups for 0.9 and 1.8 nm Pt nanoparticles towards 1,3-butadiene hydrogenation.33 Hence, the pathways involving both 1B3R and 1B4R were proposed for these small Pt particles. In contrast, larger Pt nanoparticles with sizes of 4.6 and 6.7 nm favored the pathway with 1B3R as the intermediate. This phenomenon was considered to be related to the presence of more low-coordinated sites on the smaller Pt particles. However, a recent study of 1,3-butadiene hydrogenation over ∼4 nm Pt nanoparticles encapsulated in SiO2 shells (Pt@SiO2) demonstrated that the intermediates could involve 1B3R, 1B4R, and B13R.34 The uncertainty of the intermediates was due to the overlapping vibrational features of these species. From the above two studies, one can see that there is a discrepancy between the behaviors of the ∼4 nm Pt particles towards 1,3-butadiene hydrogenation. The different amount of low-coordination sites cannot be used for understanding the variation of hydrogenation pathway with Pt particle size.
First-principles simulations may shed light on interpretation of the dependence of the pathway of 1,3-butadiene hydrogenation on Pt particle size.35–41 Valcárcel et al. performed a density functional theory (DFT) study of 1,3-butadiene hydrogenation to butenes on Pt(111).35 Assuming a tetra-σ adsorption configuration for 1,3-butadiene on the surface, the barriers for the formation 1B3R and 1B4R were similar (0.83 eV). It appears to well explain the parallel reaction pathways for the small Pt particles. However, this cannot be used to understand the prior formation of 1B3R on large Pt particles. On the other hand, our previous DFT calculations have revealed that the adsorption structure of 1,3-butadiene has an obvious effect on the activation barriers for the formation of 1B3R and 1B4R.42 When 1,3-butadiene adsorbs on the surface with a di-σ structure, the non-coordinated terminal carbon can be easily hydrogenated to form 1B3R with a significantly low energy barrier of 0.24 eV. Simultaneously, the formation of 1B4R from the hydrogenation of the internal carbon atom requires a barrier of 0.57 eV. This is in good agreement with the prior formation of 1B3R for 1,3-butadiene hydrogenation on large Pt particles. However, it cannot account for the simultaneous formation of 1B3R and 1B4R on small Pt particles. Hence, despite the previous experimental and theoretical work, the variation of the reaction pathway of 1,3-butadiene hydrogenation with Pt particle size remains unresolved.
The present work aims at the investigation of the catalytic behavior of small Pt particles towards 1,3-butadiene hydrogenation for understanding the structural sensitivity of this reaction. Towards this end, SiO2 supported Pt nanoparticles with an average size of 2.9 nm were prepared and investigated for gas-phase 1,3-butadiene hydrogenation. The choice of SiO2 as a support can avoid the support effects on hydrogenation reactions. The catalyst surface information for the reaction under actual conditions was obtained by employing in situ diffuse reflectance infrared Fourier transform (DRIFT) spectroscopy. Theoretical calculations were performed to interpret the present experimental phenomena and the information available in the literature. Efforts were focused on the following two aspects: the simultaneous formation of 1B3R and 1B4R, and lowering the activation barriers of each elementary step. A molecular-level picture of the hydrogenation of 1,3-butadiene on the small Pt particles has been proposed. Furthermore, the structure sensitivity of this reaction is discussed in terms of the reaction model and the key issues involved.
2. Methodology
2.1. Catalyst preparation and characterization
The raw materials, SiO2 and Pt(NO3)2 solution, were purchased from Xilong Chemical Industry Co. LTD and Aladdin, respectively. The as-received SiO2 was calcined at 700 °C for 4 h under a static air atmosphere in a muffle furnace. After the thermal treatment, the support had a surface area of ∼3 m2 g−1. The Pt/SiO2 catalyst used in this study was prepared by a wet impregnation process. Typically, 0.99 g SiO2 was added to 100 ml Pt(NO3)2 solution under strong stirring to produce a suspension. Then, an ammonia solution was added dropwise to the above suspension at room temperature until the pH value of the suspension reached 10. After stirring for another 1 h, the suspension was filtered and washed with deionized water. The obtained powder was dried at 100 °C for 12 h, and then calcined at 400 °C for 4 h to produce the Pt/SiO2 catalyst.The Pt content in the catalyst was determined to be 1.0 wt% by XRF (AXIOS MAX, PANalytical). The morphology of the catalyst was characterized by scanning electron microscopy with energy dispersive spectrum analysis (SEM-EDS, JSM-7001F; JEOL). The size distribution of the Pt particles on the support was determined by transmission electron microscopy (TEM) using a JEOL 2100 instrument. The Pt particles were assumed to be spherical and the average particle size was calculated according to the equation d = ∑nidi3/∑nidi2.
Temperature-programmed desorption of hydrogen (H2-TPD) was carried out in a flow system equipped with a thermal conductivity detector (TCD) for detection of H2. 0.3 g of the catalyst was reduced at 400 °C for 1 h in a tubular reactor, and then cooled down to 35 °C for H2 adsorption. This was achieved by feeding a constant H2 flow to the reactor for several hours. Then, the flow gas was switched to pure Ar at room temperature to remove weakly adsorbed H2 until a steady level of baseline was obtained. The catalyst was heated from room temperature to 260 °C at a ramping rate of 10 °C min−1.
2.2. Catalytic activity and in situ DRIFT characterization
The gas-phase hydrogenation of 1,3-butadiene on the Pt/SiO2 catalyst was studied at atmospheric pressure in a tubular fixed-bed reactor. Prior to the hydrogenation test, 20 mg of the catalyst was loaded into the reactor and reduced at 400 °C for 1 h. A gas mixture of 5% H2 and 0.32% 1,3-butadiene balanced by Ar was introduced into the reactor for the hydrogenation. The gas stream was analyzed by two calibrated gas chromatographs (GCs) equipped with an FID and TCD. More details about the hydrogenation test are available in the previous study.31Under the present experimental conditions with 1,3-butadiene conversions lower than 20%, the maximum value of the Weisz modulus was estimated to be 0.005, which is significantly less than 1.0. This indicates that the intraparticle concentration gradients could be considered to be negligible. In addition, our previous study has demonstrated that the interphase concentration gradients could also be neglected. Therefore, it can be confirmed that the four products are primary for 1,3-butadiene hydrogenation over the Pt particles. Hence, it is not necessary to perform Delplot analysis, namely, plotting selectivity or selectivity/conversion against conversion, to identify the product rank (primary, secondary, etc.) of this reaction.
In situ DRIFT characterization of the catalyst surface under the reaction conditions was carried out using a BRUKER TENSOR II spectrometer. The catalyst was loaded into an in situ cell equipped with ZnSe windows. Before the DRIFT experiments, the catalyst was reduced at 400 °C with 20 ml min−1 of 50% H2/Ar for 1 h, and then purged with pure Ar for 1 h at the same temperature to remove hydrogen adsorbed on the catalyst. After the cell cooled down to room temperature, a gas mixture of H2 and 1,3-butadiene balanced by Ar was fed into the cell with a flow rate of 20 mL min−1. The IR spectra were collected at different temperatures.
2.3. DFT calculations
The DFT calculations were performed using the CASTEP package,43 which employs the density functional theory plane-wave pseudopotential method.44 The Pt(111) surface was represented by a slab model with four Pt layers, and each slab was spaced by a vacuum layer of 15 Å. The Pt atoms on the bottom two layers were kept frozen at the computed bulk positions, while the upper two layers were free to relax. Plane-waves with a kinetic energy up to 600 eV were used in the calculations. The exchange-correlation energy has been calculated within generalized gradient approximation (GGA) using the form of Perdew, Burke, and Ernzerhof (PBE) exchange-correlation functional.45 The reciprocal space was sampled with a (2 × 2 × 1) k-point grid generated by the Monkhorst–Pack method. The search of the transition state (TS) of an elementary step was carried out by using the LST/QST method.463. Results and discussion
3.1. Characterization and catalytic performance of the catalyst
The morphology of the supported catalyst was characterized by SEM and is shown in Fig. 2. The SiO2 support displayed an irregular shape with a dense surface (Fig. 2a). This indicates a poor pore structure, and is consistent with the low surface area of the support. The EDX elemental mapping of Pt, Si, and O on the catalysts shows that the Pt particles were well distributed on the support (Fig. 2b–d). The TEM image (Fig. 2e and f) reveals that the size of most of the Pt particles was in the range of 1–4.5 nm. The average size of these Pt particles was estimated to be 2.9 nm, which is less than that of previously reported catalysts using the same support.31 The smaller Pt particle size in this study could be due to the use of a lower calcination temperature (400 °C) for the decomposition of the Pt precursor. | ||
| Fig. 2 (a) SEM image of the catalyst and the elemental mapping of (b) Si, (c) O, and (d) Pt on the catalyst surface; (e) TEM image of the catalyst and (f) the size distribution of Pt particles. | ||
Fig. 3 shows the conversion of 1,3-butadiene and the product distribution for the catalyst towards 1,3-butadiene hydrogenation. It can be seen that the 1,3-butadiene conversion increased with increasing reaction temperature and reached about 99% at 167 °C. Over the investigated temperature range, 1-butene was produced with the highest selectivity among the four products. However, the selectivity to each species displayed different tendencies with the temperature or the 1,3-butadiene conversion. This is different from the performance of ∼22 nm Pt particles towards 1,3-butadiene hydrogenation, which yielded a nearly constant product distribution.42 According to the variation of 1-butene or n-butane selectivity with the reaction temperature, three regimes can be identified.
 | ||
| Fig. 3 1,3-Butadiene conversion and product distribution for the hydrogenation of 1,3-butadiene over the Pt/SiO2 catalyst at different temperatures. | ||
In the temperature range from 31 to 90 °C (regime I), the selectivities to 1-butene and trans-2-butene increased by 9.12 and 2.09%, respectively. Correspondingly, the selectivities to n-butane and cis-2-butene decreased by 4.03 and 7.18%, respectively. The highest variation in the 1-butene selectivity indicates that the pathway for the production of 1-butene is interrelated to those for the formation of cis-2-butene and n-butane. Previous studies have revealed that n-butane was mainly produced from 1-butene hydrogenation.31,33 Thus, it is not surprising to observe an opposite trend for the selectivities to 1-butene and n-butane. As for the formation of 1-butene and cis-2-butene, their relationship can be understood from the reaction network of 1,3-butadiene hydrogenation. cis-2-Butene is produced from the hydrogenation of the terminal unsaturated carbon atom of cis-1B3R, which can also be hydrogenated to 1-butene. Hence, the opposite trend for the production of 1-butene and cis-2-butene could be due to the competition for hydrogenation of different unsaturated carbon atoms of cis-1B3R. Another possibility is that increasing the reaction temperature reduces the percentage of cis-1B3R on the catalyst surface. This can also lead to the decrease in the production of cis-2-butene.
An interesting phenomenon in this temperature range is the opposite trend for the selectivities to trans- and cis-2-butene. This has not been observed for 1,3-butadiene hydrogenation over Pt particles with sizes in the range of 0.9–22 nm.31,33 Since mass transfer limitations under the present conditions are negligible, the opposite variation of trans- and cis-2-butene selectivities with temperature is not because of the presence of secondary reactions, such as isomerization. In addition, if the trans-1B3R intermediate is dominant on the Pt particles, a higher selectivity to trans- than cis-2-butene is expected. This is because an endothermic conversion between trans- and cis-1B3R is required for the formation of cis-2-butene.42 Considering the relatively higher selectivity to cis- than trans-2-butene at 30 °C, it can be inferred that cis isomers should be dominant on the Pt particles. This could be similar to the adsorption of 1,3-butadiene on supported Au particles, on which the cis isomers were proposed to be preferred.47
The second regime is from 90 to 132 °C with the 1,3-butadiene conversion ranging from 30–80%. The selectivity to 1-butene started to decrease with simultaneous increases in the selectivities to the other three products. It appears that the secondary reactions become more significant, i.e., 1-butene to n-butane through hydrogenation and to 2-butenes through isomerization. However, we cannot exclude the possibility that with increasing reaction temperature, hydrogenation of 1B3R is more likely to form 2-butenes than 1-butene. According to the Horiuti–Polanyi mechanism, both the hydrogenation and the isomerization of 1-butene involve butyl as the intermediate. Thus, understanding the behavior of the catalyst in this regime requires deep insights into hydrogenation and dehydrogenation of butyl on the Pt surface.
When the 1,3-butadiene conversion was beyond 85% at temperatures higher than 132 °C (regime III), the selectivity to 1-butene remained nearly constant. However, the selectivities to 2-butenes continued to increase accompanied by a decrease in the n-butane selectivity. It is likely that in this reaction regime, butyl prefers dehydrogenation than hydrogenation. This phenomenon is different from the reported behaviors of supported Pt or Pd particles, over which most butenes are hydrogenated to n-butane at high conversions of 1,3-butadiene.48–50
3.2. In situ DRIFT spectroscopy
To provide information for understanding the behaviors of the catalyst towards 1,3-butadiene hydrogenation, in situ DRIFT spectroscopic studies were performed to characterize the surface species during the reaction. Fig. 4 shows a selection of the DRIFT spectra recorded on the catalyst surface at different temperatures. The bands at frequencies above 3000 cm−1 are associated with the stretching modes of unsaturated C–H groups, e.g., –CH (3108 cm−1) and CH2 (3089 cm−1). These bands were also observed for gas-phase molecular 1,3-butadiene.31 The IR band at 2982 cm−1 is from the asymmetric stretching of CH2 and can be ascribed to σ-adsorbed species. In the region of 2980–2850 cm−1, the peaks correspond to CH3 asymmetric stretching (2966 cm−1), CH2 asymmetric stretching (2937 cm−1), CH3 symmetric stretching (2877 cm−1), and CH2 symmetric stretching (2863 cm−1).51,52
 | ||
| Fig. 4 Evolution of the DRIFT spectra with temperature for the Pt/SiO2 catalyst towards 1,3-butadiene hydrogenation. | ||
At room temperature (23 °C), the introduction of the gas mixture of 1,3-butadiene and H2 to the catalyst led to the appearance of bands related to vibrations from unsaturated CH groups (CH2 and –CH). Simultaneously, bands ascribed to the asymmetric and symmetric stretching vibrations of CH3– and CH2– groups were also observed. The gas at the outlet of the DRIFT cell was measured by GC and found to consist of the four products. Obviously, the hydrogenation of 1,3-butadiene over the present Pt particles can easily proceed at room temperature. This is consistent with the previous kinetic results that the apparent activation energy for 1,3-butadiene hydrogenation over ∼4 nm Pt particles was only about 0.22 eV.31 So, not surprisingly, in situ DRIFT spectroscopy fails to capture the evolution of 1,3-butadiene hydrogenation to butenes and n-butane. The carbonaceous species detected on the catalyst surface could be spectators, which do not participate in the formation of the four products at low temperatures. On the other hand, these species may be related to the variation of the product selectivity with temperature. Thus, we further analyzed the evolution of these bands with temperature for possible interpretation of the behaviors of the catalyst.
As the temperature increased, the bands beyond and below 3000 cm−1 exhibited different evolution features. For the bands at 3108 and 3089 cm−1 originating from unsaturated CH groups, the intensities rose first from 23 to 36 °C, and then decreased gradually with increasing temperature and nearly vanished at 116 °C. In the case of the bands at 2966 and 2877 cm−1 from CH3– stretching, the intensities became stronger with increasing temperature. In addition, the asymmetric and symmetric stretching vibrations from –CH2– were also present in the DRIFT spectra and varied with temperature. The simultaneous presence of the CH, –CH2–, and CH3– groups makes it difficult to assign the bands to specific carbonaceous species. However, at 116 °C or higher temperatures, the bands beyond 3000 cm−1 in the DRIFT spectra almost disappeared. The remaining bands in the range of 3000–2800 cm−1 are the characteristic bands of the butyl (C4H9) group on the Pt surface. It can be inferred that increasing the reaction temperature results in an accumulation of C4H9 on the catalyst surface. This also indicates that the hydrogenation of C4H9 to n-butane is a relatively difficult step compared to the other ones involved in the hydrogenation of 1,3-butadiene to C4H9. The behavior of the catalyst towards 1,3-butadiene hydrogenation at high temperatures could be understood from the coverage of C4H9.
3.3. DFT calculations
Obviously, in situ DRIFT spectroscopy is inappropriate to directly identify the reaction pathways of 1,3-butadiene hydrogenation over the catalyst. This motivates us to perform DFT calculations to gain molecular-level insights into the reaction. To build a reasonable DFT model, the following aspects should be noted.First, for 1,3-butadiene hydrogenation over supported Pt, the least thermodynamically stable 1-butene is the main product among the three butenes. This indicates that understanding the behavior of Pt towards 1,3-butadiene hydrogenation should be considered from the reaction kinetics rather than thermodynamics.
Second, on Pt foil and different Pt single-crystal surfaces, such as (111), (100), and (755),53 1,3-butadiene hydrogenation did not exhibit significant differences in the kinetic parameters. Hence, the different characteristics of the flat and stepped Pt surfaces cannot account for the structure sensitivity of this reaction.
Third, the kinetics of 1,3-butadiene hydrogenation over Pt are related to the size of the Pt particles used. The smaller the size of Pt particles, the lower the activation energy and reaction order with respect to H2 for the formation of each product.31 This indicates that hydrogen coverage could be a key point for understanding the behaviors of small Pt particles towards 1,3-butadiene hydrogenation.
Thus, in the following DFT calculations, we will focus on addressing the influence of H pre-coverage on the energy barriers of the elementary steps involved in the hydrogenation network (Fig. 1).
| EH,ads = (EPt(111)−Hn − EPt(111) − n/2 × EH2)/n |
 | ||
| Fig. 5 (a) The Pt(111) surface used in this study, and the arrangement of H atoms on the surface at different hydrogen coverages: (b) 0.11 ML, (c) 0.22 ML, (d) 0.44 ML, (e) 0.67 ML, and (f) 0.89 ML. | ||
One H atom slightly prefers fcc (Fig. 5b) over top and hcp sites on the Pt(111) surface. The adsorption energy for one H atom on fcc was estimated to be −0.49 eV, which is consistent with the reported value.56 In addition, the energy difference for the H atom on the three sites is not higher than 0.10 eV, and hence H migration on the pure Pt(111) surface is facile. In the case of two or four H atoms on the Pt(111) surface, the most stable configuration is placing the H atoms on hollow sites (Fig. 5c and d). The energy barrier for the migration of one H atom from the fcc to top site for the above two cases is about 0.06 eV.
When the number of H atoms increases to six or eight, the configuration with all H atoms on hollow sites is not the most energetically stable. This is due to the presence of obvious lateral repulsive interactions between the H atoms sitting at nearest-neighbor hollow sites while sharing the same Pt atoms.
Hence, we performed a comprehensive calculation of the total energy for the Pt(111) surface with H atoms on different sites. In the case of six H atoms on the surface, the energetically favorable configuration is the one with four H atoms on fcc sites and two on top sites (Fig. 5e). As for eight H atoms on the Pt(111) surface, two H atoms would occupy hollow sites and six H atoms are on top sites (Fig. 5f). The adsorption energy per H atom for the above two cases was calculated to be about 0.40 eV, respectively. These data are close to the reported data at a H coverage of 1.0 ML on the Pt(111) surface.56 For the above two cases, the barriers for the migration of one H atom from the hollow to top site are less than 0.11 eV. It is therefore concluded that the adsorption of H atoms on hollow and top sites is competitive at various H coverages.
Another issue of concern is the variation trend of the electronic structure of the Pt(111) surface with H coverage. Fig. 6 shows a comparison of the partial density of states (PDOS) of the Pt(111) surface at different H coverages. As expected, the bare Pt(111) surface mainly exhibits a d character with the center at −2.34 eV, which is consistent with the reported value of −2.25 eV.57 With increasing H coverage, the d-band center gradually decreases to −2.90 eV at a H coverage of 0.89 ML. Note that upon adsorption of H atoms on the Pt surface, a modification of the DOS near the Fermi level (εf) is obvious. The non-occupied states in the range of −2 to 0 eV were found to gradually decrease, while the occupied states increase at around 1.0 eV. This may affect the adsorption structure and affinity of carbonaceous species on the surface.
 | ||
| Fig. 6 Partial density of states (PDOS) for the first layer of the Pt(111) surface at different hydrogen coverages. The configurations of the H atoms on the surface are shown in Fig. 5. | ||
(i) C4H6 + H → C4H7 (1B3R and 1B4R). Both 1B3R and 1B4R intermediates were reported to form on small Pt particles towards 1,3-butadiene hydrogenation.33 This indicates a similar energy barrier for the first H atom insertion at internal and terminal carbon atoms of 1,3-butadiene. As mentioned above, it is easier to form 1B3R than 1B4R from the hydrogenation of 1,3-butadiene with the di-σ structure on the Pt(111) surface. Thus, we first investigated the effect of H coverage on the activation barriers for hydrogenation of di-σ 1,3-butadiene to 1B3R and 1B4R on the Pt(111) surface. The configuration of the coadsorption of 1,3-butadiene and seven H atoms on the Pt(111) surface is shown in R1 (Fig. 7). Compared to the co-adsorption of 1,3-butadiene and one H atom on the Pt(111) surface, the presence of more top H atoms does not obviously change the distances between the unsaturated carbon atoms and their coordinating Pt atoms. Since the six Pt atoms on the Pt(111) surface have been occupied by H atoms, the most stable configuration for 1B3R on the Pt surface is the π–σ structure (P1). On the other hand, 1B4R was found to adsorb through an η1 σ structure (P2 or P3) in the presence of the six hydrogen atoms on the top sites due to spatial mismatch.
 | ||
| Fig. 7 Energy reaction profiles for the hydrogenation of di-σ 1,3-butadiene to 1B3R and 1B4R, and the optimized structures of reactants, transition states, and products involved. | ||
With the adsorption structures of the reactant and products, the energy barriers for the addition of the first H atom to 1,3-butadiene were determined. For the formation of 1B3R, the energy barrier is 0.32 eV and the step is exothermic by 0.62 eV. In contrast, the addition of the H atom to the coordinating or the un-coordinating internal carbon atom to form 1B4R requires an energy barrier of at least 0.94 eV. Considering the structures of TS2 and TS3, the high barrier is mainly due to the decoordination of the internal carbon atom with the Pt surface. The above results indicate that the formation of 1B3R is more kinetically favorable than that of 1B4R, which is against the experimental phenomenon. It is highly possible that 1B4R is formed from hydrogenation of 1,3-butadiene with other adsorption modes rather than the di-σ structure.
Next, we studied the hydrogenation barriers of 1,3-butadiene with two η4 structures (tetra-σ and di-π) on the Pt(111) surface by varying the H coverage. For instance, a H coverage of 0.56 ML was used when the tetra-σ structure was assumed for 1,3-butadiene on the Pt(111) surface. A comprehensive DFT calculation shows that the formation of 1B4R from tetra-σ or di-π 1,3-butadiene hydrogenation generally needs a barrier higher than 0.90 eV (ESI†). This value is obviously higher than that for the formation of 1B3R from the hydrogenation of di-σ 1,3-butadiene. It is therefore concluded that for the formation of 1B4R, the adsorption configuration of 1,3-butadiene on small Pt particles is not the η2 and η4 modes.
Based on the above results, we started to investigate the hydrogenation of 1,3-butadiene in another two forms: gas-phase and η1 σ adsorption mode on the Pt(111) surface. For gas-phase 1,3-butadiene (R2), DFT calculations found that the hydrogenation of the internal carbon atom with a H atom on the top site is exothermic by 0.29 eV with a barrier of 0.42 eV. The corresponding structures of the product (P4) and TS4 are included in Fig. 8. This value is only 0.10 eV higher than that for the formation of 1B3R. In the case of the η1 σ adsorption mode for 1,3-butadiene on the Pt surface, it was found that the stability of this structure is considerably affected by the coverage of H. At a low H coverage of 0.11 ML, the σ structure for 1,3-butadiene on the surface is not stable and converges to the di-π or the tetra-σ structure. However, when the hydrogen coverage is increased to 0.33 ML, this structure can be stabilized. The reason for this is due to the shift of the d-band center of the Pt(111) surface to lower values. This weakens the interaction between internal unsaturated carbon atoms of 1,3-butadiene and the Pt surface, and hence is favorable for the stabilization of the σ structure. The adsorption energy for η1 σ 1,3-butadiene on the Pt surface (R3) was calculated to be −0.09 eV. This suggests that in this case, 1,3-butadiene is very weakly adsorbed on the Pt surface. As for the product 1B4R on the Pt surface, a η1 σ structure is also assumed (P5). With the adsorption configurations of 1,3-butadiene and 1B4R, the activation barrier for insertion of a top H atom to 1,3-butadiene to form 1B4R was determined to be 0.32 eV. This value is the same as that for the formation of 1B3R from the hydrogenation of di-σ 1,3-butadiene on the Pt(111) surface. In addition, the hydrogenation of the σ-bonded 1,3-butadiene to 1B3R (P6) requires a relatively higher barrier of 0.67 eV, which is almost twice the value for 1B4R. These results indicate that the simultaneous formation of 1B3R and 1B4R requires different adsorption configurations of 1,3-butadiene on the Pt surface.
 | ||
| Fig. 8 Energy reaction profiles for the hydrogenation of gas-phase and σ-bonded 1,3-butadiene to 1B4R, and the optimized structures of reactants, transition states, and products involved. | ||
(ii) C4H7 (1B3R and 1B4R) + H → C4H8 (1-butene and trans-2-butene). Previously, it was found that 1B3R with a σ structure on the Pt(111) surface could be stabilized at relatively high H coverages, and easily react with H on the top site to form 1-butene with a barrier of 0.29 eV.42 In the present study, the transformation of the σ–π to the σ structure for 1B3R on the Pt surface requires a barrier of 0.30 eV at high H coverages, e.g., 0.67 ML. Thus, both the 1B3R and 1B4R intermediates are assumed to adsorb on the Pt(111) surface through σ configurations before being further hydrogenated to butenes. The present calculations are focused on the hydrogenation of 1B3R to trans-2-butene and 1B4R to 1-butene. When the H atom to react is located on a top site, the energy barriers for 1B3R + H (R4) → trans-2-butene (P7) and 1B4R + H (R6) → 1-butene (P8) were calculated to be 1.16 and 1.62 eV, respectively (black energy reaction profiles in Fig. 9). However, when the H atom is on an fcc site close to the unsaturated carbon adsorbed on the Pt surface (R5 and R7), the Pt–C distance was found to be obviously elongated. This phenomenon is ascribed to the presence of repulsive interactions between the H and the adsorbed unsaturated carbon atoms. In this case, the energy barriers for hydrogenation of the two intermediates were significantly decreased to 0.27 eV for 1B3R hydrogenation to trans-2-butene (R5 → P7) and 0.52 eV for 1B4R hydrogenation to 1-butene (R7 → P8).
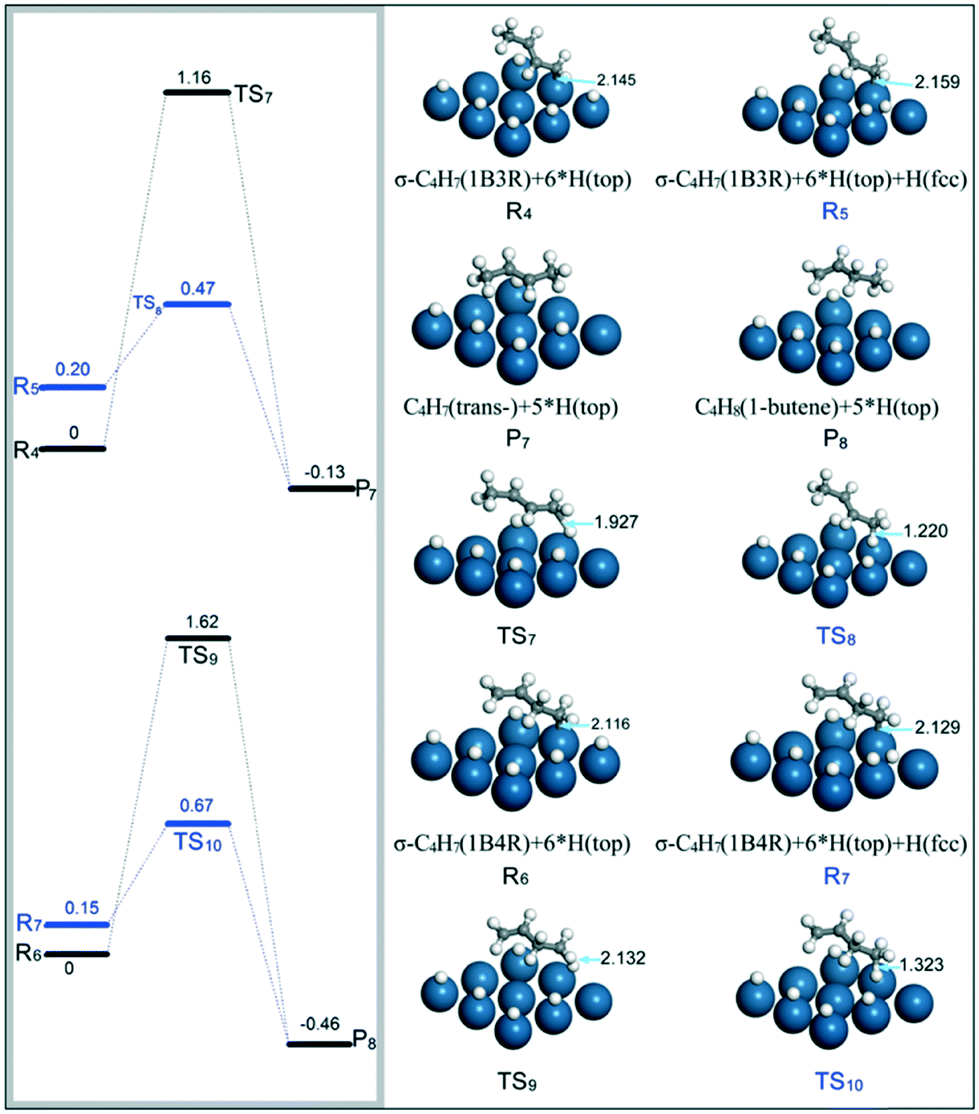 | ||
| Fig. 9 Energy reaction profiles for hydrogenation of 1B3R to trans-2-butene and 1B4R to 1-butene, and the optimized structures of reactants, transition states, and products involved. | ||
(iii) C4H8 (1-butene) → β-C4H9 → C4H10. Hydrogenation of 1-butene to n-butane has been investigated in the previous study with the aim of understanding the formation of n-butane.31 The results have demonstrated that this hydrogenation step is considerably related to the location of the H atom on the Pt surface. High energy barriers (>0.9 eV) are required for H on the top site to react with the unsaturated carbon atom of 1-butene or β-C4H9.31 In contrast, the addition of the H atom on a hollow site to its neighboring carbon atom adsorbed on the surface could be facile. For instance, the terminal unsaturated carbon atom of di-σ 1-butene on the Pt(111) surface can be hydrogenated to β-C4H9 with a barrier of about 0.30 eV.31 Hence, this elementary step was not further investigated at different H coverages.
A main issue of concern for the transformation process from 1-butene to n-butane is the relatively high barrier (0.79 eV) for the hydrogenation of β-C4H9 with the H atom on a fcc site to C4H10.31 As demonstrated in the previous study, the barrier for this elementary step depends on the interaction between the unsaturated carbon and the Pt surface. Weakening the C–Pt bond strength is supposed to be favorable for the hydrogenation to proceed. Thus, the distance of the C–Pt bond was investigated at different coverages of H atoms on top and hollow sites. As shown in Fig. 10, the presence of more H atoms on the hollow sites close to the unsaturated carbon atoms obviously elongates the Pt–C bond length. For the β-C4H9 intermediate with three neighboring H atoms on the fcc sites (R8), the hydrogenation barrier to form C4H10 (P9) is 0.54 eV. This value is less than half of the activation barrier (1.15 eV) for the addition of a top H atom to β-C4H9 to form n-butane.31 Therefore, the hydrogenation of β-C4H9 to n-butane is more related to the coverage of the H atom on hollow than top sites.
 | ||
| Fig. 10 Effect of the H location site on the distance of Pt–C, and the energy barrier for the hydrogenation of β-C4H9 to n-butane. | ||
(iv) β-C4H9 → C4H8 (trans-) + H. DFT calculations found that the dehydrogenation of β-C4H9 (R9) to trans-2-butene on the Pt(111) surface is considerably related to the location of the H atom released from β-C4H9 (Fig. 11). When the H atom is on a top site (P10), the dehydrogenation of β-C4H9 to trans-2-butene is exothermic by about 0.03 eV with a barrier of 1.25 eV. The corresponding TS12 has a reactant-like structure with only one internal carbon atom coordinating with the Pt surface. By comparison, if the H atom is on a nearest hollow site to the adsorbed carbon atom (P11), the dehydrogenation is endothermic but has a relatively low energy barrier of 0.73 eV. In this case, TS13 displays a product-like configuration with the two internal carbon atoms interacting with the Pt surface. This would lower the energy of TS13, and hence decrease the activation barrier of the dehydrogenation.
 | ||
| Fig. 11 Energy reaction profiles for dehydrogenation of β-C4H9 to trans-2-butene with the H atom on the top or fcc site. | ||
3.4. Reaction model of 1,3-butadiene hydrogenation
Based on the above theoretical results, the most likely reaction pathways for 1,3-butadiene hydrogenation are illustrated in Fig. 12. The hydrogenation process starts with the adsorption of 1,3-butadiene through the di-σ and the σ structures on the Pt surface at high H coverages. The terminal carbon atom (C4) of di-σ-bonded 1,3-butadiene and the internal carbon atom (C2) of σ-bonded 1,3-butadiene can easily react with the H atom on a top site to form 1B3R and 1B4R, respectively. The two elementary steps have the same energy barrier, indicating the simultaneous formation of 1B3R and 1B4R. Under the conditions of high H coverages, the two intermediates (1B3R and 1B4R) with η1 σ structures can be stabilized on the surface and further hydrogenated to butenes. Specifically, the non-coordinated internal carbon atom (C3) of 1B3R reacts with a neighboring H atom on the top site to produce 1-butene. On the other hand, the terminal carbon atom (C1) coordinated with the Pt surface can also be hydrogenated with the formation of trans-2-butene. The H atom in this case is located on the hollow site, which is the nearest-neighbor to the Pt atom occupied by the C1 atom. A similar configuration for H and unsaturated carbon atoms coordinated with the Pt surface is also required for the other hydrogenation steps, such as 1B3R to trans-2-butene, 1B4R to 1-butene, and 1-butene to β-C4H9 and then to n-butane. From the activation barriers for the elementary steps, the addition of the two H atoms of a parahydrogen molecule to the same product molecule, especially 1-butene and β-C4H9, is possible. This could cause parahydrogen-induced polarization (PHIP), which is an interesting technique for application in magnetic resonance imaging.58–60 On the other hand, the present hydrogenation steps are assumed to follow the Horiuti–Polanyi mechanism. The H2 molecule first dissociates on the Pt surface before the occurrence of hydrogenation. The dissociative surface atomic H atoms could immigrate to other sites since the energy barrier for this process is generally less than 0.15 eV.61 This would cause a randomization of H atoms on the Pt surface, and hence result in the absence of PHIP effects. Therefore, the presence of PHIP effects depends on the competition between the immigration of H atoms and the hydrogenation. An elaborate kinetic analysis is still underway to understand the PHIP effects during 1,3-butadiene hydrogenation over Pt. | ||
| Fig. 12 Schematic illustration of 1,3-butadiene hydrogenation with H atoms located at top (black) and hollow (green) sites on the Pt surface. The numbers are the activation barriers (eV) for the elementary steps. | ||
Obviously, the hydrogenation of 1,3-butadiene to the four products on the Pt surface requires the presence of H atoms at different locations, i.e., top and hollow sites. The non-coordinated unsaturated carbon atom reacts with H atoms on top sites, while the σ-bound one requires H on its neighboring hollow site for the hydrogenation to proceed. This is consistent with the previous kinetic study where in two types of hydrogen atoms were required to explain the kinetics for the formation of 1-butene and n-butane on small Pt particles.
3.5. Understanding behaviors of the catalyst towards 1,3-butadiene hydrogenation
As shown in Fig. 12, all the elementary steps involved in the formation of the four products could proceed with low activation barriers. This could be the reason for the failure to capture the evolution of 1,3-butadiene hydrogenation over the catalyst by in situ DRIFT spectroscopy. In addition, the energy barriers for the hydrogenation of 1B4R to 1-butene and the step from β-C4H9 to n-butane are relatively higher than those of other steps. Thus, the vibrational features of 1B4R and butyl were simultaneously observed in the DRIFT spectra. According to the reaction model, the formation of each product is strongly affected by the location of H atoms on the Pt surface. For instance, more H atoms on top than hollow sites are supposed to improve the selectivity to 1-butene while decreasing n-butane selectivity. Thus, the interpretation of the variation of product selectivity with temperature requires understanding the effects of temperature on H migration between different location sites on the Pt surface.Towards this end, H2-TPD was performed to shed light on the dependence of the H location site on temperature. As shown in Fig. 13, H2 desorption started at room temperature and reached the maximum rate at around 64 °C. The desorption peak is broad, which is consistent with that of H2 desorption from a Pt/H-LTL sample.62 This phenomenon was interpreted with a three-site adsorption model, which assumed H adsorption at ontop, n-fold, and atop sites. The H atoms located at ontop sites were weakly bound to the Pt particles and desorbed at low temperatures (<27 °C). To understand the desorption of H2 on the present Pt particles, we explored the desorption energy of H2 from the Pt(111) surface by varying the H coverage from 0.23 to 1.33 ML with a step of 0.22 ML. In this study, the desorption energy of H2 is defined as follows:
| Edesorption = EH2 + EPt+(n−2)H – EPt+nH |
 | ||
| Fig. 13 H2-TPD curve of the Pt/SiO2 catalyst. | ||
 | ||
| Fig. 14 Desorption energies of H2 molecules on the Pt(111) surface at different H coverages. | ||
As the temperature was increased to the range of 90–132 °C, less H2 is adsorbed and thus the total H coverage is expected to decrease. In addition, increasing the temperature enhances the conversion of 1,3-butadiene and consumes more H atoms. This also contributes to lowering the H coverage on the catalyst surface. In this case, H atoms should preferentially occupy hollow sites to achieve a more thermodynamically stable system. Hence, the proportion of H atoms on hollow sites is promoted, resulting in the increase of the reaction probabilities for 1-butene hydrogenation to butyl. The intermediate β-C4H9 gives rise to two reactions: hydrogenation to form n-butane and dehydrogenation to produce 2-butenes. Therefore, the selectivity to 1-butene was observed to decrease and the production of n-butane and 2-butenes was simultaneously increased. Besides this, the decrease in 1-butene selectivity may also be related to the competition for hydrogenation of different unsaturated carbon atoms of 1B3R. With the increase in the ratio of H atoms on hollow to top sites, it is expected that more 1B3R would be hydrogenated to 2-butenes. This may also lead to the reduction of 1-butene selectivity and improvement of 2-butene production. Note that at low H coverages, 1B3R is supposed to be preferentially formed on the Pt surface. This may also contribute to the decrease in the selectivity to 1-butene.
When the temperature was raised above 132 °C, the H coverage on the catalyst should be further decreased. Therefore, similar trends for the selectivity to each product are supposed to continue before the temperature at which all butenes are hydrogenated to n-butane. However, this is against the experimental phenomenon that the selectivity to n-butane began to decrease at temperatures above 132 °C. It seems that the occupation of H atoms on hollow sites is inhibited to some extent. As evidenced by the in situ DRIFT spectra, increasing the temperature led to the accumulation of C4H9 on the catalyst surface. Hence, it is likely that H adsorption or migration is related to the coverage of C4H9. To understand the effect of C4H9 coverage on H migration on the Pt surface, we investigated the coadsorption of β-C4H9 and H on a (2 × 2) Pt(111) surface, corresponding to a butyl coverage of 0.25 ML. Interestingly, it was found that H on the hollow site nearest to the C4H9 group is not thermodynamically stable and moves away (ESI†). This would lead to the neighboring hollow sites available for dehydrogenation of C4H9 rather than the hydrogenation reaction. Hence, the n-butane selectivity was observed to decrease, while 2-butenes were increased simultaneously.
3.6. Structure sensitivity
Experimentally, the structure sensitivity of Pt-catalyzed 1,3-butadiene hydrogenation has three aspects: reaction pathway, kinetics, and product selectivity. Briefly, decreasing the Pt particle size increases the production of n-butane and lowers the activation energies for the formation of the four products. On the basis of the present and previous results, these experimental phenomena stem from the variation of H coverage with Pt particle size. The higher H coverage on smaller Pt particles is largely due to the presence of more edges and corners. These sites could be more accessible for adsorption of H2 than 1,3-butadiene, promoting H coverage on smaller Pt particles.A pronounced influence of H coverage on 1,3-butadiene hydrogenation over Pt is the adsorption geometries of carbonaceous species involved. On large Pt particles with low H coverages, 1,3-butadiene adsorbs on the surface through the di-σ structure, and the 1B3R and 1B4R intermediates are bound with the most stable tri-σ structures. Compared with this, the pre-adsorbed H atoms on the Pt surface can stabilize 1,3-butadiene with the η1 σ geometry, besides the di-σ configuration. Correspondingly, η1 σ adsorption modes are also stabilized for both 1B3R and 1B4R.
The adsorption geometries of these carbonaceous species play an important role in determining their hydrogenation barriers. For 1,3-butadiene with the di-σ structure on the Pt surface, the terminal uncoordinated carbon atom can be easily hydrogenated to form 1B3R. In the case of σ-bonded 1,3-butadiene, the internal carbon atom closer to the surface is more prone to hydrogenation with the formation of 1B4R. Thus, the reaction pathway of 1,3-butadiene hydrogenation over Pt was observed to vary with Pt particle size. The second hydrogenation step, namely, from 1B3R and 1B4R to butenes, is also considerably related to the adsorption geometries of the two intermediates. For instance, hydrogenation of 1B3R to 1-butene with the tri-σ structure on the Pt(111) surface requires a barrier of 1.10 eV, and is the rate-determining step in the formation of 1-butene. However, the hydrogenation of σ-bound 1B3R only needs a barrier of 0.29 eV. As a consequence, the kinetics of 1,3-butadiene hydrogenation varies with Pt particle size.
Finally, the H coverage has an effect on the H arrangement, which affects the product distribution. At a low H coverage of 0.11 ML on the Pt(111) surface, H is supposed to occupy the hollow site. However, the co-adsorption of the tri-σ 1B3R intermediate with its neighboring H on the hollow site is not thermodynamically stable, and the H atom moves to a top site.42 This would result in the lowering of the coverage of H on hollow sites, and hence decrease the selectivity to n-butane. When H coverage is high, both top and hollow sites can be occupied by H atoms and the ratio of the two types of H atoms is related to the experimental conditions, such as H2 partial pressure, reaction temperature, etc. In this case, the carbonaceous intermediates, such as 1B3R and 1B4R, adsorb on the Pt surface with η1 σ adsorption modes. The co-adsorption of these species with H on hollow and top sites does not display strong repulsions, and more H atoms on hollow sites are favorable for the formation of n-butane.
4. Conclusions
In summary, this study has investigated the catalytic performance of ∼2.9 nm Pt particles towards 1,3-butadiene hydrogenation for understanding the structure sensitivity of this reaction. Our results point to the central roles that the coverage and location of the H atom play in defining the product distribution of 1,3-butadiene hydrogenation over Pt. The former affects the adsorption structures of carbonaceous species, such as 1,3-butadiene, and the 1B3R and 1B4R intermediates on the Pt surface. At high H coverages, gas-phase or weakly adsorbed 1,3-butadiene can be easily hydrogenated, resulting in two parallel reaction pathways with 1B3R and 1B4R as the intermediates. Besides the H coverage, the location of the H atom on the Pt surface is considerably related to the activation barriers of the elementary steps involved in 1,3-butadiene hydrogenation. The H atom on a top site easily reacts with the unsaturated carbon atom without coordinating to Pt, while the H atom on a hollow site is prone to being added to its neighboring σ-bound carbon atom. The site distribution of H atoms on the Pt surface is affected by temperature and 1,3-butadiene conversion, resulting in the variation of the product distribution with the experimental conditions. The above information can be applied to qualitatively interpret the behaviors of the small Pt particles towards 1,3-butadiene hydrogenation. Also, the reported variation of the reaction pathway and kinetics with Pt particle size can be well understood from this study. Construction of an elaborate kinetic model with consideration of H coverage on different location sites, H2 partial pressure, and temperature is still ongoing for quantifying the product distribution of 1,3-butadiene hydrogenation.Conflicts of interest
There are no conflicts to declare.Acknowledgements
This work was supported by the National Natural Science Foundation of China (21606236) and the Center for Mesoscience, Institute of Process Engineering (IPE), Chinese Academy of Sciences (CAS) (COM2016A001 and MPCS-2017-A-02).Notes and references
- Á. Molnár, A. Sárkány and M. Varga, J. Mol. Catal. A: Chem., 2001, 173, 185 CrossRef.
- L. Luza, A. Gual and J. Dupont, ChemCatChem, 2014, 6, 702 CrossRef CAS.
- F. Zaera, Phys. Chem. Chem. Phys., 2013, 15, 11988 RSC.
- F. León, J. Francos, J. López-Serrano, S. E. García-Garrido, V. Cadierno and A. Pizzano, Chem. Commun., 2019, 55, 786 RSC.
- C. Hu, D. Creaser, S. Siahrostami, H. Grönbeck, H. Ojagh and M. Skoglundh, Catal. Sci. Technol., 2014, 4, 2427 RSC.
- M. Polanyi and J. Horiuti, Trans. Faraday Soc., 1934, 30, 1164 RSC.
- D. Pérez, C. Olivera-Fuentes, S. Curbelo, M. J. Rodríguez and S. Zeppieri, Fuel, 2015, 149, 34 CrossRef.
- Y. Xu, D. Ma, J. Yu, X. Jiang, J. Huang and D. Sun, Ind. Eng. Chem. Res., 2017, 56, 10623 CrossRef CAS.
- Z. Wang, G. Wang, C. Louis and L. Delannoy, J. Catal., 2017, 347, 185 CrossRef CAS.
- L. Piccolo, L. Kibis, M.-C. De Weerd, E. Gaudry, J. Ledieu and V. Fournée, ChemCatChem, 2017, 9, 2292 CrossRef CAS.
- N. Masoud, L. Delannoy, H. Schaink, A. van der Eerden, J. W. de Rijk, T. A. G. Silva, D. Banerjee, J. D. Meeldijk, K. P. de Jong, C. Louis and P. E. de Jongh, ACS Catal., 2017, 7, 5594 CrossRef CAS.
- N. Masoud, L. Delannoy, C. Calers, J.-J. Gallet, F. Bournel, K. P. de Jong, C. Louis and P. E. de Jongh, ChemCatChem, 2017, 9, 2418 CrossRef CAS.
- C. Liu, K. Yang, J. Zhao, Y. Pan and D. Liu, Catal. Commun., 2015, 67, 72 CrossRef CAS.
- S. Derrouiche, C. L. Fontaine, G. Thrimurtulu, S. Casale, L. Delannoy, H. Lauron-Pernot and C. Louis, Catal. Sci. Technol., 2016, 6, 6794 RSC.
- H. Yi, H. Du, Y. Hu, H. Yan, H.-L. Jiang and J. Lu, ACS Catal., 2015, 5, 2735 CrossRef CAS.
- H. Yan, H. Cheng, H. Yi, Y. Lin, T. Yao, C. Wang, J. Li, S. Wei and J. Lu, J. Am. Chem. Soc., 2015, 137, 10484 CrossRef CAS.
- E. Castillejos, B. Bachiller-Baeza, E. Asedegbega-Nieto, A. Guerrero-Ruiz and I. Rodríguez-Ramos, RSC Adv., 2015, 5, 81583 RSC.
- J. Gaube and H.-F. Klein, Appl. Catal., A, 2014, 470, 361 CrossRef CAS.
- D. Yardimci, P. Serna and B. C. Gates, ACS Catal., 2012, 2, 2100 CrossRef CAS.
- W. W. Lonergan, X. Xing, R. Zheng, S. Qi, B. Huang and J. G. Chen, Catal. Today, 2011, 160, 61 CrossRef CAS.
- L. Piccolo, A. Valcarcel, M. Bausach, C. Thomazeau, D. Uzio and G. Berhault, Phys. Chem. Chem. Phys., 2008, 10, 5504 RSC.
- A. Aguilar-Tapia, L. Delannoy, C. Louise, C. W. Han, V. Ortalan and R. Zanella, J. Catal., 2016, 344, 515 CrossRef CAS.
- R. Hou, M. D. Porosoff, J. G. Chen and T. Wang, Appl. Catal., A, 2015, 490, 17 CrossRef CAS.
- R. B. Moyes, P. B. Wells, J. Grant and N. Y. Salman, Appl. Catal., A, 2002, 229, 251 CrossRef CAS.
- Y. Jugnet, R. Sedrati and J. C. Bertolini, J. Catal., 2005, 229, 252 CrossRef CAS.
- T. Ouchaib, J. Massadier and Z. Renouprez, J. Catal., 1989, 119, 517 CrossRef CAS.
- M. Primet, M. Elazhar and M. Guenin, Appl. Catal., 1990, 58, 241 CrossRef CAS.
- C.-M. Pradier, E. Margot, Y. Berthier and J. Oudar, Appl. Catal., 1988, 43, 177 CrossRef CAS.
- J. Oudar, S. Pinol, C. M. Pradier and Y. Berthier, J. Catal., 1987, 107, 445 CrossRef CAS.
- J. Goetz, D. Y. Murzin and R. A. Touroude, Ind. Eng. Chem. Res., 1996, 35, 703 CrossRef CAS.
- C. Hu, J. Sun, D. Kang, Q. Zhu and Y. Yang, Catal. Sci. Technol., 2017, 7, 2717 RSC.
- D. A. G. Aranda and M. Schmal, J. Catal., 1997, 171, 398 CrossRef CAS.
- W. D. Michalak, J. M. Krier, K. Komvopoulos and G. A. Somorjai, J. Phys. Chem. C, 2013, 117, 1809 CrossRef CAS.
- J. M. Krier, W. D. Michalak, X. Cai, L. Carl, K. Komvopoulos and G. A. Somorjai, Nano Lett., 2015, 15, 39 CrossRef CAS PubMed.
- A. Valcárcel, A. Clotet, J. M. Ricart, F. Delbecq and P. Sautet, J. Phys. Chem. B, 2005, 109, 14175 CrossRef.
- S. Gautier and P. Sautet, J. Phys. Chem. C, 2017, 121, 25152 CrossRef CAS.
- K. Yang and B. Yang, J. Phys. Chem. C, 2018, 122, 10883 CrossRef CAS.
- G. Gómez, P. G. Belelli, G. F. Cabeza and N. J. Castellani, Appl. Surf. Sci., 2015, 353, 820 CrossRef.
- F. Vigné, J. Haubrich, D. Loffreda, P. Sautet and F. Delbecq, J. Catal., 2010, 275, 129 CrossRef.
- G. Gómez, P. G. Belelli, G. F. Cabeza and N. J. Castellani, J. Mol. Catal. A: Chem., 2014, 394, 151 CrossRef.
- D. Liu, H. Y. Chen, J. Y. Zhang, J. Y. Huang, Y. M. Li and Q. M. Peng, Appl. Surf. Sci., 2018, 456, 59 CrossRef CAS.
- C. Hu, J. Sun, Y. Yang, Q. Zhu and B. Yu, Catal. Sci. Technol., 2017, 7, 5932 RSC.
- S. J. Clark, M. D. Segall, C. J. Pickard, P. J. Hasnip, M. J. Probert, K. Refson and M. C. Payne, Z. Kristallogr., 2005, 220, 567 CAS.
- D. Vanderbilt, Phys. Rev. B: Condens. Matter Mater. Phys., 1990, 41, 7892 CrossRef PubMed.
- J. P. Perdew, K. Burke and M. Ernzerhof, Phys. Rev. Lett., 1996, 77, 3865 CrossRef CAS PubMed.
- T. A. Halgren and W. N. Lipscomb, Chem. Phys. Lett., 1977, 49, 225 CrossRef CAS.
- X.-F. Yang, A.-Q. Wang, Y.-L. Wang, T. Zhang and J. Li, J. Phys. Chem. C, 2010, 114, 3131 CrossRef CAS.
- E. Castillejos-López, G. Agostini, M. D. Michel, A. Iglesias-Juez and B. Bachiller-Baeza, ACS Catal., 2017, 7, 796 CrossRef.
- C. Yoon, M. X. Yang and G. A. Somorjai, J. Catal., 1998, 176, 35 CrossRef CAS.
- J. P. Boitiaux, J. Cosyns and E. Robert, Appl. Catal., 1987, 35, 193 CrossRef CAS.
- I. Lee and F. Zaera, J. Phys. Chem. C, 2007, 111, 10062 CrossRef CAS.
- Z. Wu, Z. Hao, P. Ying, C. Li and Q. Xin, J. Phys. Chem. B, 2000, 104, 12275 CrossRef CAS.
- C. Yoon, M. X. Yang and G. A. Somorjai, Catal. Lett., 1997, 46, 37 CrossRef CAS.
- P. Légaré, Surf. Sci., 2004, 559, 169 CrossRef.
- S. K. Jo, Surf. Sci., 2015, 635, 99 CrossRef CAS.
- J. Li, P. Fleurat-Lessard, F. Zaera and F. Delbecq, J. Catal., 2014, 311, 190 CrossRef CAS.
- A. Ruban, B. Hammer, P. Stoltze, H. L. Skriver and J. K. Nørskov, J. Mol. Catal. A: Chem., 1997, 115, 421 CrossRef CAS.
- D. A. Barskiy, K. V. Kovtunov, A. Primo, A. Corma, R. Kaptein and I. V. Koptyug, ChemCatChem, 2012, 4, 2031 CrossRef CAS.
- K. V. Kovtunov, D. Burueva, L. Kovtunova, V. Bukhtiyarov and I. V. Koptyug, Chem. – Eur. J., 2019, 25, 1420 CrossRef PubMed.
- K. V. Kovtunov, V. V. Zhivonitko, I. V. Skovpin, D. A. Barskiy and I. V. Koptyug, Top. Curr. Chem., 2012, 338, 123 CrossRef PubMed.
- C. Hu, S.-W. Ting, K.-Y. Chan and W. Huang, Int. J. Hydrogen Energy, 2012, 37, 15956 CrossRef CAS.
- Y. Ji, V. Koot, A. M. J. van der Eerden, B. M. Weckhuysen, D. C. Koningsberger and D. E. Ramaker, J. Catal., 2007, 245, 415 CrossRef CAS.
Footnote |
| † Electronic supplementary information (ESI) available. See DOI: 10.1039/c9re00371a |
| This journal is © The Royal Society of Chemistry 2020 |