A computational approach for the selection of optimal catalyst shape for solid-catalysed gas-phase reactions†
Karthik
G. M.‡
 and
Vivek V.
Buwa
 *
*
Department of Chemical Engineering, Indian Institute of Technology Delhi, New Delhi 110016, India. E-mail: vvbuwa@iitd.ac.in
First published on 13th November 2019
Abstract
Particle-resolved CFD simulations are performed for four industrially important solid-catalysed gas-phase reactions (methane steam reforming (MSR), water–gas shift (WGS), and methanol (MeOH) and DME synthesis) in a fixed-bed reactor. The effect of particle shape is investigated using internally and externally-shaped particles. Preliminary analysis with cylindrical particles showed higher diffusion limitation for the MSR and DME synthesis compared to the WGS and MeOH reactions. Due to a shorter diffusion length for particles with a higher surface area, a higher effectiveness factor and conversion were observed. The increase in conversion with the particle surface area correlated well with the extent of mass transfer limitation for different reactions. The 7-hole cylinder for the MSR, WGS and DME reactions and the hollow cylinder for the MeOH reaction showed the highest conversion. The conversion/ΔP decreased after a certain particle surface area due to a higher increase in ΔP compared to that in conversion. The cylcut shape for the MSR and DME and the daisy shape for the WGS and MeOH were optimal for the overall reactor efficiency.
1. Introduction
Several industrial solid-catalysed gas-phase reactions (e.g., MSR, WGS, MeOH and DME syntheses, etc.) are carried out in packed bed reactors (PBRs). Since the temperature and species distribution inside the PBRs often governs the reaction performance, a high particle surface-to-volume (STV) ratio offered by a large number of catalyst particles randomly packed inside these beds helps to transport heat and species efficiently to or from the particles due to shorter diffusion lengths. The most common particle shapes are spheres and cylinders, but more complex particle shapes with different types of internal or external voids are also used due to the high STV ratio offered by these particles. Since the particle shape defines the external surface area and interstitial voids around the particles, the particle shape will have a considerable influence on the local transport processes and therefore the PBR performance. Hence, a fundamental understanding of the effect of particle shape on the PBR performance is crucial for improving the overall efficiency of the reactor.Typically, the PBR performance is predicted by using lower-order models (for example, ref. 1 and 2) that are developed using several assumptions/simplifications. In particular, these models do not account for the local flow inhomogeneities and thereby, assuming a uniform distribution of temperature and species, are often used with standard particle shapes (spheres or cylinders) and simplified reactions for the computation of effectiveness factor. This approach poses serious challenges in the evaluation of heat and mass transfer limitations for multiple reactions and in particular for complex non-standard particle shapes. Therefore, the present lower-order models cannot be used to evaluate the particle shape effects on the PBR performance.
On the other hand, particle-resolved CFD simulations are widely used to obtain detailed information on the local transport processes due to their inherent ability to account for the local flow inhomogeneities and thereby aid in the understanding of the PBR performance (for example, ref. 3–6). In spite of computational limitations on the size of the PBR that can be studied using this approach, these simulations provide meaningful information to link the particle-shape effects to the PBR performance, which is otherwise not feasible. Due to these reasons, the particle-resolved CFD simulation is chosen as the computational approach in the present work. Therefore, only the literature reporting particle-resolved CFD simulations accompanied by heat effects and reactions is reviewed here.
In the past, reactions in particle-resolved simulations were defined as only surface reactions on particle surfaces.7 Afterwards, the porous-media approach was utilised in which the particles were treated as the porous medium with a specified porosity to model the diffusion and reactions inside the particles.8–10 However, this model has serious limitations in restricting the convective flux across the fluid–particle interface, thereby leading to over-prediction of reaction performance. Later, the solid-particle model was developed in which the particles were treated as a solid (to avoid convective flux) and the user-defined scalars were used to model the diffusion and reaction inside the particles.11 This approach leads to a more realistic scenario of allowing only the diffusion transport phenomena to occur near the fluid–particle interface. Therefore, the solid-particle model is used in the present work to model reactions inside the particles.
The reaction kinetics can be defined using two different approaches, namely micro-kinetics and macro-kinetics. The micro-kinetics model is based on the surface reactions taking place on the particle surfaces (both particle-scale and pore-scale) whereas the macro-kinetics model is based on the volumetric reactions occurring within the particle volume. Literature studies have reported particle-resolved CFD simulations with reaction kinetics incorporated through macro-kinetics (for example, ref. 3, 12 and 13) or micro-kinetics (for example, ref. 4, 14 and 15) approaches. In the present work, the macro-kinetics approach is used. In addition, it is possible to model the catalyst deactivation due to carbon formation in the particle-resolved CFD simulations.16,17 However, since it was investigated as a part of our previous work,17 it is not considered in the present work.
Validation of particle-resolved CFD simulations is very challenging due to the difficulties in obtaining detailed experimental measurements under reaction conditions. Despite this, a few literature studies have reported the experimental validation of particle-resolved CFD simulation under reaction conditions for reforming reactions,18,19 oxidation reactions13,20 and coke conversion,21 reporting a good agreement. In addition, a few validation studies1,2,22 have been performed for the particle-resolved CFD simulation using lower-order models of different reactions (e.g., methane steam reforming, char conversion), showing reasonable agreement, and it was reported that the observed deviations were due to the limitations of the lower-order models. Therefore, the particle-resolved CFD simulation can be used with confidence to understand the PBR performance.
One of the major challenges in particle-resolved CFD simulations is the generation of random packing of particles. The most commonly used discrete element method (DEM) based generation of random packing of particles with reasonable computational effort is limited to simple convex particle shapes like spheres (for example, ref. 23) and cylinders (for example, ref. 24). In recent years, rigid body dynamics (RBD) simulations have been utilised to generate random packing of complex particle shapes.15 However, the corresponding particle-resolved CFD simulations of random packing of complex particle shapes are still limited due to difficulties in the treatment of particle–particle contact points for meshing25 and computational limitations due to the requirement of a large number of mesh elements to capture the intricate details of the complex particle shapes. Therefore, only a small (yet reasonable) number of particles with complex shapes and global treatment of contact points (shrinking of particle volume) have been considered in the present work.
Most of the literature studies on particle-resolved CFD simulations with reactions have used spherical or cylindrical particles. Besides that, very few studies have been performed with complex particle shapes like a cylinder with an internal hole(s). A couple of studies have reported the use of 1-hole cylindrical particles for the demonstration of particle-resolved CFD simulations with reactions.4,13,16 Prof. Dixon and co-workers have used cylinders with different numbers of internal holes (1-, 2-, 3- and 4-hole) as particle shapes in their work to understand their impact on the PBR performance majorly for the methane steam reforming reactions.3,15,18 Apart from these studies, the effects of particle features like external shape and/or internal voids on the PBR performance have not been explored. Even though various particle shapes are used for different reactions, there is a lack of information on the choice of optimal catalyst shape for a particular reaction in the open literature.
In our earlier studies,10,12 the effects of five different particle shapes having internal (hollow, cylcut and 7-hole) and external voids (trilobe and daisy) on the PBR performance were investigated for the methane steam reforming reactions. These studies have shown a significant influence of the particle shape on the local transport processes and thus the PBR performance. However, these studies were limited only to the methane steam reforming reactions. While different particle shapes are used for different gas-phase catalytic reactions, specific reasons or analysis on why a particular particle shape performs better for a particular reaction is not available in the open literature. Therefore, it is important to understand the effect of particle shape for different gas-phase catalytic reactions. It is also important to establish a quantitative relationship between different types of reactions (with varying degrees of heat/mass transport limitations) with the underlying particle shape.
Therefore, the main objectives of this work are (a) to demonstrate a computational approach based on particle-resolved CFD simulations for the selection of the optimal particle shape for a particular reaction and (b) to establish a quantitative relationship between the particle shapes and different reactions with varying extents of mass-transfer limitation. The computational approach presented here can be extended to any other particle shape and reactions for the selection of optimal particle shape to improve the overall efficiency of processes.
2. Methodology
The flow inside the PBRs used for gas-phase catalytic reactions is typically turbulent. Therefore, simulations were performed for a tube Reynolds number (Ret = ρUsdt/μ, where dt is the tube diameter, Us is the superficial fluid velocity, and ρ and μ are fluid density and viscosity, respectively) of 50![[thin space (1/6-em)]](https://www.rsc.org/images/entities/char_2009.gif) 000 in the present work to represent the industrial operating conditions. Literature reports26 showed that turbulent flow exists inside the packed bed for particle Reynolds number (Rep = ρUsdp/μ, where dp is the particle diameter) > 300. Based on this information, the Ret of 50
000 in the present work to represent the industrial operating conditions. Literature reports26 showed that turbulent flow exists inside the packed bed for particle Reynolds number (Rep = ρUsdp/μ, where dp is the particle diameter) > 300. Based on this information, the Ret of 50![[thin space (1/6-em)]](https://www.rsc.org/images/entities/char_2009.gif) 000 (or Rep of 10
000 (or Rep of 10![[thin space (1/6-em)]](https://www.rsc.org/images/entities/char_2009.gif) 000) falls under the turbulent flow regime.
000) falls under the turbulent flow regime.
The solid-particle model11 was used to model the fluid flow, heat transfer and chemical reactions inside the packed bed. A detailed description of the governing equations for the fluid domain and particle domain used in the solid-particle model is presented in our earlier work.12 Therefore, only a brief description of the model equations is presented here for ready reference and the readers are suggested to refer to our earlier work12 for a complete description of the model equations.
2.1. Governing equations
The Reynolds-averaged mass and momentum conservation equations as given below were solved for the fluid domain to model the turbulent flow around the particle domain inside the packed bed. | (1) |
 | (2) |
The turbulent stress tensor  for a Newtonian fluid was modeled using the Boussinesq approximation as follows:
 | (3) |
The Reynolds-averaged convection–diffusion energy conservation equation was solved in the fluid domain. Due to the absence of convection, only the diffusion energy conservation equation was solved in the particle domain. The heat flux across the fluid and particle domains was conserved by enforcing flux continuity boundary conditions (Jheat,fluid = Jheat,particle, where Jheat is the heat flux) at the fluid–particle interface. In the fluid domain, the Reynolds-averaged energy conservation equation as given below was solved.
 | (4) |
In eqn (4),  is the thermal conductivity due to turbulent transport, where
  is the specific heat capacity and Prt is the turbulent Prandtl number for the fluid phase (taken as 0.9 for the present work28). In the particle domain, the energy conservation equation as given below was solved.
 | (5) |
In eqn (5), λs,eff = λs(1 − εs) + λεs is the effective thermal conductivity of the particle phase, where λs is the thermal conductivity of the particle phase and εs is the particle porosity (taken as 0.5 in the present work8).  is the heat source due to chemical reactions in the particle phase, where rj and ΔHj are the reaction rate and the heat of reaction for jth reaction, respectively.
Due to the CFX solver limitations, the species transport equations could not be solved in the particle domain in situations where the coupling of fluid and particle domains is desired. To address this issue, the solid-particle model11 was used in which diffusion scalar transport equations for n − 1 species  are solved in the particle domain. The solver still solves the standard convection–diffusion species transport equations for n − 1 species in the fluid domain. The species fluxes from both the fluid and particle domains were coupled by enforcing flux continuity boundary conditions (Ji,fluid = Ji,particle, where Ji is the species flux) at the fluid–particle interface. In the fluid domain, the Reynolds-averaged scalar transport equation representing species mass fraction was solved as:
 | (6) |
The expressions used for the computation of Di are presented in the supplementary information of our previous work.12Dt,i = μt/Sct,i is the turbulent diffusivity, where Sct,i is the turbulent Schmidt number for the ith species in the fluid phase (taken as 0.9 in the present work28). In the particle domain, the scalar transport equations representing species mass fraction in the particle domain were solved as:
 | (7) |
In eqn (7),  is the effective diffusivity of the ith species in the particle phase, where τs is the particle tortuosity (taken as 5.0 in the present work29), and Ds,i and DK,i are the molecular diffusivity and Knudsen diffusivity in the particle phase, respectively. The model equations for the diffusivities are provided in the supplementary information of our previous work.12 While a more comprehensive Maxwell–Stefan diffusion model is used in recent studies,30 a simple and widely used Fickian diffusion model was used in the present work.
  is the rate of species formation or consumption by chemical reaction for species i in the particle phase, where αij represents the stoichiometric coefficient of component i in reaction j and Mi is the molecular weight of species i.
2.2. Reactions
Four industrially important gas-phase catalytic reactions, namely, methane steam reforming (MSR), water–gas shift (WGS), methanol synthesis (MeOH) and dimethyl ether synthesis (DME), were considered in the present work. The kinetic models for the different reactions were taken from the literature. A detailed description of the reaction rates and rate constant expressions for the different reactions are provided in the ESI.† The chemical reactions considered in the kinetic model for the different reactions are presented below.| CH4 + H2O ↔ CO + 3H2 ΔH1 = +206.1 [kJ mol−1] | (8) |
| CO + H2O ↔ CO2 + H2 ΔH2 = −41.1 [kJ mol−1] | (9) |
| CH4 + 2H2O ↔ CO2 + 4H2 ΔH3 = +165.0 [kJ mol−1] | (10) |
| CO + H2O ↔ CO2 + H2 ΔH = −41.1 [kJ mol−1] | (11) |
| CO + 2H2 ↔ CH3OH ΔH1 = −91.0 [kJ mol−1] | (12) |
| CO2 + H2 ↔ CO + H2O ΔH2 = +41.1 [kJ mol−1] | (13) |
| CO2 + 3H2 ↔ CH3OH + H2O ΔH2 = −49.5 [kJ mol−1] | (14) |
| CO + 2H2 ↔ CH3OH ΔH1 = −91.0 [kJ mol−1] | (15) |
| CO2 + 3H2 ↔ CH3OH + H2O ΔH2 = −49.5 [kJ mol−1] | (16) |
| 2CH3OH ↔ CH3OCH3 + H2O ΔH3 = −23.4 [kJ mol−1] | (17) |
2.3. Geometry
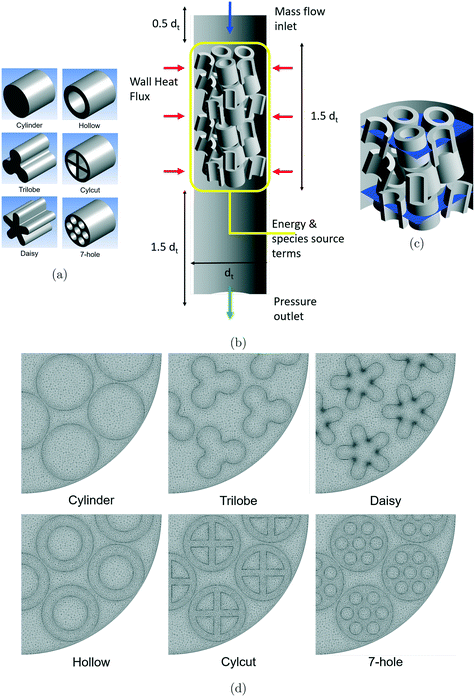
Five different particle shapes having the same outer dimensions of the corresponding cylindrical particle shape (with an aspect ratio of 1) were considered in the present work to understand the effect of particle shape on the different reactions (see Fig. 1(a)). The cylindrical particle shape was used as the reference particle shape to understand the differences among the different reactions. The five different particle shapes were created with the same particle volume (60% of the particle volume of the reference cylindrical particle) for a rational comparison among the particle shapes. Trilobe- and daisy-shaped particles were formed with external voids, whereas hollow cylinder-, cylcut- and 7-hole cylinder-shaped particles were formed with internal voids. Even though the particle volumes remained constant for the different particle shapes, there are significant differences in the particle surface area depending on the particle shape and the bed void structure. It was observed that the externally-shaped particles offered lower surface areas compared to the internally-shaped particles. Please note that the term particle surface area or surface area denotes the geometric surface area of a particle in the entire manuscript.Even though different reactions use different sizes of tubes and particle shapes/sizes depending on the operating conditions, it was assumed that all the reactions would have the same tube and particle size in the present work as the main focus of the analysis is to understand the effect of particle shape on the different reactions. The CFD model consists of a cylindrical tube (dt = 100 mm) filled with particles (dp = 20 mm) leading to a packed bed with a tube-to-particle diameter ratio of 5. These dimensions are comparable to those of an industrial tubular reactor (e.g., MSR). However, only a 90° section of the cylindrical tube was considered with symmetry assumptions to reduce the computational effort as modelling the flow around the complex particle shapes considered in the present work is quite expensive in terms of computational cost.
As discussed earlier, the particle-resolved CFD simulations of random packing of complex particle shapes continue to be challenging due to meshing difficulties25 and computational limitations. In addition, the requirement of maintaining the same packing arrangement for different particle shapes in order to make a rational comparison also limits the use of random packing of particles. For these reasons, manual packing of particles was performed in the present work with reasonable variation in each particle position (r, z) and orientation (r, θ). Based on this approach, a representative block containing 15 particles in 3 different layers with a height of 75 mm was created.
In our earlier work,12 the effect of packed bed height on the flow predictions was investigated. From the analysis, it was observed that a packed bed containing two representative blocks with six layers of particles was found to be sufficient as a further increase in the bed height did not change the results significantly. Therefore, a final packing arrangement containing two representative blocks with a total bed height of 150 mm with free space above and below the bed to capture the entrance and exit effects were considered in the present work (see Fig. 1(b)). The final packing arrangement led to a mean bed porosity of 0.5 for cylindrical particles and a mean bed porosity of 0.7 for the other particle shapes considered in the present work.
2.4. Meshing
One of the major challenges associated with the generation of a good quality mesh for a packed bed geometry is the treatment of particle–particle and particle–wall contact points. Literature studies35,36 have shown that a modification to particle volume (shrink by 0.5%, defined as gaps) can lead to a good quality mesh without any significant influence on the predicted results. Therefore, the particle volumes were shrunk by 0.5% based on the gap approach to ease the meshing process around the contact points in the present work.In addition, the requirement to capture the intricate details of the complex particle shapes considered in the present work and to use a fine mesh near the wall region puts a constraint on the total number of mesh elements. A fine mesh (y+ ∼ 1) near the wall region is essential for the accurate prediction of the boundary layer flow by the SST k–ω turbulence model used in the present work. To meet this requirement, the first layer thickness was adjusted based on the criteria of y+ ∼ 1 and five layers of boundary elements were added on all the wall surfaces to resolve the boundary layer adequately. For capturing the finer details of the complex particle shapes with a good quality mesh, local face controls were used for generating a mesh on the complex particle surfaces.
In our earlier studies,17,37 a mesh sensitivity analysis was performed for a bed packed with cylindrical particles using three different mesh resolutions, namely, medium, fine and very fine mesh. The analysis showed that the differences in the overall predictions were much smaller between the fine and very fine meshes. Therefore, the very fine mesh settings were chosen for the different particle shapes considered in the present work that led to the total number of mesh elements in the range of 14.3–30.6 million (see Fig. 1(c)) depending on the particle shape (lowest and highest being the cylinder- and daisy-shaped particles, respectively). To the best of the authors' knowledge, the maximum number of mesh elements per particle used in the present work (∼1 million per particle) is at least 2–3 times higher compared to those in similar studies reported in the literature (for example, ref. 4, 13 and 15).
2.5. Boundary conditions
The boundary conditions used in the CFD model were mass flow inlet based on a Ret of 50![[thin space (1/6-em)]](https://www.rsc.org/images/entities/char_2009.gif) 000 and pressure outlet for all the reactions. Also, a constant wall heat flux (source or sink) was defined on the tube wall to supply (or remove) heat to (or from) the packed bed from (or to) the tube wall depending on the reactions as discussed below. Even though the heat flux varies along the length of the tube in reality due to reaction heat effects, the assumption of a constant heat flux considered in the present work should be reasonable as the length of the packed bed is relatively small.
000 and pressure outlet for all the reactions. Also, a constant wall heat flux (source or sink) was defined on the tube wall to supply (or remove) heat to (or from) the packed bed from (or to) the tube wall depending on the reactions as discussed below. Even though the heat flux varies along the length of the tube in reality due to reaction heat effects, the assumption of a constant heat flux considered in the present work should be reasonable as the length of the packed bed is relatively small.
Typical operating conditions for the different reactions were taken from the literature (see Table 1). The physical properties of the particle phase were based on alumina material properties (ρs = 1947 kg m−3, Cp,s = 1000 J kg−1 K−1) and were taken from the literature.27
| Parameter | Unit | MSR3 | WGS38 | MeOH39 | DME40 |
|---|---|---|---|---|---|
| Temperature | [°C] | 551 | 175 | 250 | 250 |
| Pressure | [kPa] | 2159 | 2159 | 5000 | 5000 |
| CH4 | [mole%] | 23.89 | — | — | — |
| H2 | [mole%] | 0.05 | 26.00 | 66.51 | 73.89 |
| CO | [mole%] | 7.76 | 3.00 | 29.70 | 17.88 |
| CO2 | [mole%] | 0.48 | 30.00 | 2.08 | 6.88 |
| H2O | [mole%] | 67.81 | 13.00 | 0.01 | 0.01 |
| N2 | [mole%] | — | 28.00 | — | — |
| Ar | [mole%] | — | — | 1.62 | 1.34 |
| CH3OH | [mole%] | — | — | 0.08 | 0.00 |
| CH3OCH3 | [mole%] | — | — | — | 0.00 |
| ρ in | [kg m−3] | 6.15 | 11.41 | 10.35 | 9.26 |
| U s,in | [m s−1] | 2.44 | 0.92 | 1.01 | 1.13 |
The conservation equations of mass, momentum, energy and species were solved using the finite volume method based commercial code ANSYS CFX 18.2. A pressure-based coupled solver was used to solve the conservation equations simultaneously. The Rhie and Chow algorithm was used for the pressure–velocity coupling and second-order difference schemes were used for the discretisation of convection and diffusion terms. The calculations were run for several hundred iterations to meet the convergence criteria of imbalances and residuals of the conserved quantities being below 0.1% and 1 × 10⁻⁶, respectively. The simulations were performed using a high-performance computing (HPC) cluster with 128 CPU-cores.
3. Results & discussion
3.1. Preliminary analysis with the cylindrical particles
Preliminary investigations were performed with the cylindrical particles to understand the reactor performance in terms of the pressure drop, heat transfer, reactant conversion and effectiveness factor for the different reactions considered in the present work. These investigations were essential to estimate the extent of mass transfer limitation based on the kinetics and diffusion inside the particles for the different reactions.A comparison of the predicted pressure drop for the different reactions is shown in Fig. 2(a). In spite of having the same packed bed geometry and operating at the same Ret of 50![[thin space (1/6-em)]](https://www.rsc.org/images/entities/char_2009.gif) 000, the MSR reactions showed the highest pressure drop whereas the values were comparable among the WGS, MeOH and DME reactions. This is mainly attributed to the differences in the physical properties of the reactant gases in the different reactions. Even though the viscosities were comparable, the densities (ρ = PM/RT) showed considerable variations due to the differences in the molecular mass (M, a function of gas composition), temperature and pressure for the different reactions. As a result, the cross-sectional velocities (U = m/ρA) are different for the different reactions. A higher cross-sectional velocity led to a higher pressure drop for the MSR reactions compared to the other reactions.
000, the MSR reactions showed the highest pressure drop whereas the values were comparable among the WGS, MeOH and DME reactions. This is mainly attributed to the differences in the physical properties of the reactant gases in the different reactions. Even though the viscosities were comparable, the densities (ρ = PM/RT) showed considerable variations due to the differences in the molecular mass (M, a function of gas composition), temperature and pressure for the different reactions. As a result, the cross-sectional velocities (U = m/ρA) are different for the different reactions. A higher cross-sectional velocity led to a higher pressure drop for the MSR reactions compared to the other reactions.
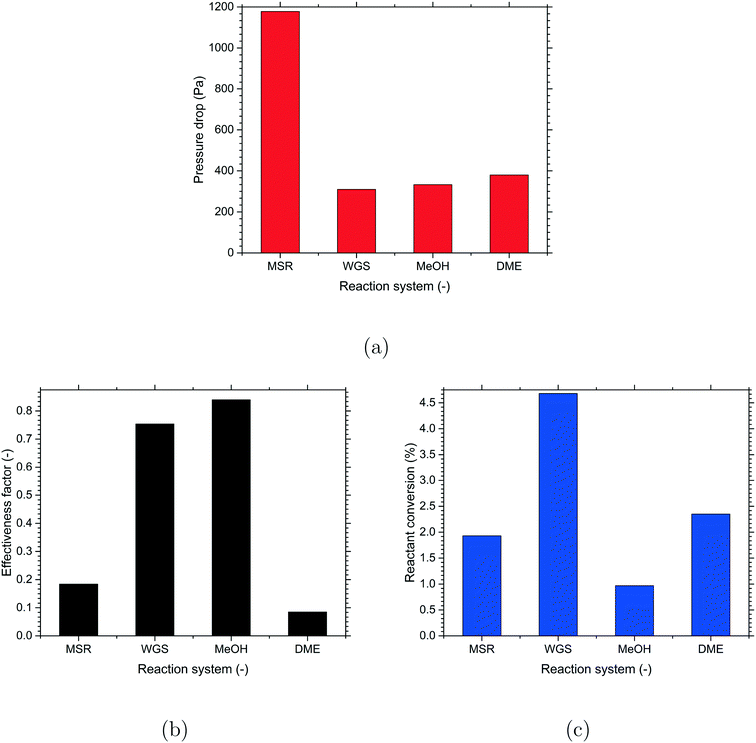 | ||
| Fig. 2 Performance of the different reactions with the cylindrical particle shape: (a) pressure drop, (b) effectiveness factor for the reaction (MSR – eqn (8), WGS – eqn (11), MeOH – eqn (12), DME – eqn (15)) and (c) reactant (MSR – CH4, WGS – CO, MeOH – CO, DME – CO) conversion. | ||
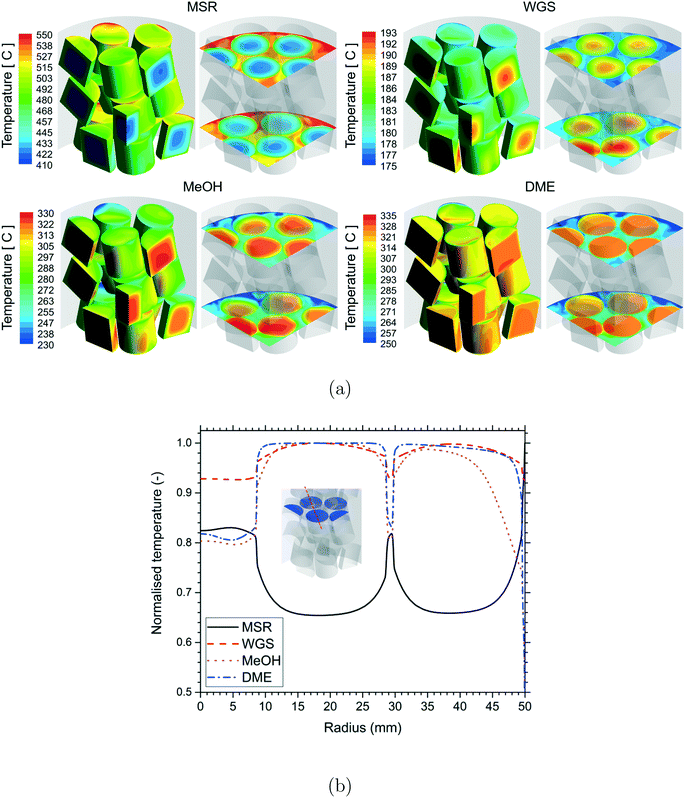
A qualitative comparison of the temperature distribution on the particle surfaces, a couple of r–θ planes in the bottom three layers of the bed and reference line for the different reactions are shown in Fig. 3. Owing to the different reaction conditions, it should be noted that the scales used for the different reactions are different. The temperature inside the particles was lower for the MSR reactions due to heat consumption by the endothermic reactions. A higher temperature was observed inside the particles for the WGS, MeOH and DME reactions due to heat released by the exothermic reactions. Strong gradients of temperature were observed near the fluid–particle interface for the MSR reactions, whereas the temperature gradients were considerably less for the WGS and MeOH reactions. Similar to those for the MSR reactions, the temperature gradients were strong near the fluid–particle interface for the DME reactions and also relatively more for the particles in close proximity to the wall heat flux.
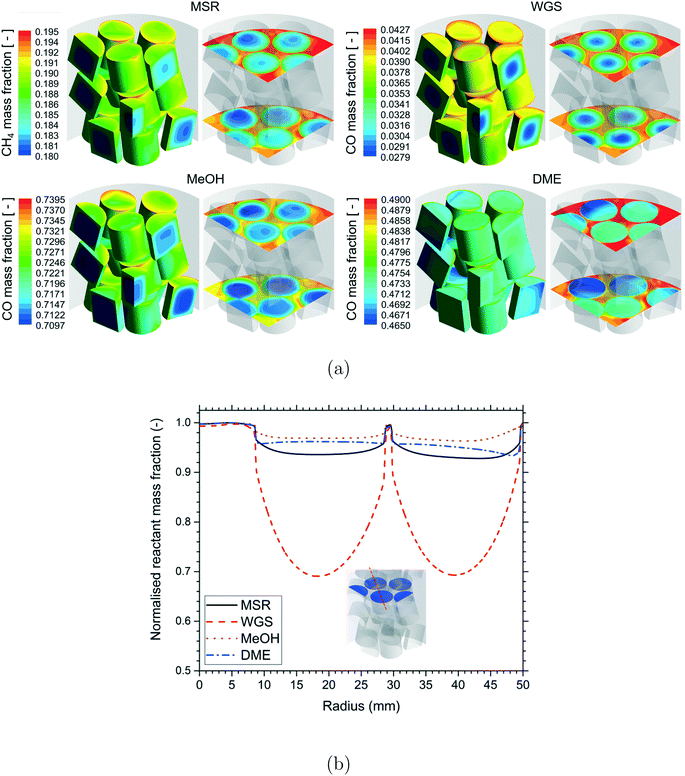
A qualitative comparison of the reactant mass fraction distribution on the particle surfaces, a couple of r–θ planes in the bottom three layers of the bed and reference line for the different reactions are shown in Fig. 4. The readers should note the differences in the reactant components (MSR – CH4, WGS – CO, MeOH – CO, DME – CO) and the scales used for the different reactions. Irrespective of the reactions, the reactant mass fraction values inside the particles were lower compared to those on the particle surfaces due to the consumption of the reactant by the chemical reactions. Similar to the temperature distribution, strong gradients of reactant mass fraction existed near the fluid–particle interface for the MSR and DME reactions, whereas the reactant mass fraction gradients were relatively less for the WGS and MeOH reactions. This indicated the presence of relatively higher mass transfer limitations for the MSR and DME reactions compared to the WGS and MeOH reactions.
A qualitative comparison of the product mass fraction distribution on the particle surfaces, a couple of r–θ planes in the bottom three layers of the bed and reference lines for the different reactions are shown in Fig. 5. The readers should note the differences in the product components (MSR – H2, WGS – H2, MeOH – MeOH, DME – DME) and the scales used for the different reactions. For all the reactions, the product mass fraction values inside the particles were higher compared to those on the particle surfaces due to the formation of the product by the chemical reactions. The product mass fraction gradients near the fluid–particle interface also showed behaviour similar to those of the corresponding reactant mass fraction for the different reactions.
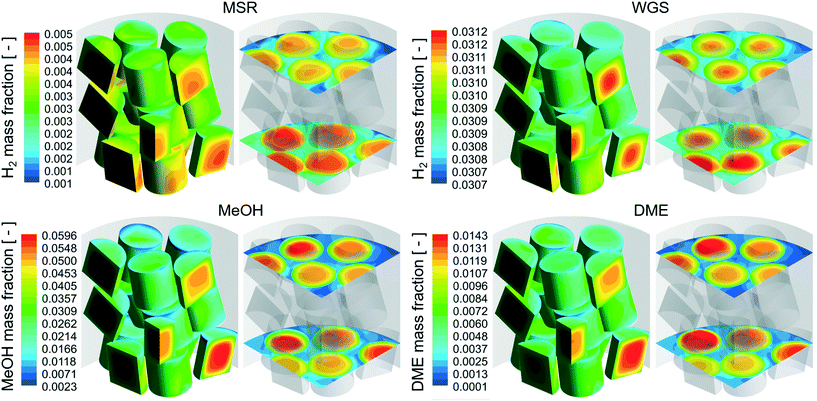 | ||
| Fig. 5 Product (MSR – H2, WGS – H2, MeOH – MeOH, DME – DME) mass fraction distribution on the r–θ planes and particle surfaces for the different reactions with cylindrical particles. | ||
To quantify the extent of mass transfer limitation in the different reactions, the effectiveness factor was estimated for the most dominant reaction in a particular reaction system. The effectiveness factor is defined as the ratio of the reaction rate based on the particle interior conditions to the reaction rate corresponding to the particle surface conditions. In the present work, the reaction rate in the particle interior (numerator of eqn (18)) was calculated by volume-averaging the reaction rate in each cell inside the particle and the reaction rate on the particle surface (denominator of eqn (18)) was determined by area-averaging the reaction rate in each cell on the particle surface as shown below:
 | (18) |
The effectiveness factor for the most dominant reaction in the different reactions (MSR – eqn (8), WGS – eqn (11), MeOH – eqn (12), DME – eqn (15)) is shown in Fig. 2(b). A higher effectiveness factor indicates lower mass transfer limitation and similarly, a lower effectiveness factor indicates higher mass transfer limitation. From the results, it can be seen that the values of effectiveness factor were higher for the WGS and MeOH reactions pointing to lesser mass transfer limitation compared to the MSR and DME reactions which have lower values of effectiveness factor.
The reactant conversion (MSR – CH4, WGS – CO, MeOH – CO, DME – CO) is an important parameter to understand the impact of the effectiveness factor on the reaction performance for the different reactions. The reactant conversion is defined as the ratio of the net change in the mass flow of the limiting reactant (MSR – CH4, WGS – CO, MeOH – CO, DME – CO) from the inlet to the outlet to the mass flow of that species at the inlet for a particular reaction. A comparison of the normalised reactant conversion is shown in Fig. 2(c). In spite of having the same catalyst volume, a considerable variation in the reactant conversion was observed for the different reactions. This is mainly due to the differences in the operating conditions (T, P, Ci) and reaction kinetics (rate constant, the order of reaction) for the different reactions. Overall, the WGS and MeOH reactions gave the highest and lowest values of reactant conversion, respectively, and the reactant conversion was comparable between the MSR and DME reactions.
The present investigations showed a considerable variation in the effectiveness factor and reactant conversion due to differences in the mass transfer limitation among the different reactions. Therefore, the chosen reactions are good representations of the different extents of mass transfer limitation inside the particles to demonstrate the computational methodology for the selection of optimal catalyst shape for a particular reaction.
3.2. Effect of particle shape
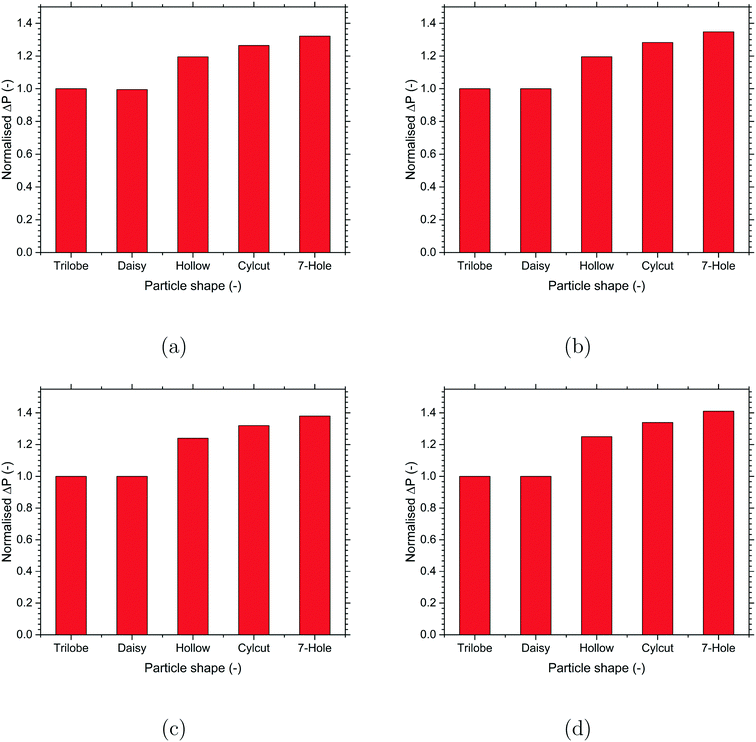
Numerical investigations were performed to understand the effect of different particle shapes on the reaction performance for a particular reaction system. The main objective is to identify the optimal particle shape for the key performance parameters of the packed bed reactor like pressure drop and reactant conversion. Since the reactant conversion is a function of pressure drop, an optimal performance would be achieved by maximising the reactant conversion/pressure drop ratio to improve the overall operating efficiency of the reactor. It should be noted that the absolute differences in the values of the key performance parameters are small due to a relatively small packed bed height considered in the present work due to computational limitations. However, the differences are expected to be much higher in reality as the packed bed height can be up to 2 orders of magnitude higher compared to that used in the present work. The values of all the reported parameters (pressure drop, effectiveness factor and reactant conversion) were normalised to the corresponding values for the trilobe-shaped particles to provide better visualisation of the relative differences among the different particle shapes.A comparison of the effect of particle shape on the pressure drop for the different reactions is shown in Fig. 6. For all the reactions, the pressure drop was found to increase with the particle surface area. Even though the different reactions offered different values of pressure drop, the relative differences among the different particle shapes were comparable among the different reactions. Among the particle shapes, the externally-shaped particles (trilobe and daisy) offered a lower pressure drop compared to the internally-shaped particles (hollow, cylcut and 7-hole). This is because the internal voids in the internally-shaped particles offered higher resistance and thereby created more tortuous paths for the flow compared to the external protrusions in the externally-shaped particles. Overall, the trilobe-particle shape with a lower surface area offered the lowest pressure drop and the 7-hole particle shape with the highest surface area offered the highest pressure drop for all the reactions considered in the present work.
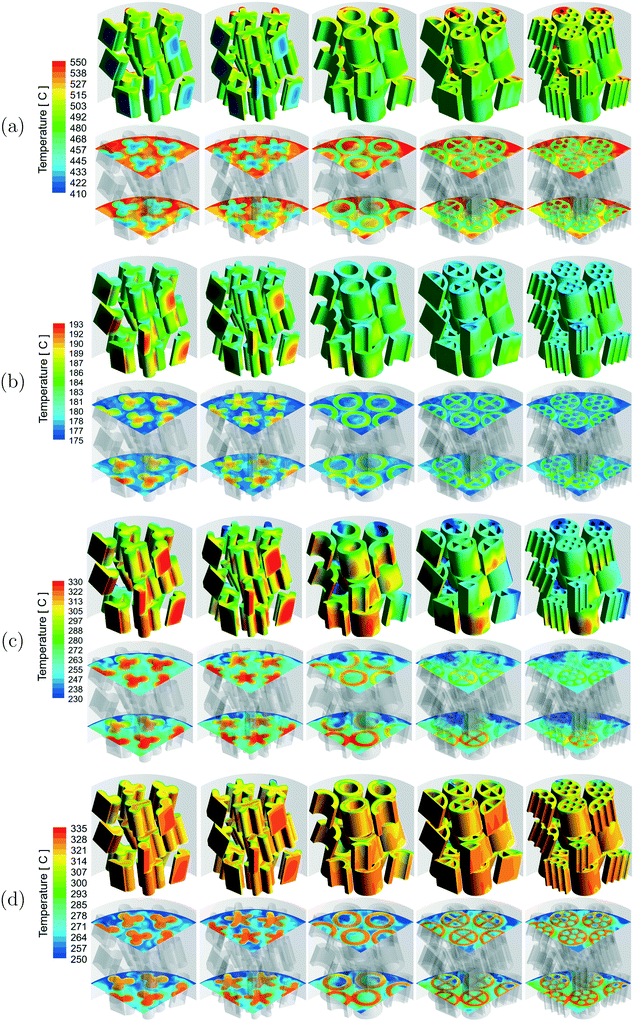
A qualitative comparison of the effect of particle shape on the temperature distribution on the particle surfaces and a couple of r–θ planes in the bottom three layers of the bed for the different reactions is shown in Fig. 7. For the MSR, MeOH and DME reactions, strong gradients of temperature were observed in the particles near the wall region due to the proximity of the heat source (MSR) or sink (MeOH and DME) compared to the particles in the centre of the bed. However, for the WGS reaction, the temperature gradients were stronger in the particles in the centre compared to the particles near the wall region due to the absence of a heat sink from the tube wall. For all the reactions, the intra-particle temperature gradients decreased with an increase in the particle surface area. This is because a higher particle surface area led to a shorter diffusion length inside the particle and thereby provided better access for the reactants to the particle core. Since the extent of mass transfer limitation was higher for the MSR and DME reactions, the effect of particle surface area was more prominent on these reactions compared to that on the WGS and MeOH reactions.
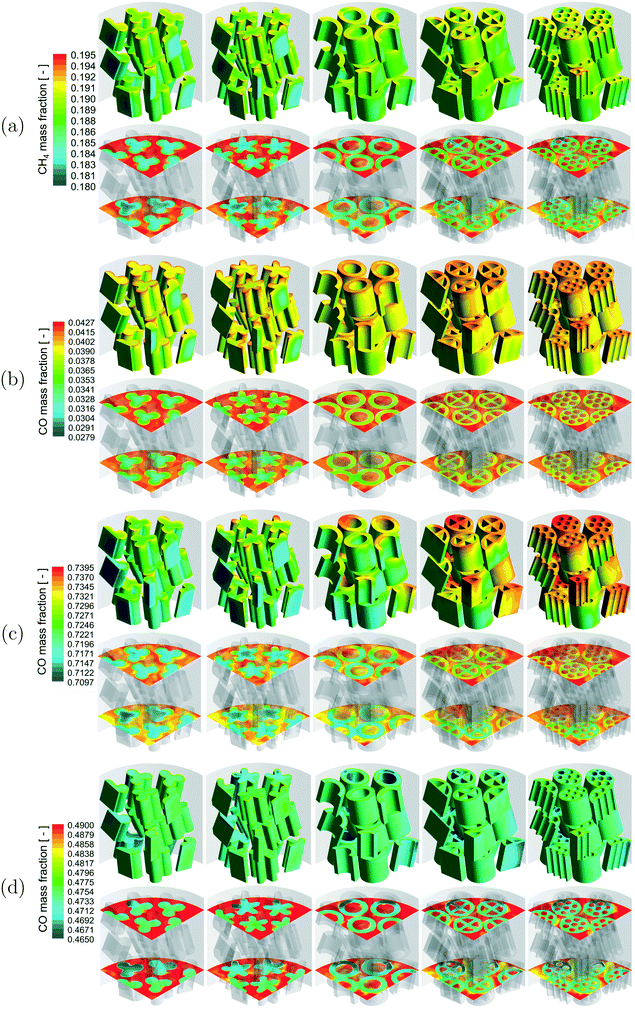
A qualitative comparison of the effect of particle shape on the reactant mass fraction (MSR – CH4, WGS – CO, MeOH – CO, DME – CO) distribution on the particle surfaces and a couple of r–θ planes in the bottom three layers of the bed for the different reactions is shown in Fig. 8. Similar to the temperature distribution, strong gradients of reactant mass fraction were observed in the near-wall particles due to the presence of the heat source (MSR) or sink (MeOH and DME) compared to the particles in the bed centre for the MSR, MeOH and DME reactions. Again, the reactant mass fraction gradients were stronger in the particles in the bed centre compared to the near-wall particles due to the lack of a wall heat sink in the WGS reaction. Apart from that, the intra-particle reactant mass fraction gradients decreased with an increase in the particle surface area for all the reactions. As explained earlier, the reduction in diffusion length due to the increase in the particle surface area led to better utilisation of the particle core for the particles with a higher surface area and thereby higher consumption of reactants. In addition, the effect of particle surface area on the MSR and DME reactions with a higher extent of diffusion limitation led to a relatively higher consumption of reactants by the particles with a higher surface area compared to that on the WGS and MeOH reactions.
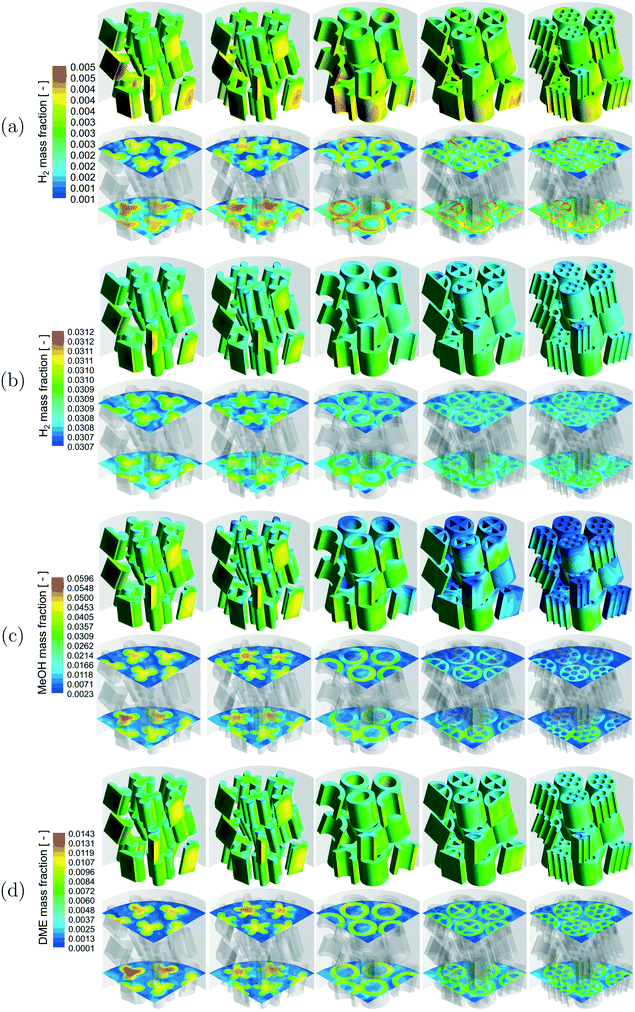
A qualitative comparison of the effect of particle shape on the product mass fraction (MSR – H2, WGS – H2, MeOH – MeOH, DME – DME) distribution on the particle surfaces and a couple of r–θ planes in the bottom three layers of the bed for the different reactions is shown in Fig. 9. The product mass fraction gradients in the near-wall particles and particles in the bed centre showed a trend similar to the reactant mass fraction gradients for all the reactions due to the reasons associated with the wall heat flux described before. Apart from that, the intra-particle product mass fraction gradients decreased with an increase in the particle surface area for all the reactions. This is due to the increased formation of the products by the particles with a higher surface area caused by decreased mass transfer limitation for the reasons mentioned earlier. Similarly, a higher extent of diffusion limitation in the MSR and DME reactions led to a higher formation of products by the particles with a higher surface area compared to that in the WGS and MeOH reactions for the same reasons mentioned earlier.
To quantify the effect of observed differences in the temperature and species (reactants and products) mass fraction distributions among the different particle shapes on the catalyst performance, the effectiveness factor was computed for the most dominant reaction in a particular reaction system (MSR – eqn (8), WGS – eqn (11), MeOH – eqn (12), DME – eqn (15)) for each of the particle shape. A comparison of the effectiveness factor for the different particle shapes for each of the reactions considered in the present work is shown in Fig. 10. For the MeOH reaction, the effectiveness factor was greater than 1 for some of the particle shapes (cylcut and 7-hole) due to a higher temperature at the particle interior compared to the particle surfaces caused by a relatively lower diffusion limitation leading to better access for the reactants to the particle interior and thereby higher heat release by exothermic reactions. As expected, the increase in the particle surface area increased the effectiveness factor due to a decrease in the diffusion limitation for all the reactions. However, the relative change in the values of effectiveness factor with the particle surface area showed considerable differences among the different reactions. The relative change in the values is the highest for the DME reaction and the lowest for the WGS reaction, which correlated well with the highest and lowest extent of mass transfer limitation for the DME and WGS reactions, respectively. This indicates that the increase in the particle surface is more beneficial for the reactions having a higher extent of diffusion limitation. Overall, the trilobe and 7-hole particle shapes with the lowest and highest particle surface areas offered the lowest and highest effectiveness factors, respectively, for all the reactions.
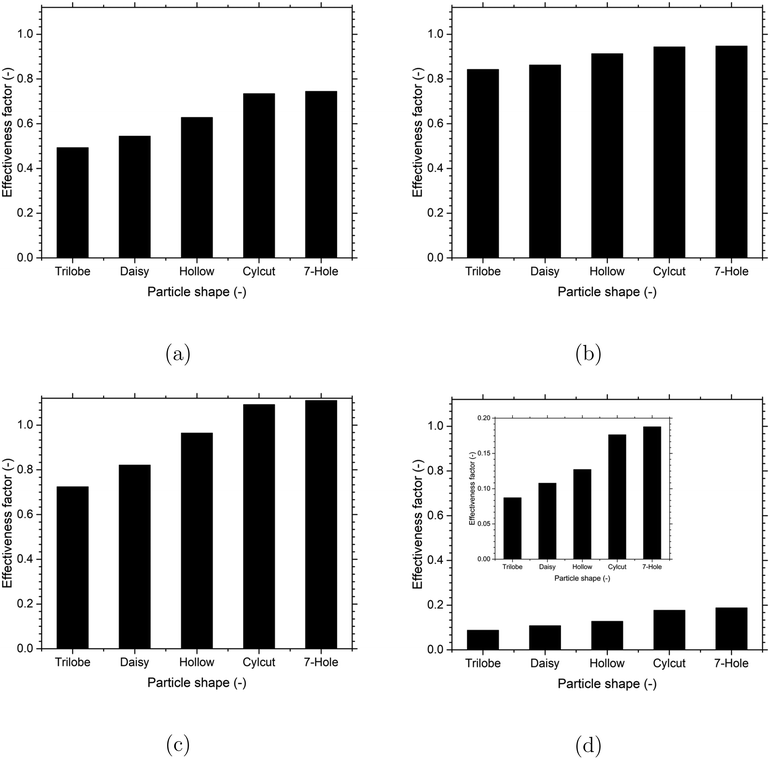 | ||
| Fig. 10 Effect of the particle shape on effectiveness factor for the different reactions: (a) MSR (eqn (8)), (b) WGS (eqn (11)), (c) MeOH (eqn (12)) and (d) DME (eqn (15)). For the DME reaction, a cropped Y-axis scale is provided as a figure inset for better visualisation. | ||
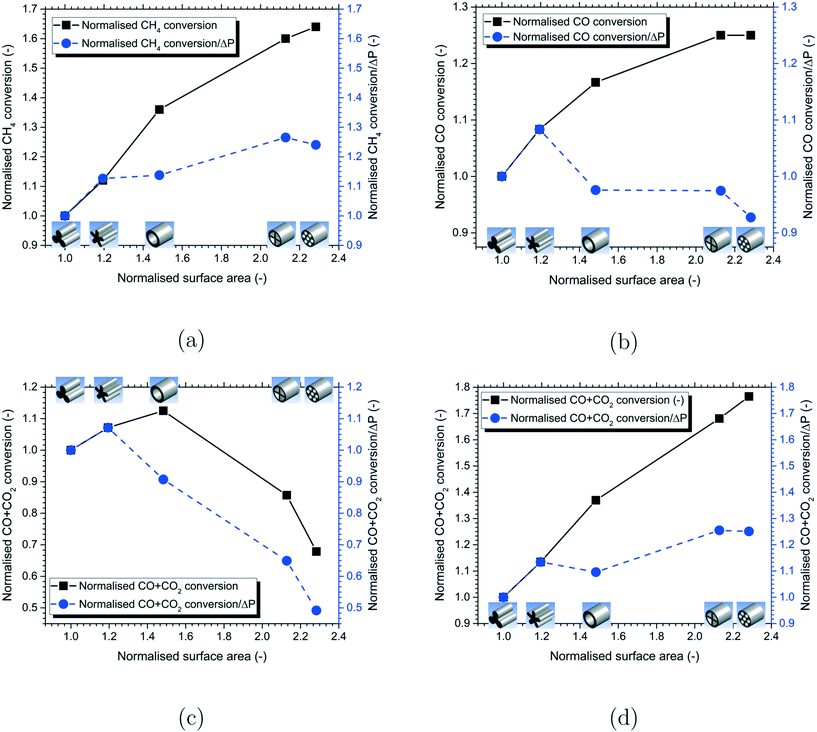
To assess the impact of particle shape on the reactor performance, a comparison of the normalised reactant conversion for the different particle shapes is shown in Fig. 11 for each of the reactions considered in the present work. The differences in the range of the Y-axis scale used for the different reactions should be noted. The results showed that an increase in the particle surface area led to an increase in the reactant conversion due to the increase in the effectiveness factor for the MSR, WGS and DME reactions. However, the relative change in values is significantly higher for the MSR and DME reactions having a higher extent of diffusion limitation compared to the WGS reaction having a lower extent of diffusion limitation. The 7-hole particle shape gave the highest reactant conversion for the MSR, WGS and DME reactions. On the other hand, the reactant conversion increased with the particle surface area up to a certain point and then decreased for the MeOH reactions. This is due to the increased reverse reaction shifting the equilibrium towards the left for the particles with a higher surface area. The hollow particle shape was found to provide the highest reactant conversion for the MeOH reactions as a further increase in the particle surface area decreased the reactant conversion.
Since the increase in particle surface area produces an additional pressure drop, it is important to compare the reactant conversion/pressure drop ratio to identify the optimal particle shape for the overall efficiency of the reactor. A comparison of the normalised reactant conversion/pressure drop ratio for the different particle shapes is presented in Fig. 11 for all the reactions. The value of this ratio decreased beyond a certain particle surface area for all the reactions as a further increase in the particle surface area caused more increase in the pressure drop compared to the corresponding increase in the reactant conversion. Therefore, increasing the particle surface area beyond a certain value is not always optimal. For the MSR and DME reactions with a higher extent of diffusion limitation, the cylcut shape was found to be optimal, whereas, for the WGS and MeOH reactions with a lesser extent of mass transfer limitation, the daisy shape was found to be optimal for the overall efficiency of the reactor.
4. Conclusions
Numerical simulations were performed to demonstrate a computational approach for the selection of optimal particle shape for a particular reaction and operating conditions considered in the present work. A cylindrical packed bed with a tube-to-particle diameter ratio of 5, six different particle shapes, namely, cylinder, trilobe, daisy, hollow cylinder, cylcut and 7-hole cylinder with equal particle volumes, and a Ret of 50![[thin space (1/6-em)]](https://www.rsc.org/images/entities/char_2009.gif) 000 were considered for the analysis. Four industrially important gas-phase catalytic reactions, namely methane steam reforming, water–gas shift, methanol synthesis and dimethyl ether synthesis were chosen to understand the effect of particle shape on a particular reaction.
000 were considered for the analysis. Four industrially important gas-phase catalytic reactions, namely methane steam reforming, water–gas shift, methanol synthesis and dimethyl ether synthesis were chosen to understand the effect of particle shape on a particular reaction.
Preliminary investigations were performed with the cylindrical particle shape to understand the reactor performance for the different reactions. In spite of having the same catalyst volume, considerable deviations in the pressure drop, effectiveness factor and reactant conversion were observed among the different reactions due to the differences in the operating conditions and reaction kinetics. Higher values of effectiveness factors for the MSR and DME reactions indicated higher mass transfer limitation compared to those of the WGS and MeOH reactions.
Later, investigations were performed to understand the effect of different particle shapes on the reaction performance for a particular reaction. For all the reactions, the pressure drop values were found to increase with the particle surface area as it created a more tortuous paths for the flow. The trilobe and 7-hole shapes gave the lowest and highest pressure drops, respectively. For all the reactions, the intra-particle temperature and species (reactants and products) concentration gradients decreased with an increase in the particle surface area due to the shorter diffusion length. Therefore, the increase in the particle surface area increased the effectiveness factor due to a decrease in the diffusion limitation for all the reactions. However, the relative change in values was the highest for the DME reaction and the lowest for the WGS reaction, which correlated well with the highest and lowest extents of mass transfer limitation, respectively. Overall, the trilobe and 7-hole shapes with the lowest and highest particle surface areas offered the lowest and highest effectiveness factors, respectively, for all the reactions.
In addition, the increase in particle surface area led to an increase in the reactant conversion due to the increase in the effectiveness factor for the MSR, WGS and DME reactions. However, the relative change in values is significantly higher for the MSR and DME reactions having a higher extent of diffusion limitation compared to the WGS reaction. The 7-hole particle shape gave the highest reactant conversion for the MSR, WGS and DME reactions. The hollow particle shape provided the highest reactant conversion for the MeOH reactions as a further increase in the particle surface area decreased the reactant conversion due to an increase in the reverse reactions. The reactant conversion/pressure drop ratio decreased beyond a certain particle surface area for all the reactions as a further increase in the particle surface area caused more increase in the pressure drop compared to the corresponding increase in the reactant conversion. For the MSR and DME reactions with a higher extent of diffusion limitation, the cylcut shape was found to be optimal, whereas for the WGS and MeOH reactions with a lesser extent of mass transfer limitation, the daisy shape was found to be optimal for the overall efficiency of the reactor.
In summary, the particle shape was found to have a considerable influence on the reaction performance and the optimal particle shape for the overall efficiency of the process depends on the extent of mass transfer limitation and reaction equilibrium for a particular reaction. The computational approach demonstrated in the present work can be extended to any particle shape, gas-phase catalytic reactions and operating conditions to understand the impact of particle shape on the reactor performance thereby choosing an optimal particle shape for a particular reaction.
Nomenclature
Symbols
Greek symbols
| α i,j | Stoichiometric coefficient of the ith species in the jth reaction [−] |
| ΔHj | Enthalpy of the jth reaction [kJ mol−1] |
| η i | Effectiveness factor for the ith reaction [−] |
| λ | Fluid thermal conductivity due to molecular transport [W m−1 K−1] |
| λ s | Particle thermal conductivity [W m−1 K−1] |
| λ t | Fluid thermal conductivity due to turbulent transport [W m−1 K−1] |
| λ s,eff | Effective thermal conductivity in the particle domain [W m−1 K−1] |
| μ | Fluid viscosity [Pa s] |
| μ t | Turbulent viscosity [Pa s] |
| ω | Turbulence eddy frequency [Hz] |
| ρ | Fluid density [kg m−3] |
| ρ s | Particle density [kg m−3] |
| ρ in | Fluid density at inlet [kg m−3] |
| τ | Viscous stress tensor [N m−2] |
| τ s | Particle tortuosity [−] |
| τ t | Turbulent stress tensor [N m−2] |
| ε s | Particle porosity [−] |
Conflicts of interest
There are no conflicts of interest to declare.Acknowledgements
One of the authors (Karthik, G. M.) gratefully acknowledges the Haldor Topsoe Company for providing CFD hardware and software support for this research.References
- A. G. Dixon, Local transport and reaction rates in a fixed bed reactor tube: Endothermic steam methane reforming, Chem. Eng. Sci., 2017, 168, 156–177 CrossRef CAS.
- A. Singhal, S. W. P. Cloete, S. Radl, R. Quinta-Ferreira and S. Amini Comparison of particle-resolved direct numerical simulation and 1d modelling of catalytic reactions in a packed bed, in Progress in Applied CFD, 2017 Search PubMed.
- A. G. Dixon, J. Boudreau, A. Rocheleau, A. Troupel, M. E. Taskin, M. Nijemeisland and E. H. Stitt, Flow, transport, and reaction interactions in shaped cylindrical particles for steam methane reforming, Ind. Eng. Chem. Res., 2012, 51(49), 15839–15854 CrossRef CAS.
- G. D. Wehinger, T. Eppinger and M. Kraume, Detailed numerical simulations of catalytic fixed-bed reactors: Heterogeneous dry reforming of methane, Chem. Eng. Sci., 2015, 122, 197–209 CrossRef CAS.
- S. Gur, T. Danielson, Q. Xiong, C. Hin, S. Pannala, G. Frantziskonis, A. Savara and C. S. Daw, Wavelet-based surrogate time series for multiscale simulation of heterogeneous catalysis, Chem. Eng. Sci., 2016, 144, 165–175 CrossRef CAS.
- Q. Xiong, Y. Yang, F. Xu, Y. Pan, J. Zhang, K. Hong, G. Lorenzini and S. Wang, Overview of Computational Fluid Dynamics Simulation of Reactor-Scale Biomass Pyrolysis, ACS Sustainable Chem. Eng., 2017, 5(4), 2783–2798 CrossRef CAS.
- H. Freund, T. Zeiser, F. Huber, E. Klemm, G. Brenner, F. Durst and G. Emig, Numerical simulations of single phase reacting flows in randomly packed fixed-bed reactors and experimental validation, Chem. Eng. Sci., 2003, 58(3–6), 903–910 CrossRef CAS.
- S. T. Kolaczkowski, R. Chao, S. Awdry and A. Smith, Application of a CFD code (FLUENT) to formulate models of catalytic gas phase reactions in porous catalyst pellets, Chem. Eng. Res. Des., 2007, 85(11), 1539–1552 CrossRef CAS.
- A. G. Dixon, M. E. Taskin, E. H. Stitt and M. Nijemeisland, 3D CFD simulations of steam reforming with resolved intraparticle reaction and gradients, Chem. Eng. Sci., 2007, 62(18–20), 4963–4966 CrossRef CAS.
- G. M. Karthik and V. V. Buwa, Effect of particle shape on fluid flow and heat transfer for methane steam reforming reactions in a packed bed, AIChE J., 2017, 63(1), 366–377 CrossRef CAS.
- A. G. Dixon, M. E. Taskin, M. Nijemeisland and E. H. Stitt, CFD method to couple three-dimensional transport and reaction inside catalyst particles to the fixed bed flow field, Ind. Eng. Chem. Res., 2010, 49(19), 9012–9025 CrossRef CAS.
- G. M. Karthik and V. V. Buwa, Particle-resolved simulations of methane steam reforming in multilayered packed beds, AIChE J., 2018, 64(11), 4162–4176 CrossRef.
- Y. Dong, M. Geske, O. Korup, N. Ellenfeld, F. Rosowski, C. Dobner and R. Horn, What happens in a catalytic fixed-bed reactor for n-butane oxidation to maleic anhydride? Insights from spatial profile measurements and particle resolved CFD simulations, Chem. Eng. J., 2018, 350, 799–811 CrossRef CAS.
- T. Eppinger, G. Wehinger, N. Jurtz, R. Aglave and M. Kraume, A numerical optimization study on the catalytic dry reforming of methane in a spatially resolved fixed-bed reactor, Chem. Eng. Res. Des., 2016, 115, 374–381 CrossRef CAS.
- B. Partopour and A. Dixon, An integrated workflow for resolved-particle packed bed models with complex particle shapes, Powder Technol., 2017, 322, 258–272 CrossRef CAS.
- M. Behnam and A. G. Dixon, 3D CFD Simulations of Local Carbon Formation in Steam Methane Reforming Catalyst Particles, Int. J. Chem. React. Eng., 2017, 15(6), 20170067 CAS.
- G. M. Karthik and V. V. Buwa, Effect of particle shape on catalyst deactivation using particle-resolved CFD simulations, Chem. Eng. J., 2019, 377, 120164 CrossRef.
- M. Behnam, A. G. Dixon, P. M. Wright, M. Nijemeisland and E. H. Stitt, Comparison of CFD simulations to experiment under methane steam reforming reacting conditions, Chem. Eng. J., 2012, 207, 690–700 CrossRef.
- G. D. Wehinger, T. Eppinger and M. Kraume, Fluidic effects on kinetic parameter estimation in lab-scale catalysis testing A critical evaluation based on computational fluid dynamics, Chem. Eng. Sci., 2014, 111, 220–230 CrossRef CAS.
- G. D. Wehinger, F. Klippel and M. Kraume, Modeling pore processes for particle-resolved CFD simulations of catalytic fixed-bed reactors, Comput. Chem. Eng., 2017, 101, 11–22 CrossRef CAS.
- W. Heinbichner, G. Wolf and A. Huster, A Particle-Resolved CFD Study of Combustion and Gasification Processes in a Coke-Fired Furnace, Int. J. Metalcast., 2018, 12(1), 126–138 CrossRef CAS.
- S. Schulze, P. Nikrityuk, F. Compart, A. Richter and B. Meyer, Particle-resolved numerical study of char conversion processes in packed beds, Fuel, 2017, 207, 655–662 CrossRef CAS.
- J. Theuerkauf, P. Witt and D. Schwesig, Analysis of particle porosity distribution in fixed beds using the discrete element method, Powder Technol., 2006, 165(2), 92–99 CrossRef CAS.
- H. Bai, J. Theuerkauf, P. A. Gillis and P. M. Witt, A coupled DEM and CFD simulation of flow field and pressure drop in fixed bed reactor with randomly packed catalyst particles, Ind. Eng. Chem. Res., 2009, 48(8), 4060–4074 CrossRef CAS.
- B. Partopour and A. G. Dixon, CFD as a Modeling Tool for Fixed Bed Reactors, Ind. Eng. Chem. Res., 2019, 58, 23 CrossRef.
- I. Ziółkowska and D. Ziółkowski, Fluid flow inside Packed Beds, Chem. Eng. Process., 1988, 23(3), 137–164 CrossRef.
- A. G. Dixon, M. Nijemeisland and E. H. Stitt, Packed tubular reactor modeling and catalyst design using computational fluid dynamics, Adv. Chem. Eng., 2006, 31, 307–389 CAS.
- ANSYS CFX-Solver Modeling Guide, Ansys, Inc., Canonsburg, PA 15317, 15.0 ed., 2013.
- R. K. Sharma, D. L. Cresswell, E. J. Newson and E. J. Newson, Effective Diffusion Coefficients and Tortuosity Factors for Commercial Catalysts, Ind. Eng. Chem. Res., 1991, 30(7), 1428–1433 CrossRef CAS.
- P. J. Donaubauer and O. Hinrichsen, Evaluation of Effectiveness Factors for Multicomponent Diffusion Models Inside 3D Catalyst Shapes, Ind. Eng. Chem. Res., 2019, 58(1), 110–119 CrossRef CAS.
- K. Hou and R. Hughes, The kinetics of methane steam reforming over a Ni/αAl2O catalyst, Chem. Eng. J., 2001, 82(1–3), 311–328 CrossRef CAS.
- Y. Choi and H. G. Stenger, Water gas shift reaction kinetics and reactor modeling for fuel cell grade hydrogen, J. Power Sources, 2003, 124(2), 432–439 CrossRef CAS.
- G. Graaf, E. Stamhuis and A. Beenackers, Kinetics of low-pressure methanol synthesis, Chem. Eng. Sci., 1988, 43(12), 3185–3195 CrossRef CAS.
- Z. Nie, H. Liu, D. Liu and W. Ying, Intrinsic Kinetics of Dimethyl Ether Synthesis from Syngas, J. Nat. Gas Chem., 2005, 14, 22–28 CAS.
- A. G. Dixon, M. Nijemeisland and E. H. Stitt, Systematic mesh development for 3D CFD simulation of fixed beds: Contact points study, Comput. Chem. Eng., 2013, 48, 135–153 CrossRef CAS.
- G. Wehinger, C. Füterer and M. Kraume, Contact modifications for CFD simulations of fixed-bed reactors: Cylindrical particles, Ind. Eng. Chem. Res., 2017, 56(1), 87–99 CrossRef CAS.
- G. M. Karthik, A. H. Thaker and V. V. Buwa, Particle-resolved simulations of catalytic fixed bed reactors: Comparison of turbulence models, LES and PIV measurements, Powder Technol., 2019 DOI:10.1016/j.powtec.2019.05.012.
- J. R. Ladebeck and J. P. WagnerCatalyst development for water-gas shift, Handbook of Fuel Cells – Fundamentals, Technology and Applications, 2003, vol. 3, pp. 190–201 Search PubMed.
- H. F. A. Topsoe and J. B. Hansen, Method of Preparing Methanol, US Pat., US005262443A, 1993 Search PubMed.
- B. Voss, F. Joensen and J. B. Hansen Preparation of Fuel Grade Dimethyl Ether, US Pat., US005908963A, 1999 Search PubMed.
Footnotes |
| † Electronic supplementary information (ESI) available. See DOI: 10.1039/c9re00240e |
| ‡ Presently working at Haldor Topsoe India Private Limited, Haryana-121003, India. |
| This journal is © The Royal Society of Chemistry 2020 |

