 Open Access Article
Creative Commons Attribution 3.0 Unported Licence
Catalytic methanation of CO2 in biogas: experimental results from a reactor at full scale†
Christian
Dannesboe
 *a,
John Bøgild
Hansen
b and
Ib
Johannsen
a
aDepartment of Engineering, Aarhus University, Hangøvej 2, DK-8200 Aarhus N, Denmark. E-mail: chda@ase.au.dk; ibj@eng.au.dk
bHaldor Topsøe A/S, Nymøllevej 55, DK-2800 Kongens Lyngby, Denmark. E-mail: jbh@topsoe.com
First published on 28th November 2019
Abstract
In a future energy scenario without fossil fuels carbon from renewable biomass will be a limited resource. Full carbon utilization through catalytic methanation of CO2 in biogas appears to be a low hanging fruit. However, concerns on catalyst cost and wear, elaborate reactor cooling requirements and significant costs related to post-treatment are reported from theoretical studies and early demonstration plants. In this study, we show how a full scale methanation reactor can be operated under favourable process conditions for 1000 hours without complications. We find that operating the reactor at a sub-stoichiometric ratio of 3.9 is optimal in order to deliver pipeline quality gas. The temperature profile shows how start and stop can be performed within minutes, and the combined studies presented are a breakthrough in direct catalytic upgrading of biogas ready for industrial scale implementation.
Introduction
Today, electricity from fossil resources struggle to compete with cheap electrical power harvested in efficient solar and wind energy-parks. Consequently, the production of electricity from renewable sources is expanding rapidly. Within the EU, 85% of the new electricity-generating capacity utilize renewable resources. Moreover, the majority of the decommissioned capacity is conventional facilities.1 Although these changes provide cheap renewable electricity, the imbalance between production and demand imposes a significant supply challenge. The ability to store energy for hours and days may be considered using existing battery technology,2 but the requirements of future energy solutions will rely on massive storage facilities to cope with imbalances lasting weeks, months and even seasonal variation. Hence, there is a need to develop other types of storage technologies to aid further implementation of renewable energy. Power to gas is based on the conversion of electricity to hydrogen via electrolysis and can enable chemical storage of energy. Hydrogen is, however, not the ideal candidate for a storage application, as significant compression (>100 bar) is required to reach a moderate energy density.3 Natural gas (methane) is a very effective and fully established energy carrier in all parts of the world. The energy density of methane is three times higher than hydrogen, and facilities for transport and storage are widespread. Converting hydrogen to methane can be done with methanation4 (eqn (1)), enabling storage of renewable energy as methane.| 4H2(g) + CO2(g) ⇄ CH4(g) + 2H2O(g) ΔH300°C = −165 kJ mol−1 | (1) |
Biogas produced from biomass (i.e. manure or other agricultural side streams) produce a methane-rich gas. As only around 60% is methane, the main contaminant CO2 (40%) is normally discarded through a separation process and the remaining methane can be exported using the existing gas grid. The swap to renewable gas is straightforward and a significant replacement of natural gas by renewable methane is observed in countries like Denmark, Sweden, Germany and the Netherlands. In July 2018 Denmark reported a record 18% of the national gas demand supplied from biogas plants.5 Although methanation of CO2 in biogas enable full utilization of renewable carbon, this practice is not common. Studies of economic feasibility highlight how renewable methane from biogas have difficulties in competing with the very low price of natural gas, given the limited political initiatives to enforce significant fossil taxation.6 In addition, hydrogen from renewable resources is required, and the low electrical conversion efficiency of alkaline and proton-exchange-membrane electrolysis units (50–65% on a lower heating value basis7) makes renewable methane production via methanation costly. Even though significant improvements have been achieved, the cost of hydrogen remains the single most important factor affecting methanation plants.8–10
Numerous reviews of CO2 methanation technology highlight several significant costs and process constraints to reach full implementation at an industrial scale. Efficient cooling of a fixed bed methanation reactor is required to avoid catalyst deactivation (thermal sintering) in the reactor hotspot.11–14 This leads to a reactor design with multiple cooling loops including expensive hot oil or molten salt systems.9,14,15 Alternatively, several reactors in series or a large and costly recycle loop is required.14 Catalyst deactivation by carbon formation is also a thoroughly documented problem.11,15,16 In the specific case of direct methanation of CO2 in biogas, potential methane cracking is especially relevant. Carbon formation has been reported when operating the methanation reaction below a stoichiometric ratio of 4.9,11,12,17 Several studies on the quality of the produced gas conclude inadequate export quality from a single pass reactor. Two separate reactors, with intermediate water removal, will be needed to achieve the required conversion of CO2 and H2.9,10,13 Conversion is favoured by a low reactor temperature (i.e. 250–300 °C). However, low catalyst activity at this process temperature limits conversion by kinetic constraints.8,13,17 Insufficient conversion leads to costly removal of reactants downstream (i.e. membrane purification) to achieve >97% CH4 content.9,10,18
The concerns above have resulted in expensive and overcautious design of CO2 methanation plants. In this work, we show how most of these concerns, although thoroughly documented, can be attributed to misleading guidelines adapted from the experience of CO methanation and recommendations when using catalysts with moderate resistance to thermal sintering. We report the experimental data from a full-scale methanation reactor for direct catalytic methanation of CO2 in biogas. Using raw biogas as feed, the reactor is operated for 1000 hours and prove how state-of-the-art CO2 methanation technology offer pipeline grade natural gas without the need for downstream removal of unreacted H2 and CO2. Additionally, efficient cooling is obtained using a simple boiling water reactor design.
Experimental
The methanation reactor presented here is part of a combined electrolysis–methanation system using solid oxide electrolysis cells (SOEC). The idea of utilizing synergies between SOEC and direct catalytic methanation of CO2 in biogas was first suggested at the European Fuel Cell conference in Rome, 2001.19 Similar design ideas including catalytic methanation and biogas quickly followed in the years to come.10,20,21 In essence, the pilot plant consists of a biogas pretreatment section, a full-scale methanation reactor and a water separation/gas drying section. The treatment steps are shown in Fig. 1.Biogas pretreatment
Raw biogas was delivered directly from the biogas reactor at AU Foulum. Bulk removal of H2S was done by activated carbon. The potassium iodine impregnated alkaline activated carbon used was SOLCARB® KS3 (Chemviron Carbon, Lancashire, United Kingdom). This removes hydrogen sulfide from ∼1000 ppm to ∼1 ppm, but sulfur species like carbondisulfide, dimethylsulfide and carbonylsulfide will leak through.22 A final sulfur guard removes all residual sulfur compounds to ppb level (zinc oxide absorbent, HTZ-51, Haldor Topsøe A/S, Kgs. Lyngby, Denmark). The biogas is produced exclusively from caw manure and straw. Contaminants like aromatic compounds or terpenes are not observed as a problem from this feedstock. A detailed study of the biogas pretreatment section can be found in literature.22 The biogas flow is measured using a Coriolis flowmeter (Proline Promass 80A, Endress+Hauser AG, Switzerland) and controlled using a flow-valve (RC200, Badger Meter Europa GmbH, Germany). Hydrogen flow is controlled by a mass flow controller (EL-FLOW, Bronkhorst High-Tech B.V., Netherlands). Mixing of biogas and hydrogen is ratio-controlled with the hydrogen flow fixed.Methanation reactor
The processing capacity of the methanation reactor was chosen to be 10 Nm3 h−1 biogas. This capacity was selected as it represents the smallest possible full-scale design of a multi-tube packed bed reactor. The reactor is a double pass design, i.e. the smallest possible multi tube reactor consist of only two tubes (Fig. 2). Upscaling of this reactor to obtain higher processing capacity would only affect the number of tubes as gas hour space velocity (GHSV), linear velocity and tube dimensions remain unchanged. The packed bed height is 2.3 m. Boiling water is used as the reactor cooling strategy. Pressurizing the cooling water to 65 bar keeps the boiling point at 280 °C (the desired reactor temperature23). The specific dimensions of the two reactor tubes is proprietary information of Haldor Topsøe A/S.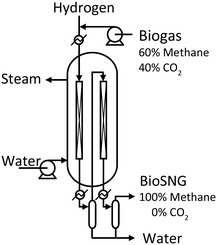 | ||
| Fig. 2 Design of the double pass, packed bed, boiling water reactor with condensate removal after the first pass. Included from earlier work.23 | ||
The loaded methanation catalyst is HT-25442. This is a cylindrical shaped Ni/Al2O3 based methanation catalyst specifically designed to withstand long term operation at up to 700 °C like the MCR-2 catalyst described in literature.24,25 A reactor exit pressure of 20 barg is maintained by a pressure valve (RC200, Badger Meter Europa GmbH, Germany).
A detailed temperature profile through the first reactor tube allows monitoring catalyst performance during startup and shutdown as well as hotspot migration (an indicator of catalyst deactivation). The temperature profile is recorded using a multipoint thermocouple with 3 cm spacing between the probes (Thermo Electric Instrumentation B.V., Netherlands). The reactor tube has a length of 2.4 m and is equipped with 16 temperature probes to provide a full profile.
After the first pass, the produced water is removed by condensation before the gas is passed through the second reactor tube. This double pass strategy ensures a methane content/Wobbe index within the specifications of natural gas.23
Actual gas composition is measured by a gas chromatograph (Micro GC 490, Agilent Technologies, United States) equipped with two channels (MS5A and PPQ columns) and a thermal conductivity detector allowing analysis of hydrogen, nitrogen, methane, carbon monoxide and carbon dioxide. Using automatic sampling, the GC performs online analysis, but some delay is expected due to machine processing time and the physical distance the sample has to travel to the GC.
Comparison of simulation and methanation data
To compare the theoretical equilibrium of the methanation reaction with data from the methanation reactor, a simulation study was performed using Aspen Plus software (Aspen Tech, Unites States). The simulation used the Gibbs reactor. Water removal by condensation was included in the model by using the flash drum unit. Both reactor tubes and both condensation steps were included to allow direct comparison of the gas composition. In the model, a biogas composition of 60% methane and 40% CO2 was used. The equation of state model Soave–Redlich–Kwong was the basis of the calculations. The effect of changing the CO2 to H2 ratio was investigated (stoichiometric ratio is 1![[thin space (1/6-em)]](https://www.rsc.org/images/entities/char_2009.gif) :
:![[thin space (1/6-em)]](https://www.rsc.org/images/entities/char_2009.gif) 4). H2 surplus was adjusted from 3.75 to 4.15 in the model. The experimental data from the methanation reactor was obtained in a similar way by adjusting the ratio between CO2 and H2. The ratio-change was performed during a five-hour period using a ramp. The change was slow to minimize the delay-effect from the sample processing time.
4). H2 surplus was adjusted from 3.75 to 4.15 in the model. The experimental data from the methanation reactor was obtained in a similar way by adjusting the ratio between CO2 and H2. The ratio-change was performed during a five-hour period using a ramp. The change was slow to minimize the delay-effect from the sample processing time.
Results and discussion
Temperature profile of the methanation reactor
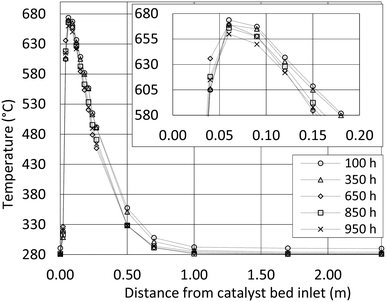
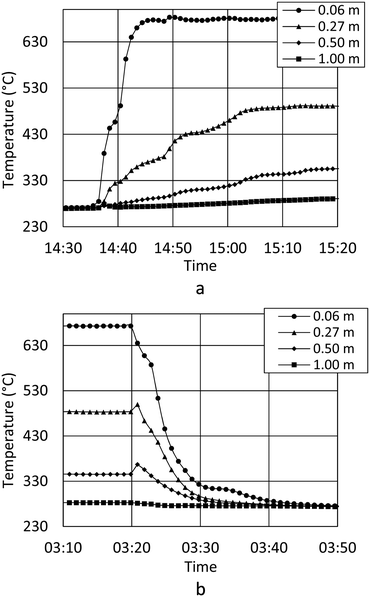
During the test period, the methanation reactor was in operation for 1000 hours in total. The temperature profile through the first reactor tube (Fig. 3) reveals an extremely rapid temperature increase, a temperature hotspot just below 680 °C and very efficient cooling within only 0.5 m. The exothermal methanation reaction is close to complete within the first 0.5 m of the reactor tube. Hotspot migration down the reactor tube is not observed during 1000 h of operation. The data indicate no catalyst deactivation. Consequently, the biogas pretreatment must be excellent. The observed differences are expected to arise from small flow variations between the test runs.Temperature readings from startup (Fig. 4a) show how the methanation reaction is engaged within minutes. Fig. 4a also show how steady state operation with respect to the temperature profile is obtained after 25 minutes, and how shutdown can be performed within minutes (Fig. 4b). In the first minutes of the startup, the exothermal reaction heats the reactor tubes and catalyst mass to the final steady state temperature. The result is a slightly increased cooling capacity until steady state is obtained. Theoretically, this will result in a satisfactory gas quality very rapidly (before the temperature probes stabilize), but this has not yet been confirmed experimentally. Startup and shutdown data at every thermocouple position are available as supplementary material (Fig. SI 1 and SI 2†).
Investigation of the chemical equilibrium
Simulation studies of the ratio between H2 and CO2 (Fig. 5) confirm how the highest methane content can be obtained at the stoichiometric ratio of 4. Operating near the stoichiometric ratio of 4 produces a gas within the European Norm on natural gas.26 This allows direct export without downstream removal of H2 and CO2. From an operational perspective, the simulations show how a ratio of 3.9 to 3.95 would be preferred. Each simulation assume full chemical equilibrium is achieved.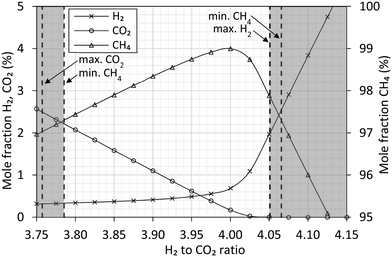 | ||
| Fig. 5 Aspen Plus simulation at 280 °C, 20 barg of the equilibrium composition between feed and reactants of the methanation reaction (eqn (1)). The feed composition is varied around the stoichiometric ratio of H2 to CO2. The gas composition is expressed as molar fraction of H2 (cross), CO2 (circle) and CH4 (triangle). Vertical dashed lines represent the gas specification26 and indicate the limits allowing direct export of the produced gas. | ||
Experimental data from the methanation reactor are summarized in Fig. 6 along with simulated values. Above the stoichiometric ratio of 4 (i.e. H2 surplus) the data show excellent agreement with the simulation. Full chemical equilibrium is achieved. Below the stoichiometric ratio (i.e. CO2 surplus), the data clearly deviate from the chemical equilibrium. As the reaction requires four H2 for every CO2, the deviation is very clear for hydrogen. At a ratio of 4.00 to 4.05 the experimental data appear noisy. Analysis of methane in this range show values above and below the equilibrium line, and individual measurements show significant variation. This might be explained by unforeseen sudden variation in biogas feed (like start/stop of mixers in the biogas reactor), but the direct course is unknown.
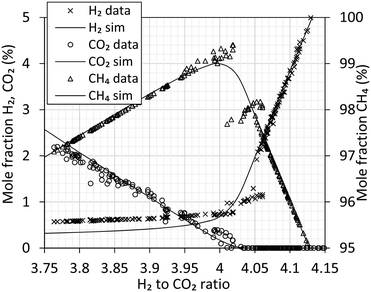 | ||
| Fig. 6 Analysis of the produced gas using gas chromatography. Gas composition is expressed as molar fraction of H2 (cross), CO2 (circle) and CH4 (triangle). Processing of 7.0 Nm3 h−1 H2 at 280 °C, 20 barg. Simulated equilibrium curves from Fig. 5 are included as reference. | ||
Performance of the methanation reactor
Results from 1000 hours of production of a full scale methanation reactor for direct conversion of CO2 in biogas has been presented. The results show how the boiling water reactor offer very efficient cooling of the exothermal methanation reaction. The double pass design with water removal after the first pass ensures a robust solution as the produced gas is in agreement with the European Norm (EN 16726) in a wide operational window (3.8 to 4.05). Analysis confirms a gas quality within the specification of natural gas if the residual moisture is reduced to satisfy the dew point specification. Experimental results confirm how start and stop of the methanation reactor can be achieved in a timescale of minutes (from hot standby). This will be the requirement if the methanation reactor is combined with an electrolysis unit in future grid stabilization applications. This process flexibility is also confirmed at other pilot facilities.9,13 As the temperature hotspot in the reactor is steady after 1000 hours, no decrease in catalyst activity was noted. This can only be explained by excellent sulfur removal and a catalyst not predisposed to sintering or carbon formation. The results also point towards a possible final reactor design with shorter tubes of 1 m being sufficient.Carbon formation below stoichiometric ratio of four
This simulation study finds the optimum H2 to CO2 ratio to be 3.9 to 3.95. The result is identical to simulation studies by others.9 Operating at a ratio below 4 was also previously recommended by a third group,16 however the proposed guideline from this last study, with a ratio as low as 3.4, is only possible due to a higher allowed CO2 concentration of 6% at a specific location. Despite these recommendations, recently built demonstration plants have specifically chosen to operate at a ratio above 4, due to the risk of carbon formation when operating at a sub-stoichiometric ratio.9,13 This guideline originates from the experiences of CO methanation, where carbon formation via the Boudouard reaction can be a significant problem.11,15,17 A second concern is previous findings of significant carbon deposition at 500–800 °C specifically using Ni/Al2O3 catalyst due to methane decomposition.27 A more recent study using a Ni/CeO2–ZrO2 catalyst also observe carbon formation at sub-stoichiometric ratio,12 whereas other studies of CO2 methanation28 observe no carbon formation in any of the spend catalyst samples.In case of CO methanation, the hotspot temperature shown here (>550 °C, Fig. 3) would require increased pressure and steam addition to ensure the chemical equilibrium would not favor severe carbon formation. However, as CO is not present in the feed gas and as steam is produced by the reaction, carbon formation is not an issue.17 Past studies of CO and CO2 methanation have also shown how, although favorable, carbon formation can be suppressed by ensuring the metal crystals on the support are very fine,29 by sulfur passivation30 or by adding promoters like CeO2.27 The risk of carbon formation from the Boudouard reaction and from methane decomposition at various H/C and O/C ratios can be evaluated using the thermodynamic data from litterature.31 If the equilibrated gas (with respect to methanation and the water gas shift reaction) shows affinity for carbon formation, graphite precipitation will take place in the form of whiskers with the same dimensions as the nickel crystals in the catalyst. The hotspot temperature in the reactor (Fig. 3) is within the carbon formation region (Fig. 7), calculated using thermodynamic data for graphite formation, but the small nickel crystal size in the catalyst prevents carbon whisker formation and continued operation can be performed without any catalyst deactivation by coking. The guidelines presented here are not new, but knowledge of their existence is often overlooked.
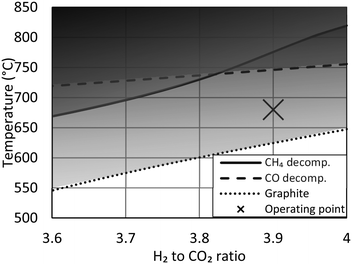 | ||
| Fig. 7 Carbon limit temperatures indicating risk of graphite precipitation (dotted line) and carbon deposition from decomposition of CH4 (solid line) or CO (dashed line). Carbon limits calculated using thermodynamic data31 at 20 barg. The actual hotspot temperature of the reactor (Fig. 3) is marked with an X. | ||
Deviation from chemical equilibrium
The results presented here show how full chemical equilibrium is obtained when operating the CO2 methanation reaction above the stoichiometric ratio of 4. Satisfactory estimates on gas composition are obtained from simple minimization of Gibbs free energy; even though employing this method means ignoring all kinetic limitations. However, a contradictory observation can also be made from the experimental results presented here. At sub-stoichiometric ratio (Fig. 6), the gas analysis could indicate that complete chemical equilibrium is not obtained. Due to the reaction stoichiometry, this effect is very clear for hydrogen. This could spark renewed considerations into the rate determining step (RDS) of CO2 methanation. Clarifying the mechanism of CO2 methanation has been attempted for 100 years (!) and an overwhelming amount of research papers, both experimental and theoretical, have been published. However, still no consensus exists.15,28,32,33 One of the central questions is whether CO2 methanation proceeds via a CO intermediate34 or if a direct route35via formate or carbonate is preferred. Some results36–38 point towards a direct CO intermediate route, but an intermediate route via formate to CO is also possible.39,40 However, other results indicate no CO intermediate is required.41,42 A review on the mechanism of CO2 methanation,33 note how the formate route (without a CO intermediate) is only observed by research groups using hydrogen levels far above stoichiometric ratio (5![[thin space (1/6-em)]](https://www.rsc.org/images/entities/char_2009.gif) :
:![[thin space (1/6-em)]](https://www.rsc.org/images/entities/char_2009.gif) 1, 9
1, 9![[thin space (1/6-em)]](https://www.rsc.org/images/entities/char_2009.gif) :
:![[thin space (1/6-em)]](https://www.rsc.org/images/entities/char_2009.gif) 1). At stoichiometric ratio, the methanation of CO2 will probably proceed via a CO intermediate, but several viable routes towards the CO intermediate exists. The intermediate CO has been confirmed at stoichiometric ratio of 4 during CO2 methanation at 300 °C by in situ infrared spectroscopy.28 The preferred CO2 methanation pathway will be a result of catalyst composition, temperature and hydrogen ratio.33 The CO2 methanation mechanism may occur via parallel routes simultaneously.40
1). At stoichiometric ratio, the methanation of CO2 will probably proceed via a CO intermediate, but several viable routes towards the CO intermediate exists. The intermediate CO has been confirmed at stoichiometric ratio of 4 during CO2 methanation at 300 °C by in situ infrared spectroscopy.28 The preferred CO2 methanation pathway will be a result of catalyst composition, temperature and hydrogen ratio.33 The CO2 methanation mechanism may occur via parallel routes simultaneously.40
The data presented here clearly show how CO2 methanation can proceed without the sintering and carbon deposition challenges specifically caused by CO in CO methanation. Our results, as also observed by others,13 show no CO in the final gas. The data presented indicate a change in the methanation reaction occurring at a ratio of 3.95 and could explain how different studies all claiming to operate at the same stoichiometric ratio of ∼4 could differ significantly.
Conclusion
Direct methanation of CO2 in biogas enables full carbon utilization from biomass. When combined with electrolysis, conversion and storage of electricity as natural gas is possible. Large-scale implementation is however restricted by concerns of significant catalyst cost and wear, elaborate reactor cooling requirements and significant costs related to post-treatment of the produced gas. Based on these guidelines, current feasibility studies and demonstration plants highlight the need for further development. In this study, we have shown how full scale methanation of CO2 in biogas can be performed without complications. We document 1000 hours of operation in process conditions favoring carbon deposition without any catalyst deactivation. Our studies show, that the cautious guidelines on carbon formation, thermal sintering and operation below stoichiometric ratio clearly needs to be revised. Operations around the stoichiometric ratio indicate a change in the mechanism of CO2 methanation, as the reaction only deviate from chemical equilibrium below the stoichiometric ratio. Experimental results confirm how start and stop can be achieved within minutes.Further research into improved performance of CO2 methanation catalyst seems difficult to justify, as current technology outperforms the lifetime of most other plant components. The high efficiency of the catalyst will limit the sales volume and even large-scale biogas plants (1000 Nm3 h−1) barely require more than a typical absolute minimum order of catalyst.
Conflicts of interest
There are no conflicts to declare.Acknowledgements
This project was made possible by 5.3 mio. € funding from the Danish Energy Technology Development and Demonstration Program (EUDP).References
- C. Nissen, F. Meinke-Hubeny, L. Emele, M. Tomescu, A. Das and I. Moorkens, Renewable energy in Europe 2018, European Topic Centre for Air Pollution and Climate Change Mitigation, 2019 Search PubMed.
- H. Blanco and A. Faaij, Renewable Sustainable Energy Rev., 2018, 81, 1049–1086 CrossRef.
- G. Marbán and T. Valdés-Solís, Int. J. Hydrogen Energy, 2007, 32, 1625–1637 CrossRef.
- P. Sabatier and J. B. Senderens, Comptes Rendus Acad. Sci., 1902, Section VI - Chimie, 514–517 Search PubMed.
- Energinet, Gasforsyningssikkerhed 2018, Energinet, 2018 Search PubMed.
- J. D. Jenkins and V. J. Karplus, Carbon pricing under binding political constraints, Report 1798–7237, United Nations University, 2016 Search PubMed.
- F. M. Sapountzi, J. M. Gracia, C. J. Weststrate, H. O. A. Fredriksson and J. W. Niemantsverdriet, Prog. Energy Combust. Sci., 2017, 58, 1–35 CrossRef.
- M. A. A. Aziz, A. A. Jalil, S. Triwahyono and A. Ahmad, Green Chem., 2015, 17, 2647–2663 RSC.
- S. Biollaz, A. Calbry-Muzyka, T. Schildhauer, J. Witte and A. Kunz, Direct Methanation of Biogas, Paul Scherrer Institut, 2017 Search PubMed.
- L. Wang, M. Pérez-Fortes, H. Madi, S. Diethelm, J. V. Herle and F. Maréchal, Appl. Energy, 2018, 211, 1060–1079 CrossRef CAS.
- C. H. Bartholomew, Appl. Catal., A, 2001, 2012, 17–60 CrossRef.
- F. Ocampo, B. Louis, A. Kiennemann and A. C. Roger, IOP Conf. Ser.: Mater. Sci. Eng., 2011, 19, 012007 Search PubMed.
- M. Gruber, P. Weinbrecht, L. Biffar, S. Harth, D. Trimis, J. Brabandt, O. Posdziech and R. Blumentritt, Fuel Process. Technol., 2018, 181, 61–74 CrossRef CAS.
- S. Rönsch, J. Schneider, S. Matthischke, M. Schlüter, M. Götz, J. Lefebvre, P. Prabhakaran and S. Bajohr, Fuel, 2016, 166, 276–296 CrossRef.
- G. A. Mills and F. W. Steffgen, Catal. Rev.: Sci. Eng., 1974, 8, 159–210 CrossRef.
- L. Jurgensen, E. A. Ehimen, J. Born and J. B. Holm-Nielsen, Bioresour. Technol., 2015, 178, 323–329 CrossRef CAS PubMed.
- J. Gao, Y. Wang, Y. Ping, D. Hu, G. Xu, F. Gu and F. Su, RSC Adv., 2012, 2, 2358 RSC.
- F. Bauer, C. Hulteberg, T. Persson and D. Tamm, Biogas upgrading – Review of commercial technologies, Report 270, Svenskt Gastekniskt Center AB, 2013 Search PubMed.
- J. B. Hansen, C. F. Pedersen, J. U. Nielsen and N. Christiansen, European Fuel Cell 2011, Rome, Italy, 2011 Search PubMed.
- HELMETH, 2018, p. 36 Search PubMed.
- E. Giglio, A. Lanzini, M. Santarelli and P. Leone, J. Energy Storage, 2015, 1, 22–37 CrossRef.
- C. Dannesboe, J. B. Hansen and I. Johannsen, accepted for publication in Biomass Conversion and Biorefinery (ISSN 2190-6815) as manuscript No. BCAB-D-19-00414R1, 2019 Search PubMed.
- C. Dannesboe, J. B. Nielsen and I. Johannsen, 2019, in preparation.
- J. R. Rostrup-Nielsen, K. Pedersen and J. Sehested, Appl. Catal., A, 2007, 330, 134–138 CrossRef CAS.
- T. T. M. Nguyen, L. Wissing and M. S. Skjøth-Rasmussen, Catal. Today, 2013, 215, 233–238 CrossRef CAS.
- EN 16723-1:2016, European Committee for Standardization, Brussels, CEN Management Center, 2016.
- S. Wang and G. Q. Lu, Appl. Catal., B, 1998, 19, 267–277 CrossRef CAS.
- H. Muroyama, Y. Tsuda, T. Asakoshi, H. Masitah, T. Okanishi, T. Matsui and K. Eguchi, J. Catal., 2016, 343, 178–184 CrossRef CAS.
- H. Harms, B. Höhlein and A. Skov, Chem. Ing. Tech., 1980, 52, 504–515 CrossRef CAS.
- J. R. Rostrup-Nielsen, Stud. Surf. Sci. Catal., 1991, 68C, 85–101 CrossRef.
- J. R. Rostrup-Nielsen, Catalytic Steam Reforming, Springer-Verlag, 1984 Search PubMed.
- X. Su, J. Xu, B. Liang, H. Duan, B. Hou and Y. Huang, J. Energy Chem., 2016, 25, 553–565 CrossRef.
- B. Miao, S. S. K. Ma, X. Wang, H. Su and S. H. Chan, Catal. Sci. Technol., 2016, 6, 4048–4058 RSC.
- H. A. Bahr, Gesammelte Abh. Kennt. Kohle, 1929, 8, 219 Search PubMed.
- H. Pitcher, Brennst.-Chem., 1943, 24, 39 Search PubMed.
- I. A. Fischer and A. T. Bell, J. Catal., 1996, 162, 54–65 CrossRef.
- C. d. Leitenburg, A. Trovarelli and J. Kaspar, J. Catal., 1997, 166, 98–107 CrossRef.
- A. Beuls, C. Swalus, M. Jacquemin, G. Heyen, A. Karelovic and P. Ruiz, Appl. Catal., A, 2012, 113–114, 2–10 CrossRef CAS.
- F. Solymosi, A. Erdöhelyi and T. Bansagi, J. Catal., 1981, 68, 371–382 CrossRef CAS.
- M. Marwood, R. Doepper and A. Renken, Appl. Catal., A, 1997, 151, 223–246 CrossRef CAS.
- H. Y. Kim, H. M. Lee and J.-N. Park, J. Phys. Chem. C, 2010, 114, 7128–7131 CrossRef CAS.
- Z. A. Ibraeva, N. V. Nekrasov, B. S. Gudkov, V. I. Yakerson, Z. T. Beisembaeva, E. Z. Golosman and S. L. Kiperman, Kinet. Catal., 1990, 26, 584–588 Search PubMed.
Footnote |
| † Electronic supplementary information (ESI) available. See DOI: 10.1039/c9re00351g |
| This journal is © The Royal Society of Chemistry 2020 |


