 Open Access Article
Extraction of lignin and quantitative sugar release from biomass using efficient and cost-effective pyridinium protic ionic liquids†
Azmat Mehmood Asima,
Maliha Uroos*a and
Nawshad Muhammad *bc
*bc
aInstitute of Chemistry, University of the Punjab, 54000, Lahore, Pakistan. E-mail: malihauroos.chem@pu.edu.pk
bInterdisciplinary Research Centre in Biomedical Materials (IRCBM), COMSATS University Islamabad, Lahore Campus, 54600, Lahore, Pakistan. E-mail: nawshadmuhammad@cuilahore.edu.pk
cDepartment of Dental Materials, Institute of Medical Sciences Khyber Medical University Peshawar, Pakistan
First published on 11th December 2020
Abstract
Lignocellulosic biomass is enormously abundant around the globe. It bears huge potential for renewable products as its components can be converted to many useful products via cheaper processes. Recently, the component of biomass that has attracted enormous attention is lignin owing to its several aromatic or phenolic constituents. The utilization of lignin, however, is hindered by its troublesome separation mainly due to the difficult nature of the lignocellulosic biomass. Protic ionic liquids have great potential for extraction of lignin from the lignocellulosic biomass to make it viable for various transformations. In this study, protic ionic liquids comprising a pyridinium cation and a dihydrogen phosphate anion (H2PO4−) were prepared and used for lignin extraction and subsequent saccharification of the cellulose pulp. The ILs exhibited appreciably high lignin yields (optimum 73%) under mild conditions (100 °C) and shorter time (2 h). Fairly good sugar (glucose) yields (77%) verify effective delignification. The analysis of ILs and biomass was accomplished by H-NMR, FT-IR, SEM, HSQC and GPC.
Introduction
Exploration of different domains of natural resources for economic technologies in biorefineries is one of the most significant fields of chemical research. For this purpose, the most frequently probed material is the lignocellulosic biomass. The fascination of biomass lies in its opulence and potential for the production of invaluable products such as cheaper energy and number of useful renewable chemicals having numerous applications in industries and daily life.1 Noteworthy materials, which can be acquired from vast amounts of biomass sources include bioethanol, bio-gas, bio-hydrogen, 5-hydroxy methyl furfural (HMF), levulinic acid (LA), fibers, films, and nanocomposites. The enormous stocks of waste and natural materials such as crop residues, and industrial and municipal waste are surplus. The lignocellulosic biomass contains three main constituents known as cellulose, lignin and hemicellulose, which are present in it in varying amounts.2 Besides the other two main fractions, lignin is the far less investigated component. Previously, it has been used as a low-value heating fuel, binder and dispersant.3 However, recently, it has been identified as a source of numerous industrially important materials such as adhesives,4 polyurethane,5 polyesters,6 biofilms7 and biologically active polyphenols (aromatics).8 Keeping in view the above discussion lignin may be envisaged as a probable starting material leading to green technology for renewable products. The massive deposits of lignocellulosic biomass make lignin the most competitive candidate for this purpose.The major challenge posed in the processing of lignocellulosic biomass is the adamant morphology of complex network of cellulose, lignin and hemicellulose. Isolation of lignin thus becomes a cumbersome process yielding meager amounts of products as detailed in the methods reported in the literature. The kraft method, alkali method and acid hydrolysis have been the most frequently employed strategies in this regard. However, there have been serious concerns over environmental deterioration caused by traditional methods. Therefore, a pursuit of novel chemical technologies that would be safer to apply, economic and facile are highly desirable in the present era.
The efficacy of mineral acids for the fractionation of lignocellulosic biomass (lignin, hemicellulose and cellulose) led to the design of protic ionic liquids for the same purpose. Many researchers prepared protic ILs that mimic or act even better than mineral acids, as previously found in the literature.9 da Costa and coworkers first demonstrated that lignocellulosic biomass fractionation hinge on the nature of the IL used. This study demonstrates the efficiency of protic ionic liquid [Bmim][HSO4] for the fractionation of wheat straw, where lignin-free cellulosic material and pure lignin were obtained.10 Lignin extraction from corn stover using protic ionic liquids has been reported by Achinivu and coworkers.11 They reported up to 75% lignin extraction by treating the biomass at 90 °C for 24 h. Brandt et al. reported the mechanism through which the bonds in the network of lignocellulosic biomass are broken when ionic liquid ions interact with the biomass.12 Protic ILs disrupt the bonds between lignin and hemicellulose and also depolymerize lignin by cleaving β-O-4 ether, glycosidic and ester linkages. The same research group brought an improvement in the field by showing that the economic large-scale production of a protic ionic liquid ([TEA][HSO4]) based on triethanolamine (TEA) could be achieved. This ionic liquid was used to delignify Miscanthus giganteus (85%), remove hemicellulose (100%) and obtain pure pulp.13 Recently, de C. M. Miranda et al.41 have demonstrated lignin extraction from pineapple crown using low-cost protic ionic liquids. Out of several PILs, bis(2-hydroxyethyl)ammonium propionate [BHEA][Pr] was found to be the most effective ionic liquid for solubilisation of lignin and delignification of the biomass. It afforded 90% lignin removal from pineapple crown. A special feature of this research is the assessment of toxic compounds in the mixture of the ILs and biomass to evaluate the toxicity of the ionic liquids. They found that the proportion of toxic compounds was far less, thus featuring the PILs as less toxic solvents compared to mineral acids, alkalis and others.14 Other examples where PILs have been employed for pretreatment and delignification may also be presented.12,15,16
Although recent research in the field of biomass processing using PILs has brought about significance improvements, still there is a need to synthesize a variety of cheaper ionic liquids for economic biorefineries. Among other amines used for synthesis of PILs, pyridine is a less explored reagent though it is easily available and relatively cheap. Neutral ionic liquids synthesized from ‘pyridine’ having alkyl side chains have been probed in the past research. Some researchers have reported that pyridinium ILs have high biodegradability and their mineralization occurs at higher speeds than imidazole-based ones.17–19 Pyridine is cheaper than most of the amines used for the synthesis of ILs. Thus, pyridinium-based ILs offer another advantage that they show equivalent efficiency but low cost than most of the conventional solvents and imidazole ILs; thus allowing economic biomass processing for biorefineries.20 Owing to low eco-toxicology, relatively low costs and equivalent efficiency in biomass pretreatment, PILs based on pyridine and cheaper mineral acids can be even greener and more productive for biomass pretreatment. The present work describes the synthesis and use of cost-effective protic ionic liquids (PILs) containing pyridinium cations and clusters on H2PO4− anions (H2PO4−·XH3PO4, where X = 0, 1, and 2) for lignin extraction and sugar release from wheat straw and rice husk. The ionic liquids were synthesized using simple and short methods at low enough temperature (0–5 °C), thus making the process greener. The acquired ionic liquids were then employed under mild conditions (70–100 °C) for the pretreatment of wheat straw and rice husk. The results indicate that anion-cluster-based PILs are effective solvents for lignin removal from wheat straw and rice husk. In addition to this, fairly high amount of glucose (77%) was also obtained from the cellulosic rich material of biomass. This verifies the efficacy of lignin extraction and the associated disruption of adamant networks of cellulose and lignin. Compositional analysis, HSQC NMR, FT-IR, H NMR, SEM and TGA were conducted for the characterization of the synthesized ionic liquids and fractions of biomass (cellulose and lignin).
Experimental
Materials
Pyridine (Riedel-de Haën) and 85% phosphoric acid (Sigma-Aldrich) were purchased and used without further purification; 72% sulphuric acid and analytical grade calcium carbonate (for compositional analysis) were purchased from Sigma-Aldrich. Wheat straw and rice husk were purchased from a local market in Lahore Pakistan. All the solvents, i.e. methanol, acetone, and ethanol, were distilled before use.Synthesis of ILs
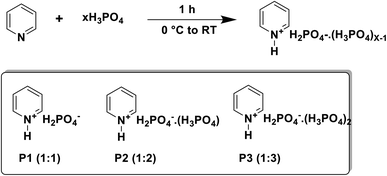
Ionic liquids containing clusters of phosphoric acid molecules and hydrogen phosphate anions (H2PO4−·H3PO4) were synthesized by the method already detailed in the literature.21 One mole of pyridine was treated with different numbers of moles (1, 2 and 3 moles) of 85% H3PO4. The acid was added drop-wise to vigorously stirred pyridine at low temperatures (0–5 °C). The resulting solid was stirred for 1 hour at room temperature to ensure complete protonation of the amine. Very good yields (85–95%) of ionic liquids were obtained, which needed no further purification. Scheme 1 shows the chemical reaction of the synthesis and general structures and composition of different ionic liquids having varying moles of H3PO4.H NMR data of the synthesized ionic liquids
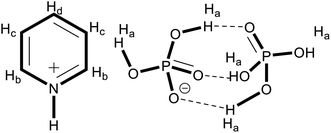
For the position of protons denoted in the H NMR data, refer to Fig. 1.1H NMR (DMSO-d6, 400 MHz): P1: δ 8.5–8.6 (2H, d, Hb), 7.8–7.9 (2H, m, Hc), δ 7.4–7.5 (1H, m, Hd), 8.3 (br, Ha); P2: δ 8.5–8.6 (2H, m, Hb), 8.0–8.1 (1H, m, Hd), 7.4–7.5 (2H, m, Hc), 10.1–10.6 (br, Ha); P3: δ 8.6–8.7 (2H, d, Hb), 8.1–8.2 (1H, m, Hd), 7.6–7.7 (2H, m, Hc), 10.5–10.6 (br, Ha).
The 1H NMR spectra are provided in the ESI,† and the discussion on NMR peaks and structure elucidation of the ILs is given in the Result and discussion section.
Pretreatment of wheat straw and rice straw
Wheat straw and rice husk samples were ground to a powder form using a domestic grinder and the required particle sizes were obtained through mesh sieves (40, 60 and 150 mesh size). The samples of various particle sizes (100 μm, 250 μm and 500 μm) in different percentages (5%, 10%, 15% and 20%) were loaded in preheated ionic liquids (70°C–100 °C) and allowed to stir using a magnetic stirrer. Pretreatment was performed for a period of 30, 60, 90, and 120 minutes at different temperatures (70–100 °C) using a hot plate.Separation of lignin and cellulose rich material
After pretreatment, the anti-solvent mixture (1![[thin space (1/6-em)]](https://www.rsc.org/images/entities/char_2009.gif) :
:![[thin space (1/6-em)]](https://www.rsc.org/images/entities/char_2009.gif) 1) of acetone and water (nine times the volume of mixture) was added to the reaction vessel and the mixture was stirred for half an hour to ensure complete dissolution of lignin. Cellulose rich part, which settled down during this stirring, was filtered off, and it was air dried. Acetone was evaporated from the filtrate at room temperature to precipitate lignin that precipitated in brown solid form. This was later washed three times with deionized water to remove the ionic liquid. The lignin was separated from the ionic liquid-water mixture by centrifugation. The resultant solid was dried using a freeze drier.
1) of acetone and water (nine times the volume of mixture) was added to the reaction vessel and the mixture was stirred for half an hour to ensure complete dissolution of lignin. Cellulose rich part, which settled down during this stirring, was filtered off, and it was air dried. Acetone was evaporated from the filtrate at room temperature to precipitate lignin that precipitated in brown solid form. This was later washed three times with deionized water to remove the ionic liquid. The lignin was separated from the ionic liquid-water mixture by centrifugation. The resultant solid was dried using a freeze drier.
Compositional analysis
To know the composition of untreated biomass and pretreated pulp samples, compositional analysis was conducted following the method in the protocol set by NREL.22 The method included digestion of the biomass samples with 72% sulfuric acid in an ultrasonic water bath followed by heating in an autoclave under specific pressure. The analysis of sugars and lignin was made according to the given reference. Detailed description of the process is provided in the ESI.†Saccharification
The cellulose-rich material obtained from pretreatment was hydrolyzed using enzymes to evaluate the glucose release. The samples were incubated using Ctec Novozymes (NS-22201) at 50 °C for 7 days at a speed of 250 rpm. The detail of saccharification is also provided in the ESI.†Characterization
Ionic liquids, untreated biomass, pretreated samples (CRM) and extracted lignin were characterized using various analytical techniques including HNMR, HSQC, FT-IR, SEM and compositional analysis. The Fourier transform infra-red spectroscopy was carried out using Agilent Cary 630 FTIR and the transmittance against wavenumber (4000 to 650 cm−1) was recorded. The H NMR analysis of the ILs was done on Avance AV-400 MHz with DMSO as the solvent. HSQC analysis of the extracted lignin was also performed. For this purpose, a Bruker 600 MHz spectrometer (pulse sequence hsqcetgpsi2, a spectral width of 10 ppm in F2 (1H) having 2048 data points and for 13C 160 ppm in F1 with 256 data points, 16 scans and 1 s inter-scan delay) was used. GPC analysis was conducted using an Agilent 1260 Infinity machine equipped with a Viscotek column set (AGuard, A6000M and A3000M). Agilent 1260 Infinity RID detector was used for the signal monitoring. To prepare samples for GPC analysis, each of extracted lignin (20 mg) was dissolved in DMSO (GPC grade) and an aqueous solution of LiBr (eluent, 1 g L−1). The resultant mixture was then filtered using a syringe having a 0.2 μm filter. The sample flow rate was 0.4 mL min−1 at 60 °C. Ten pullulan standards (Agilent calibration kit, 180 < Mp < 780![[thin space (1/6-em)]](https://www.rsc.org/images/entities/char_2009.gif) 000) were employed to calibrate the instrument. For surface analysis, a scanning electron microscope (Model VEGA TESCON) was used with different values of pressure and gold sputtering (magnification 200, 3000×).
000) were employed to calibrate the instrument. For surface analysis, a scanning electron microscope (Model VEGA TESCON) was used with different values of pressure and gold sputtering (magnification 200, 3000×).
Results and discussion
NMR analysis of ionic liquids
Previous studies have reported the formation of clusters in solutions of ionic liquids and the corresponding acids.21,23 Fig. 1 contains the general structure of clustered ionic liquids, and different protons were named Ha, Hb, and Hc. The corresponding peaks for these protons are labeled in the H NMR spectra of the ILs. The signals designated as “a” correspond to OH protons in the clusters between the anion and molecular H3PO4. The labels “b”, “c” and “d” represent the aromatic protons, while “b” is closest to the ring nitrogen and d the farthest and is the middle proton.The most important segment of the spectra is the peaks for OH protons in the clusters. The position and integration of the singlet for these protons in all the spectra are different. This is because of the formation of hydrogen bonds between the molecules of H3PO4 and the anion H2PO4−. The integration of this signal (at δ 10.382) in P2 is almost double as compared to the intensity of this peak (at δ 8.306) in the spectrum of P1. The variation in chemical shift is due to the formation of hydrogen bonds between the phosphate anion and molecules of additional moles of phosphoric acid. This is due to additional moles of H3PO4 (1![[thin space (1/6-em)]](https://www.rsc.org/images/entities/char_2009.gif) :
:![[thin space (1/6-em)]](https://www.rsc.org/images/entities/char_2009.gif) 2), which is responsible for the formation of cluster, as shown in Fig. 1.
2), which is responsible for the formation of cluster, as shown in Fig. 1.
Similarly, in case of P3 the signal for OH (at δ 10.354) has three times higher intensity than that in P1, thus showing the presence of two extra moles of acidic protons on the clusters making hydrogen bonds with the hydroxyl group and negatively charged oxygen atoms of the anion.
Compositional analysis and biomass characteristics
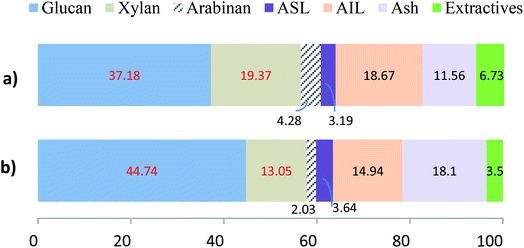
The compositional analysis of the original biomass and the pretreated samples was conducted following the standard protocol established at NREL.22 The composition of the untreated wheat straw and rice husk is demonstrated by the graphs in Fig. 2. It can be observed that the content of lignin in wheat straw is 21.86% (sum of 3.19% ASL and 18.67% AIL) and that in rice husk is 17.56% (sum of ASL and AIL) while that of glucan is 37.18 and 44.74% respectively. Total hemicellulose (xylan plus arabinan) in wheat straw is 23.65% and in rice husk 15.08%.The lignin removal from the biomass, as a result of pretreatment, was calculated by comparing this content in the treated biomass (Table 1) with that in the untreated biomass (Fig. 2) using the following formula:
| Ionic liquid | Biomass | Glucan (%) | Hemicellulose (%) | Lignin (%) | Ash (%) | Mass loss (%) |
|---|---|---|---|---|---|---|
| P1 | Wheat straw | 41.8 | 11.17 | 11.14 | 10.2 | 25.69 |
| Rice husk | 43.6 | 7.66 | 10.80 | 16.4 | 21.54 | |
| P2 | Wheat straw | 44.6 | 9.10 | 7.98 | 9.1 | 29.22 |
| Rice husk | 48.5 | 5.48 | 6.65 | 15.8 | 23.57 | |
| P3 | Wheat straw | 46.9 | 5.16 | 4.49 | 10.8 | 32.35 |
| Rice husk | 46.4 | 4.46 | 4.76 | 14.4 | 29.98 |
From the results, it is apparently observed that lignin removal for both wheat straw (77%) and rice husk (78%) is comparable. Although lignin content in the original wheat straw (21.86%) is higher than that in rice husk (17.56%), the extent of lignin removal is almost the same, indicating relatively facile removal of lignin from wheat straw. A comparison of the composition of the untreated and pretreated samples of wheat straw indicates that the glucan content is slightly higher in rice husk in each case. Moreover, the hemicellulose removal from rice husk (81%) is more prominent than that from wheat straw (68%). However, the pretreatment of the rice husk is characterized by much higher mass loss.
Effect of conditions on lignin extraction
Clustered ionic liquids were employed for delignification of two types of biomass: wheat straw and rice husk. The processing of biomass was conducted under varying conditions of temperature, time, biomass loading and particle size of biomass. The lignin yields were calculated as the percentage of lignin in untreated wheat straw and rice husk.The percent yield of extracted lignin was calculated relative to the amount of lignin in the original biomass (theoretical maximum) using the following formula:
A discussion of effect of different pretreatment conditions is elaborated under the following sub-sections.
Effect of temperature and time
It is well established that with the elevation of temperature or dilation of time, the extent of pretreatment is enhanced.11,24 However, there is always a threshold beyond which either the yield of pulp and glucose or yield of lignin is negatively affected.25 In concurrence with the findings in the literature, the ILs used in our study also exhibited the same trend. It can be seen in the graphs (Fig. 3) that for both of wheat straw and rice husk the lignin yield increased with the increase in temperature. However, the results after 100 °C are not shown, as the yield started to descend exponentially and the quality of the delignified pulp was also low. It is also obvious that the yield of lignin from wheat straw is relatively high. The peak yield of lignin corresponds to 100 °C after pretreatment for 2 hours, where it is 73% for wheat straw and 72% for rice husk. The findings in this study are coherent with the literature, where it is found that rice husk has lower lignin content but the extent of delignification of rice husk is comparable to that of wheat straw.26 It was noted that above 100 °C, the quality of lignin and pulp was more badly affected in case of rice husk, which is apparently due to its relatively complex network structure. The delignification, though, did not affect the glucan recovery and it seemed to be quantitative compared to the glucan content in the original biomass. It can be noted from Table 1 that the corresponding amounts of glucan under all temperature conditions were appreciably good. Ionic liquid P3 afforded the maximum delignification and lignin yield, which is apparently due to higher acidic content (3![[thin space (1/6-em)]](https://www.rsc.org/images/entities/char_2009.gif) :
:![[thin space (1/6-em)]](https://www.rsc.org/images/entities/char_2009.gif) 1) in the IL. It is previously known that higher protic content results in more H-bonding ability and better outcome from pretreatment.11,14 However, the previous studies show that most of the ionic liquids are more effective at higher temperatures for longer times24,26 while here it is achieved at 100 °C within two hours.
1) in the IL. It is previously known that higher protic content results in more H-bonding ability and better outcome from pretreatment.11,14 However, the previous studies show that most of the ionic liquids are more effective at higher temperatures for longer times24,26 while here it is achieved at 100 °C within two hours.
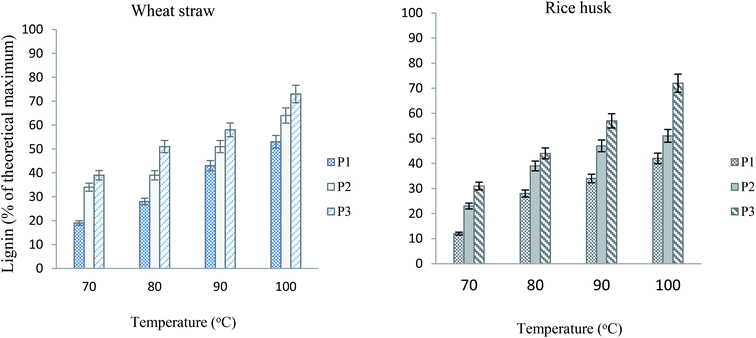 | ||
| Fig. 3 Lignin yields from wheat straw and rice husk at different temperatures after 120 minutes (particle size equals 100 μm, loading 5%). | ||
With the increase in time duration, the extent of pretreatment and the lignin yield was also enhanced as established previously.11,25 The pretreatment was carried out for 30 min to 120 min, and the best yield was obtained at 100 °C after pretreatment for 2 h. Here again, it is worth mentioning that after 2 hours the delignification was not as much effective and it showed degradation of both the cellulose rich material and extracted lignin. A graphical comparison of the lignin yields from wheat straw and rice husk is given in Fig. 4. At different pretreatment time durations, the wheat straw seemed to be relatively more productive and the IL bearing more acidic content (P3) gave the maximum yield. When we compare these results with the previous literature, the yields of lignin and sugars are comparable with the advantage of short-time pretreatment, thus making it a time-effective process. In previous studies, results comparable to ours were achieved for sufficiently longer times (4–24 h).13.
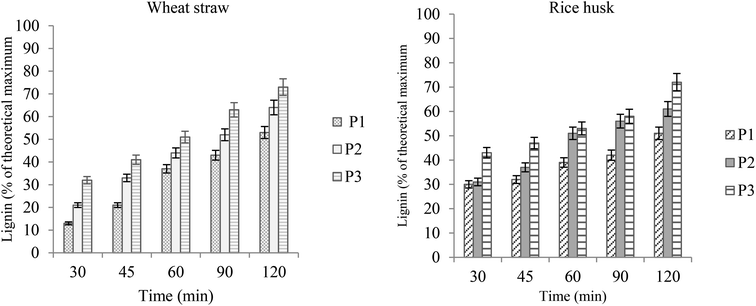 | ||
| Fig. 4 Lignin yields from wheat straw and rice husk after time intervals (100 °C; particle size 100 μm, 5% loading). | ||
Effect of biomass loading and particle size
Low biomass loading is usually more compatible for better pretreatment and effective delignification.27,28 This is reasonable; as the amount of biomass is reduced, the contact of IL with the biomass particles becomes more effective. At higher biomass loadings, the biomass-IL mixture becomes more viscous thus reducing the speed of rotation (stirring) and causing poor contact between the IL and the biomass particles.28 In this case, also, the yields are in agreement with the previous findings. Although the biomass loading as high as 20% did not reduce the efficiency of the ionic liquids, the optimum yield was obtained when 5% biomass was loaded. The type of biomass also did not show much influence on the extent of pretreatment and lignin extraction. However, wheat straw gave slightly more delignified pulp and higher lignin yields. A comparison of lignin yields from wheat straw and rice husk is presented in Fig. 5. It can be observed here that the optimum yield is achieved with 5% biomass loading for both wheat straw (73%) and rice husk (72%). With the same biomass loading, the previous finding showed 81% glucose yield from cellulose-rich material but under relatively harsh conditions.28 With the increase in biomass loading, the delignification also becomes less efficient.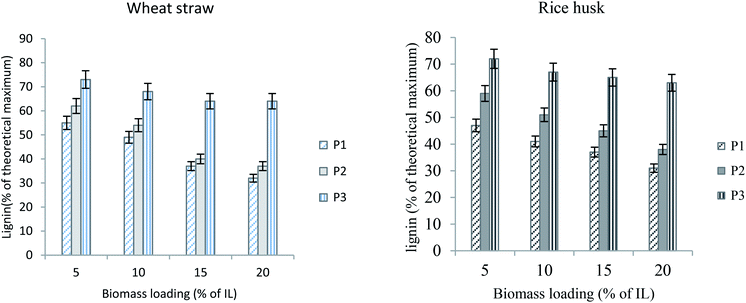 | ||
| Fig. 5 Lignin yields from wheat straw and rice husk with different biomass loadings at 100 °C for 2 h (particle size equals 100 μm). | ||
The particle size of the biomass is also a very important consideration with regard to biomass pretreatment. The large particle size is strongly desired, as it does not require grinding and particle selection prior to processing, thus making the whole process greener in terms of energy and less time consumption.29 Here, we studied the effect of particle size of the biomass along with other factors. Wheat straw and rice husk were used in different particle sizes (100, 250 and 500 μm) obtained from mesh sieves. More effective lignin extraction is achieved with small-sized particles, i.e. 100, and 250 μm. The maximum yield corresponds to 100 μm and this is slightly higher than that afforded by 250 μm particles. The pretreatment of biomass having a particle size of 250 μm results in higher lignin amounts than that having a particle size of 500 μm. This owes to the compatibility of size of interstices in the network of biomass and the size of ions of the IL.29,30 We know that smaller particles can interact with IL molecules through a greater surface area, thus resulting in better delignification of biomass. A comparison of the effect of particle size and the extent of pretreatment (lignin extraction) is exhibited as graphs in Fig. 6.
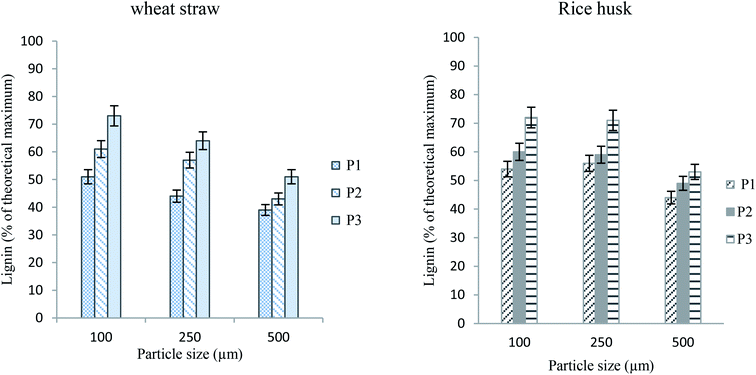 | ||
| Fig. 6 Lignin yields from wheat straw and rice husk having various particle sizes (100 °C, 2 h, 5% loading). | ||
Analysis of biomass and extracted lignin
![[thin space (1/6-em)]](https://www.rsc.org/images/entities/char_2009.gif) :
:![[thin space (1/6-em)]](https://www.rsc.org/images/entities/char_2009.gif) 1) bears relatively weak peaks at 1029 cm−1 and 897 cm−1. This is attributed to the carbohydrate loss during biomass processing with the IL. The peak for the C–O anti-symmetric stretching vibration can be observed at about 1160 cm−1 in both wheat straw and rice husk, while the CH2 symmetric bending is characterized by the peak at 1430 cm−1.32 It is apparent that a reduction in the intensity of this peak occurred in the pretreated samples, which is an indication of reduced crystallinity affected by IL pretreatment.32 The peak at around 1325 cm−1 is assigned to the CH bending vibration in carbohydrates and 1365 cm−1 is assigned to the CH bending vibration in cellulose. The peak at 1506 cm−1 in the spectrum of wheat straw is associated with the conjugated double bonds in aromatic rings present in lignin. Obviously, this peak (1506 cm−1) has appreciably low intensity in the pretreated sample: this is due to the removal of lignin in biomass as a result of pretreatment. The aromatic ring conjugated bond peak is present at around 1530 cm−1 in untreated rice husk, and the spectrum in Fig. 7 shows a reduced signal for this peak in the pretreated sample. Phenolic OH bonds in lignin are characterized by the peak at 1650 cm−1. The intensity of this peak in the pretreated biomass is also lower than that in the untreated sample. Out of all the ionic liquids used, the P3-pretreated sample exhibits the most pronounced reduction in signal intensity of the peaks associated with aromatic vibrations (1506, 1530 and 1650). This is in coherence with the yields of lignin as stated above.
1) bears relatively weak peaks at 1029 cm−1 and 897 cm−1. This is attributed to the carbohydrate loss during biomass processing with the IL. The peak for the C–O anti-symmetric stretching vibration can be observed at about 1160 cm−1 in both wheat straw and rice husk, while the CH2 symmetric bending is characterized by the peak at 1430 cm−1.32 It is apparent that a reduction in the intensity of this peak occurred in the pretreated samples, which is an indication of reduced crystallinity affected by IL pretreatment.32 The peak at around 1325 cm−1 is assigned to the CH bending vibration in carbohydrates and 1365 cm−1 is assigned to the CH bending vibration in cellulose. The peak at 1506 cm−1 in the spectrum of wheat straw is associated with the conjugated double bonds in aromatic rings present in lignin. Obviously, this peak (1506 cm−1) has appreciably low intensity in the pretreated sample: this is due to the removal of lignin in biomass as a result of pretreatment. The aromatic ring conjugated bond peak is present at around 1530 cm−1 in untreated rice husk, and the spectrum in Fig. 7 shows a reduced signal for this peak in the pretreated sample. Phenolic OH bonds in lignin are characterized by the peak at 1650 cm−1. The intensity of this peak in the pretreated biomass is also lower than that in the untreated sample. Out of all the ionic liquids used, the P3-pretreated sample exhibits the most pronounced reduction in signal intensity of the peaks associated with aromatic vibrations (1506, 1530 and 1650). This is in coherence with the yields of lignin as stated above.
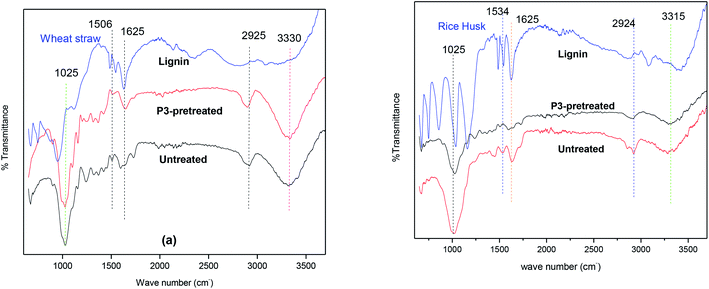 | ||
| Fig. 7 FT-IR spectra of untreated biomass, pretreated biomass and lignin extracted from wheat straw (a) and rice husk (b). | ||
The spectra of lignin extracted from wheat straw (Fig. 7a) and rice husk (Fig. 7b) also show characteristic peaks of lignin. The wavenumbers of significant peaks can be designated with the help of previous reports in the literature.3,33 The most pronounced signals for lignin are the peaks occurring from 1500 to 1600 cm−1, and these are related to the skeletal vibrations of the aromatic ring. It can be seen that lignin extracted from rice husk bears more pronounced intensities of the signals between 1500 and 1600 cm−1. Absorption bands at 1220 cm−1 are ascribed to the C–C stretching vibration combined with C–O and C![[double bond, length as m-dash]](https://www.rsc.org/images/entities/char_e001.gif) O stretching vibrations. The peak at about 1160 cm−1 in the spectra of lignin corresponds to the absorption due to C–H in-plane vibrations and ether linkage (C–O–). The peak signals from 800 to 850 cm−1 show C–H vibrations of guaiacyl units (out of plane) in lignin.
O stretching vibrations. The peak at about 1160 cm−1 in the spectra of lignin corresponds to the absorption due to C–H in-plane vibrations and ether linkage (C–O–). The peak signals from 800 to 850 cm−1 show C–H vibrations of guaiacyl units (out of plane) in lignin.
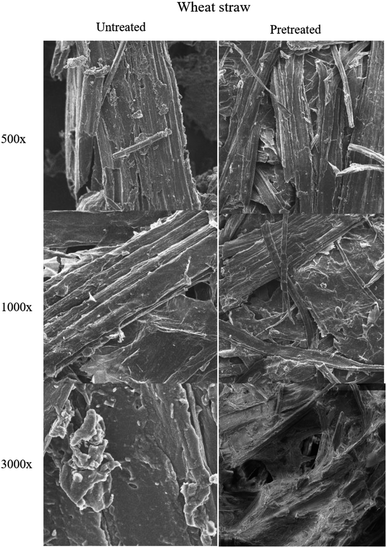 | ||
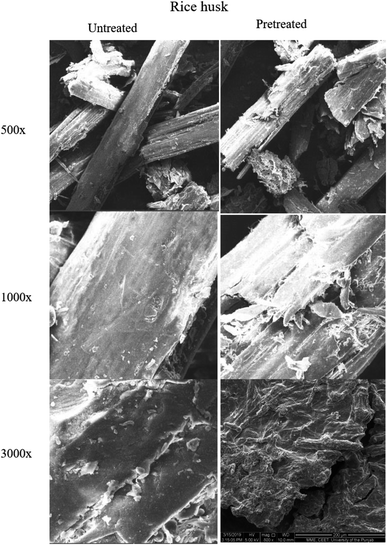
| Fig. 8 Scanning electron microscopic images of untreated and pretreated (using ionic liquid P3) wheat straw samples at different magnifications. | ||
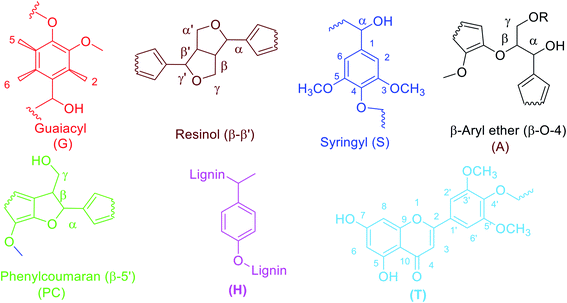
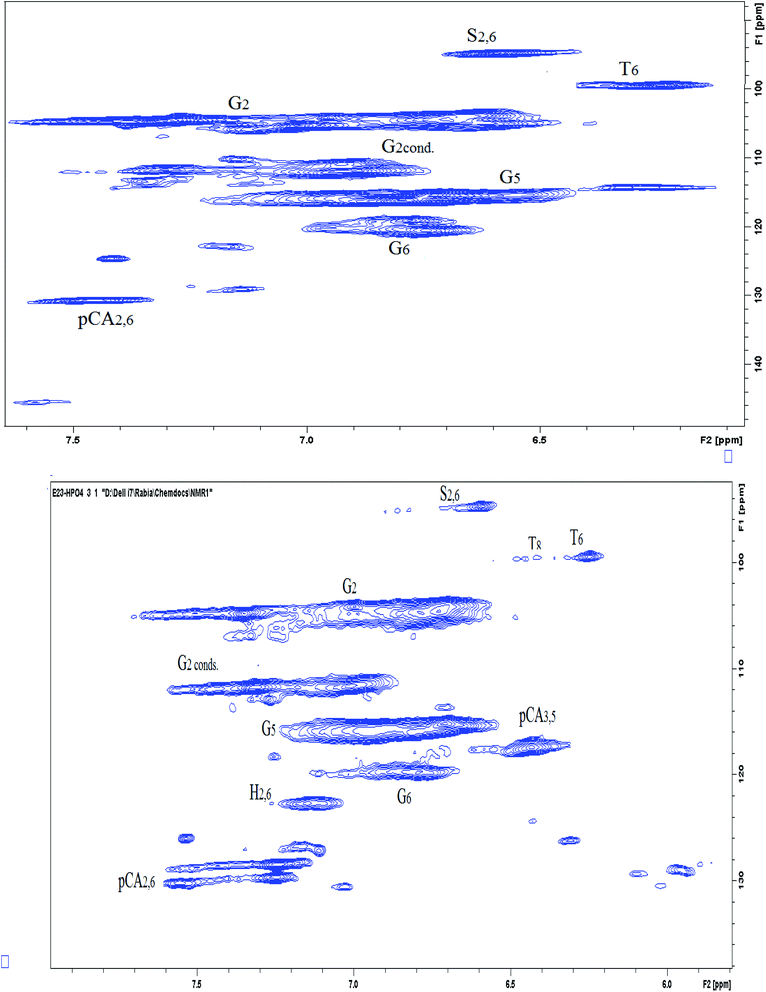
The aromatic portion of the HSQC NMR spectrum (90–150/6.0–7.7 ppm) is given in Fig. 11. The contours of all the anticipated fragments of lignin can be seen apparently in the spectra, where again we find the guaiacyl fragment in relatively high abundance. The aromatic portions of syringyl and phenylcoumarin fractions are also prominently visible at 6.6/95 ppm and 7.4/130 ppm respectively. The peaks assigned to different positions of the guaiacyl fraction of lignin are shown in the spectra. The G2 peak may act as a reference for G2cond., G5 and G6 as reported previously.35 The main reason behind this is that G2 position mostly remains intact from any modification during the delignification process. However, a shift from G2 to G2cond. can take place as a result of modification in the G5 and G6 fragments in which case G2 and G2cond are taken as reference collectively. G2cond, despite having a lower intensity than G5 and G6, indicates that there has occurred a mild condensation at this position. Thus, it shows a mild condensation of lignin during the process unlike the findings in the previous studies.13,36 The G5 position seems to be intact or very little affected during the extraction process, as indicated by the volume integral of its signal in the spectrum labelled as G5. However, G6 has a relatively diminished signal, which exhibits that there has occurred a substitution at this position during the process of extraction. Due to this substitution, there is a transformation of G2 into G2cond. as stated above.12
| Biomass | Mn (Da) | Mw (Da) | PDI |
|---|---|---|---|
| Wheat straw | 1848 | 10![[thin space (1/6-em)]](https://www.rsc.org/images/entities/char_2009.gif) 531 531 |
5.7 |
| Rice husk | 1466 | 8839 | 6.03 |
The Mw and Mn values for wheat straw lignin are higher than those of rice husk lignin, showing less degraded network of wheat straw lignin. However, the PDI value for wheat straw lignin is lower than that of rice straw lignin, which shows more uniform nature of lignin extracted from rice husk.
Saccharification
The pulps obtained from pretreatment of wheat straw and rice husk along with the untreated biomass were subjected to enzymatic saccharification at 50 °C and 250 rpm. The samples were kept under incubation for 7 days and, consequently, analyzed for the concentration of glucose by the HPLC method (Aminex HPX-87P column). The graph in Fig. 12 shows glucose yields from pretreated samples (using ionic liquid P3) after different time durations. The untreated biomass was subjected to saccharification without any treatment. The glucose yield from untreated wheat straw and glucose was found to be 17% and 15% of the theoretical maximum, respectively. The sugar yield is observed to be enhanced with the increase in time of pretreatment at the optimum temperature (100 °C). Wheat straw gave a higher yield of glucose (77%) after a pretreatment for 2 h than rice husk (73%) probably due to higher delignification from wheat straw. This is in accordance with the previous studies, where an increase in saccharification yields with the increase in the extent of delignification is reported.25,32,40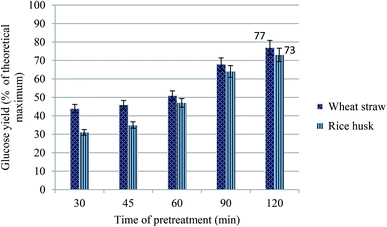 | ||
| Fig. 12 Graph showing glucose yields from enzymatic saccharification (Ctec Novozymes) of different pretreated wheat straw and rice husk samples after 7 days' incubation (50 °C, 250 rpm). | ||
Conclusion
The study showed that pyridinium protic ionic liquids having clusters around the anion H2PO4− are efficient solvents for the extraction of lignin and sugar release from wheat straw and rice husk. Ionic liquids afforded fairly high yields of lignin under mild conditions, while the maximum yield was achieved at 100 °C after 2 h pretreatment using IL having the highest number of moles of phosphoric acid ([Py][H2PO4·H3PO4]). Lignin yield from wheat straw (73%) is slightly higher than that from rice husk (72%). The lignin was analysed by HSQC, FT-IR and gel permeation chromatography (GPC). The delignification was validated by compositional analysis and FT-IR spectra of biomass, which showed a marked difference among the compositions of the untreated and pretreated samples. The SEM analysis indicated effective penetration of the ionic liquid radicals into the biomass polymer network. Quantitative release of glucose through saccharification of delignified wheat straw (77%) and rice husk (73%) further verified effective delignification.Conflicts of interest
We state that there is no conflict of interests among the authors.Acknowledgements
This research was supported by Higher Education Commission of Pakistan (HEC) under the project no. 8639/Punjab/NRPU/R&D/HEC/2017 and TDF03-294. The authors express gratitude to the University of the Punjab for lab facilities for pretreatment. The compositional analysis, HSQC and SEM analysis was conducted at Chemical Engineering Department Imperial College London UK. We pay gratitude for such a generous support and uninterrupted facilitation there.References
- H. Tadesse and R. Luque, Energy Environ. Sci., 2011, 4, 3913–3929 RSC.
- A. Brandt, M. J. Ray, T. Q. To, D. J. Leak, R. J. Murphy and T. Welton, Green Chem., 2011, 13, 2489–2499 RSC.
- R. Prado, X. Erdocia, L. Serrano and J. Labidi, Cellul. Chem. Technol., 2012, 46, 221 CAS.
- N.-E. S. El Mansouri and J. Salvadó, Ind. Crops Prod., 2006, 24, 8–16 CrossRef CAS.
- M. V. Alonso, M. Oliet, F. Rodriguez, G. Astarloa and J. M. Echeverría, J. Appl. Polym. Sci., 2004, 94, 643–650 CrossRef CAS.
- C. L. Williams, C.-C. Chang, P. Do, N. Nikbin, S. Caratzoulas, D. G. Vlachos, R. F. Lobo, W. Fan and P. J. Dauenhauer, ACS Catal., 2012, 2, 935–939 CrossRef CAS.
- P. J. M. Carrott and M. R. Carrott, Bioresour. Technol., 2007, 98(12), 2301–2312 CrossRef.
- H. Lora and W. G. Glasser, J. Polym. Environ., 2002, 10, 39–48 CrossRef.
- A. M. Asim, M. Uroos, S. Naz, M. Sultan, G. Griffin, N. Muhammad and A. S. Khan, J. Mol. Liq., 2019, 110943 CrossRef CAS.
- A. M. da Costa Lopes, K. G. João, E. Bogel-Łukasik, L. B. Roseiro and R. Bogel-Łukasik, J. Agric. Food Chem., 2013, 61, 7874–7882 CrossRef CAS.
- E. C. Achinivu, R. M. Howard, G. Li, H. Gracz and W. A. Henderson, Green Chem., 2014, 16, 1114–1119 RSC.
- A. Brandt, L. Chen, B. E. van Dongen, T. Welton and J. P. Hallett, Green Chem., 2015, 17, 5019–5034 RSC.
- A. Brandt-Talbot, F. J. Gschwend, P. S. Fennell, T. M. Lammens, B. Tan, J. Weale and J. P. Hallett, Green Chem., 2017, 19, 3078–3102 RSC.
- P. Verdía, A. Brandt, J. P. Hallett, M. J. Ray and T. Welton, Green Chem., 2014, 16, 1617–1627 RSC.
- T. C. Pin, P. Y. Nakasu, S. Mattedi, S. C. Rabelo and A. C. Costa, Fuel, 2019, 235, 1506–1514 CrossRef CAS.
- I. Semerci and F. Güler, Ind. Crops Prod., 2018, 125, 588–595 CrossRef CAS.
- E. S. Sashina, D. A. Kashirskii and K. N. Busygin, Cellul. Chem. Technol., 2016, 50, 199–211 CAS.
- K. M. Docherty, J. K. Dixon and C. F. Kulpa Jr, Biodegradation, 2007, 18, 481–493 CrossRef CAS.
- D. J. Couling, R. J. Bernot, K. M. Docherty, J. K. Dixon and E. J. Maginn, Green Chem., 2006, 8, 82–90 RSC.
- H. Gao, M. Luo, J. Xing, Y. Wu, Y. Li, W. Li, Q. Liu and H. Liu, Ind. Eng. Chem. Res., 2008, 47, 8384–8388 CrossRef CAS.
- K. Matuszek, A. Chrobok, F. Coleman, K. R. Seddon and M. Swadźba-Kwaśny, Green Chem., 2014, 16, 3463–3471 RSC.
- A. Sluiter, B. Hames, R. Ruiz, C. Scarlata, J. Sluiter, D. Templeton and D. Crocker, Determination of structural carbohydrates and lignin in biomass, Laboratory analytical procedure TP-510-42618, 2010 Search PubMed.
- G.-L. Hou, W. Lin, S. Deng, J. Zhang, W.-J. Zheng, F. Paesani and X.-B. Wang, J. Phys. Chem. Lett., 2013, 4, 779–785 CrossRef CAS.
- A. Brandt, J. Gräsvik, J. P. Hallett and T. Welton, Green Chem., 2013, 15, 550–583 RSC.
- A. Brandt-Talbot, F. J. Gschwend, P. S. Fennell, T. M. Lammens, B. Tan, J. Weale and J. P. Hallett, Green Chem., 2017, 19(13), 3078–3102 RSC.
- S. K. Singh and P. L. Dhepe, Clean Technol. Environ. Policy, 2018, 20, 739–750 CrossRef CAS.
- A. G. Pinkert, D. F. Goeke, K. N. Marsh and S. Pang, Green Chem., 2011, 13(11), 3124–3136 RSC.
- C. Zhang, W. Xu, P. Yan, X. Liu and Z. C. Zhang, Process Biochem., 2015, 50, 2208–2214 CrossRef CAS.
- A. Pinkert, D. F. Goeke, K. N. Marsh and S. Pang, Green Chem., 2011, 13, 3124–3136 RSC.
- N. Muhammad, Z. Man, Y. A. Elsheikh, M. A. Bustam and M. A. Mutalib, J. Chem. Eng. Data, 2014, 59, 579–584 CrossRef CAS.
- M. L. Nelson and R. T. O'Connor, J. Appl. Polym. Sci., 1964, 8, 1325–1341 CrossRef CAS.
- S.-J. Dong, B.-X. Zhang, Y.-F. Gao and X.-M. Hu, Int. J. Polym. Sci., 2015, 2015, 978983 Search PubMed.
- A. Casas, M. V. Alonso, M. Oliet, E. Rojo and F. Rodríguez, J. Chem. Technol. Biotechnol., 2012, 87, 472–480 CrossRef CAS.
- F. Zikeli, T. Ters, K. Fackler, E. Srebotnik and J. Li, Ind. Crops Prod., 2014, 61, 249–257 CrossRef CAS.
- M. Sette, R. Wechselberger and C. Crestini, Chem.–Eur. J., 2011, 17, 9529–9535 CrossRef CAS.
- F. J. Gschwend, C. L. Chambon, M. Biedka, A. Brandt-Talbot, P. S. Fennell and J. P. Hallett, Green Chem., 2019, 21, 692–703 RSC.
- M. E. Himmel, K. K. Oh, D. R. Quigley and K. Grohmann, J. Chromatogr. A., 1989, 467, 309–314 CrossRef CAS.
- R. El Hage, N. Brosse, P. Sannigrahi and A. Ragauskas, Polym. Degrad. Stab., 2010, 95, 997–1003 CrossRef CAS.
- S. Bauer, H. Sorek, V. D. Mitchell, A. B. Ibáñez and D. E. Wemmer, J. Agric. Food Chem., 2012, 60, 8203–8212 CrossRef CAS.
- A. George, A. Brandt, K. Tran, S. M. N. S. Zahari, D. Klein-Marcuschamer, N. Sun, N. Sathitsuksanoh, J. Shi, V. Stavila and R. Parthasarathi, Green Chem., 2015, 17, 1728–1734 RSC.
- R. C. M. deMiranda, J. V. Neta, L. F. R. Ferreira, W. A. G. Júnior, C. S. do Nascimento, E. d. B. Gomes, S. Mattedi, C. M. F. Soares and Á. S. Lima, Carbohydr. Polym., 2019, 206, 302–308 CrossRef.
Footnote |
| † Electronic supplementary information (ESI) available. See DOI: 10.1039/d0ra09098k |
| This journal is © The Royal Society of Chemistry 2020 |

