 Open Access Article
Study of the Fischer–Tropsch synthesis on nano-precipitated iron-based catalysts with different particle sizes
Zhonghao Han a,
Weixin Qiana,
Hongfang Maa,
Xian Wua,
Haitao Zhang
 *a,
Qiwen Sunb and
Weiyong Ying
 a
a
aEngineering Research Center of Large Scale Reactor Engineering and Technology, Ministry of Education, State Key Laboratory of Chemical Engineering, School of Chemical Engineering, East China University of Science and Technology, Shanghai 200237, China. E-mail: zht@ecust.edu.cn; Fax: +86 21 64252192; Tel: +86 21 64252151
bState Key Laboratory of Coal Liquefaction and Coal Chemical Technology, Shanghai 201203, China
First published on 26th November 2020
Abstract
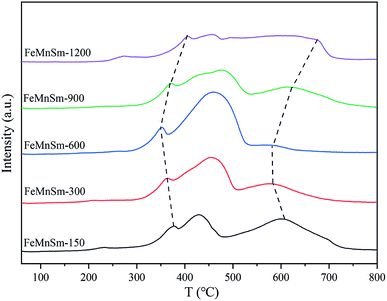
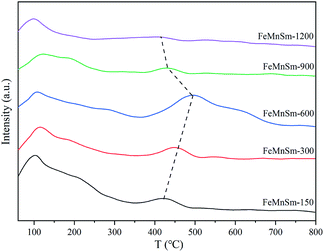
Nano iron-based catalysts with different particle sizes were prepared by a co-precipitated method and characterized by XRD, N2 adsorption, SEM, Mössbauer spectroscopy, XPS, H2-TPR, CO-TPD, H2-TPD and TGA. The CO-TPD results revealed that large particle sizes of catalysts were not conducive to the adsorption of CO, and exhibited low activity of FTS. The decrease of catalyst particle size enhanced the interaction between Fe and Mn, and promoted the CO chemical adsorption and the formation of Fe5C2, but the hydrogenation reaction was inhibited as confirmed by H2-TPD. When the particle size continued to decrease, Mössbauer spectroscopy showed that MnFe2O4 appeared in the catalyst phase, which hindered the reduction of catalysts and the adsorption of feed gas. Overall, the sample FeMnSm-600 showed the highest C![[double bond, length as m-dash]](https://www.rsc.org/images/entities/char_e001.gif) 2–4 selectivity of 33% at the highest CO conversion of 79% during the reaction conditions of 300 °C, 1.0 MPa, 12
2–4 selectivity of 33% at the highest CO conversion of 79% during the reaction conditions of 300 °C, 1.0 MPa, 12![[thin space (1/6-em)]](https://www.rsc.org/images/entities/char_2009.gif) 000 mL (g h)−1, and H2/CO = 2.
000 mL (g h)−1, and H2/CO = 2.
1. Introduction
The increasing depletion of fossil energy resources has attracted societal awareness of environmental protection. Therefore, as an important chemical product, the production method of low-carbon olefin (C![[double bond, length as m-dash]](https://www.rsc.org/images/entities/char_e001.gif) 2–4) has been increasingly restricted.1 Thus, the Fischer–Tropsch synthesis (FTS) has gained more and more attention. FTS is a chemical reaction process that has been proved to be feasible to synthesize CO and H2 into liquid fuel and gaseous hydrocarbon devoid of sulfur, nitrogen or aromatic compounds.2 Co and Fe are common FTS catalysts. Cobalt-based catalysts are suitable for the production of liquid fuels and paraffins due to low methane selectivity and high chain growth probability.3 Compared with Co catalysts, Fe-based catalysts are low cost, and suitable for high temperature Fischer–Tropsch syntheses (HTFT) with a wider product distribution.4 Iron-based catalysts are mostly used for the preparation of low-carbon olefins (FTO).
2–4) has been increasingly restricted.1 Thus, the Fischer–Tropsch synthesis (FTS) has gained more and more attention. FTS is a chemical reaction process that has been proved to be feasible to synthesize CO and H2 into liquid fuel and gaseous hydrocarbon devoid of sulfur, nitrogen or aromatic compounds.2 Co and Fe are common FTS catalysts. Cobalt-based catalysts are suitable for the production of liquid fuels and paraffins due to low methane selectivity and high chain growth probability.3 Compared with Co catalysts, Fe-based catalysts are low cost, and suitable for high temperature Fischer–Tropsch syntheses (HTFT) with a wider product distribution.4 Iron-based catalysts are mostly used for the preparation of low-carbon olefins (FTO).
Fischer–Tropsch synthesis with Fe catalysts has been a hot topic in recent decades. Pure iron catalysts have a poor effect but a promoter could significantly improve the performance of the catalyst.5 Mn is considered to be the most common FTO promoter. Research has shown that with the addition of Mn, both the activity and olefin selectivity of FTS could be improved.6,7 Some studies have shown that Mn can increase the stability of iron-based catalysts and prolong their service life.8 Mn has also shown to promote the formation of iron carbide and thus increase the activity of FTS.9 Other promoters, especially rare earth metal promoters, have been less studied. Investigations have revealed that rare earth metal promoters could restrain the hydrogenation but enhance the adsorption and dissociation of CO, promoting higher gasoline and middle fractions selectivity and obvious inhibition of both methane and wax formation.10 It has been proved that the addition of a small amount of rare earth metals to catalysts can significantly improve the FTS performance, while excessive addition would be detrimental.11,12
Nano catalysts have been gradually studied in recent years due to their unique properties. Compared with traditional catalysts, the nano catalysts showed higher FTS activity and water–gas shift reaction (WGS) activity.13 In addition, nano iron-based catalysts have been proved to achieve a higher selectivity of low olefins.14 It is also considered that the co-precipitated iron-based catalysts would not facilitate the adsorption and the dissociation of CO and the formation of Fe5C2, which has been considered the active phase of FTS.11 Park et al. studied the influence of the particle size of supported Fe/Al nano catalysts used in FTS.19 It was found that the large particle catalysts contributed to the formation of C5+, while the small particle catalysts were difficult to reduce, so there was a suitable particle size for FTO. It was concluded that for small particles, a dramatic increase could be observed for the surface residence times of reversibly bonded CHx and OHx intermediates, whereas a sharp decrease could be observed for the CO residence time.15 Similar results have been confirmed on the small particle catalysts in which the CO coverage decreased while the H coverage increased, which would reduce the carbon chain growth probability, leading to an increase of CH4 selectivity.16
The FTS nano iron-based catalysts are usually prepared by impregnation, hydrothermal synthesis and solvothermal synthesis. However, these methods are complex in operation, high in cost and low in preparation efficiency. In our study, FeMnSm catalysts with different particle sizes were prepared by a co-precipitation method. The influence and effects of different particle sizes on the Fischer–Tropsch synthesis reaction were analyzed and discussed. All catalysts were examined by X-ray diffraction (XRD), N2-adsorption, scanning electron microscopy (SEM), Mössbauer spectroscopy (MES), X-ray photoelectron spectroscopy (XPS), temperature programmed reduction (TPR), temperature programmed desorption (TPD) and thermogravimetric analysis (TGA). All catalysts were performed in a fixed bed reactor.
2. Experimental
2.1. Chemicals
Iron(III) nitrate nonahydrate (>99.99 wt% Shanghai Macklin Biochemical Co., Ltd), manganese nitrate (50 wt% Shanghai Macklin Biochemical Co., Ltd), samarium(III) nitrate hexahydrate (>99.99 wt% Shanghai 3A Chemical Co., Ltd) and anhydrous sodium carbonate (>99.99 wt% Shanghai Macklin Biochemical Co., Ltd) were purchased. Deionized water was used for all experiments.2.2. Catalyst preparation
All nano iron-based catalysts were prepared by a co-precipitated method. Briefly, Fe(NO3)3·9H2O (12.2 g), 50% Mn(NO3)2 (1.06 g), and Sm(NO3)3·6H2O (0.13 g) were dissolved in X mL deionized water (X = 150, 300, 600, 900, and 1200). Na2CO3 used as precipitant was prepared in a 0.2 mol L−1 solution and was dripped into the mixed solution at a rate of 2 mL min−1 until the pH value reached 8.0 ± 0.3. The whole process was kept at a high speed of stirring to avoid localized supersaturation of the solution. The stirring was continued for 0.5 h and aged for 1 h. After washing, filtration and drying, the precipitate was treated at 550 °C in air atmosphere for 3 h. Samples were labeled as FeMnSm-150, FeMnSm-300, FeMnSm-600, FeMnSm-900, and FeMnSm-1200, respectively.2.3. Catalyst characterization
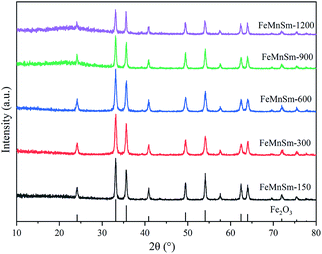
The compositions of the catalysts were measured by X-ray powder diffractometer. The XRD patterns of samples were obtained at 40 kV and 100 mA, with Cu Kα radiation (λ = 0.154 nm) and a scanning rate of 6° min−1 and a 2θ angle ranging from 10 to 80°.The contents of Mn, Fe, and Sm in all fresh and reacted samples were quantified by inductively coupled plasma atomic emission spectroscopy (ICP-AES), which were performed on the Agilent 725ES instrument.
The BET surface area, pore volume, and average pore size distribution of the samples were determined by a Micromeritics ASAP 2020 automated system during N2 physical adsorption–desorption at 77 K. Before the adsorption measurement, all samples were evacuated at 120 °C for 4 h. Specific surface areas were measured by the Brunauer–Emmett–Teller (BET) method. Pore volumes and pore sizes were measured by the Barrett–Joyner–Halenda (BJH) procedure.
Scanning electron microscopy (SEM) images were recorded using an Inspect F50 (FEI). Before each measurement, the sample was ground to below 200 mesh and a small amount of it was ultrasonically dispersed in anhydrous ethanol for 10 min.
The Mössbauer spectroscopy (MES) of catalyst samples was investigated on an MR-351 constant-acceleration Mössbauer spectrometer (FAST, Germany) at room temperature by 57Co in a Pd matrix. The spectra were collected over 512 channels in the mirror image format. Mössbauer parameters including isomer shift (IS), quadruple splitting (QS), and hyperfine field (Hhf) were used to identify the components of the iron phase. The reacted samples were kept in nitrogen atmosphere to avoid oxidation before measurement.
X-ray photoelectron spectroscopy (XPS) measurements were performed on a VG ESCALAB 250Xi electron spectrometer equipped with a hemispherical analyzer operated in a constant pass energy mode, and an Al Kα X-ray source operated at 10 mA and 12 kV. The samples were reduced by H2 at 350 °C for 10 h, and kept in nitrogen atmosphere to avoid oxidation before measurement.
The H2-TPR of the fresh catalysts was carried out in a conventional atmospheric quartz flow reactor by Micromeritics Autochem 2920 apparatus with a thermal conductivity detector (TCD). About 50 mg catalysts were purged in a flow of He at 350 °C for 2 h, then cooled to 60 °C. Each sample was treated in 10% H2/90% Ar (v/v) at a flow rate of 50 mL min−1, and the reduction temperature was heated from room temperature to 800 °C at the rate of 10 °C min−1.
The CO-TPD was carried out using a Micromeritics Autochem 2920 apparatus with a thermal conductivity detector (TCD). About 100 mg samples were pre-reduced in H2 flow at 350 °C for 2 h and were cooled to 60 °C under He gas flow. Afterwards, 5% CO/95% He (v/v) were introduced into the catalyst bed for 30 min, and then the catalyst bed was purged by He flow for 60 min. Subsequently, the samples were heated up to 800 °C at a rate of 10 °C min−1, while the desorbed products were detected with the TCD detector.
The H2-TPD was carried out using a Micromeritics Autochem 2920 apparatus with a thermal conductivity detector (TCD). About 100 mg samples were pre-reduced in H2 flow at 350 °C for 2 h and were cooled to 60 °C under He gas flow. Afterwards, H2 were introduced into the catalyst bed for 30 min, and then the catalyst bed was purged by He flow for 60 min. Subsequently, the samples were heated up to 800 °C at a rate of 10 °C min−1, while the desorbed products were detected with the TCD detector.
Thermogravimetric analysis (TGA) was carried out using a thermal analysis system (TGA-4000, PerkinElmer). The sample was heated from room temperature to 800 °C with a heating rate of 10 °C min−1 in air (50 mL min−1).
2.4. FTS performance
The FTS performance of the catalysts was conducted in a fixed bed reactor (ID = 10 mm). The particle size of the catalysts was 60–80 mesh, and 0.3 g of catalyst sample was mixed with 0.6 g of the same particle size quartz grains. The catalysts were reduced with H2 at 350 °C, 0.10 MPa, and GHSV 4000 mL (g h)−1 for 10 h. The FTS catalyst activity tests were maintained at 300 °C, 1.0 MPa, H2/CO = 2 and 12![[thin space (1/6-em)]](https://www.rsc.org/images/entities/char_2009.gif) 000 mL (g h)−1. After FTS reaction, the outlet gases CO, H2, CH4, etc., were analyzed by an online GC Agilent 7890A with a thermal conductivity detector (TCD). The waxes were dissolved in CS2 and the oils were detected off-line by GC Agilent 7890A with a flame ionization detector (FID).
000 mL (g h)−1. After FTS reaction, the outlet gases CO, H2, CH4, etc., were analyzed by an online GC Agilent 7890A with a thermal conductivity detector (TCD). The waxes were dissolved in CS2 and the oils were detected off-line by GC Agilent 7890A with a flame ionization detector (FID).
3. Results and discussion
3.1. Catalysts characterization
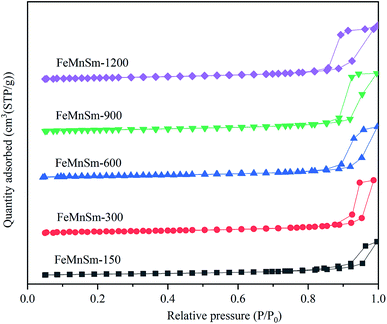
The structural properties and textures of all catalysts were characterized by N2 physisorption, and the results of the N2 physical adsorption–desorption isotherms for nano FeMnSm catalysts are shown in Fig. 2. It could be found that type IV isotherms exist in all samples, which are typical for mesoporous particles. None of the five catalysts show a significant increase in N2 uptake until the relative pressure (P/P0) increased to 0.85, and raised rapidly when P/P0 was above 0.85. Such results also revealed the existence of large macropores and mesopores.17 Such pore structures could reduce the diffusion resistance of feed gas and product, improving the activity of catalyst in FTS. Therefore, the contact time between syngas and catalyst is shortened, which is not helpful for increasing the species concentration (–CH2–).18 These properties show that the precipitated FeMnSm nano catalysts were not beneficial to the carbon chain growth.
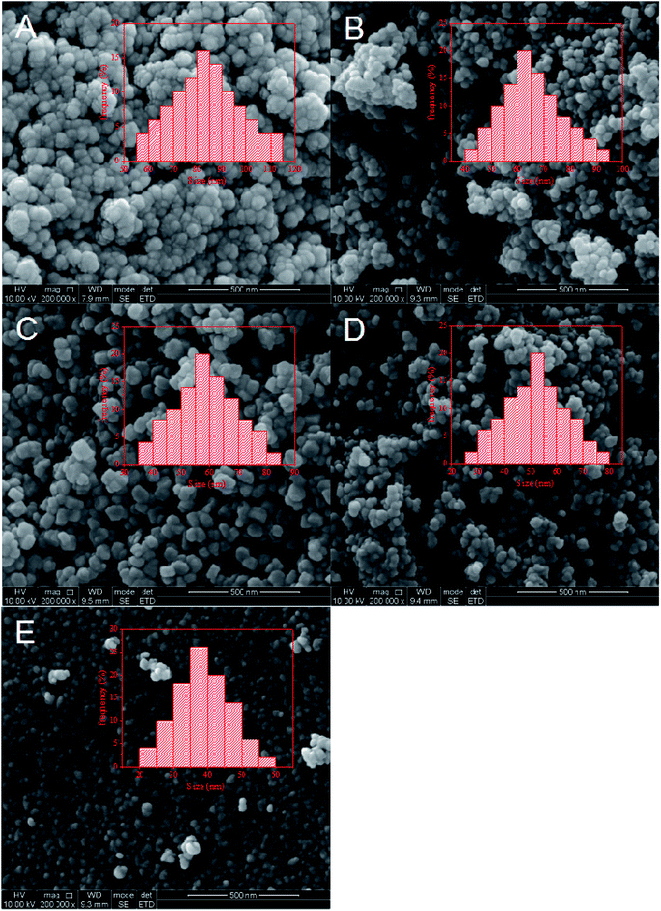
BET surface area, pore volume and average pore size of the fresh catalysts with different particle sizes are shown in Table 1. It can be seen that the BET results gradually increase with the increase of water content of the solution. According to Fig. 1, the pore structures of the five catalysts were similar, so it can be inferred that the lower concentration solution will be conducive to the formation of smaller particles of catalysts. When the volume of added deionized water increased from 150 to 600 mL, both samples' average pore sizes and pore volume increased. This may be due to the reduction of catalyst particle sizes and the large BET surface area. As the volume of water increased to 1200 mL, the sample average pore sizes decreased to 17.7 nm. This may be because when the catalyst particle size was too small, it was easy to form Fe2MnO3 and block the catalyst channels, resulting in the reduction of its pore size.19 This will be further discussed with the H2-TPR and MES results. Besides, no significant changes were observed in the pore volume, which may be due to the interaction of catalyst particle size and pore size.
| Catalyst | Fe/Mn/Sm molar ratio of samplea | BET surface area (m2 g−1) | Pore volume (cm3 g−1) | Average pore size (nm) | Particle sizeb (nm) | |
|---|---|---|---|---|---|---|
| Fresh | Reacted | |||||
| a Determined by ICP.b Determined by SEM. | ||||||
| FeMnSm-1200 | 100/11/1 | 100/11/1 | 34.5 | 0.20 | 17.7 | 38.33 |
| FeMnSm-900 | 100/10/1 | 100/10/1 | 33.2 | 0.21 | 20.9 | 53.56 |
| FeMnSm-600 | 100/10/1 | 100/10/1 | 26.8 | 0.23 | 25.3 | 60.58 |
| FeMnSm-300 | 100/10/1 | 100/10/1 | 22.6 | 0.22 | 22.9 | 67.75 |
| FeMnSm-150 | 100/10/1 | 100/10/1 | 19.9 | 0.21 | 21.0 | 83.16 |
As a surface-controlled process, FTS was affected by the size and shape of iron-based catalysts. SEM was carried out to study the morphology, structure and particle size of the catalysts. Fig. 3 shows the SEM images of the five catalysts. As shown in Fig. 3A and B, a huge amount of Fe nanoparticles with inhomogeneous sizes were formed. Obviously, these heterogeneous particles were formed by the agglomeration of small particles. These results could be explained by the fact that the crystal growth rate was lower than the nucleation rate. When the solution concentration was high, the iron nuclei could easily contact each other. That meant new crystal nuclei formed when the crystal was not fully grown, leading to the serious agglomeration of Fe nanoparticles. In Fig. 3C–E, it could be observed that the size of iron nanoparticles gradually decreased and the particle structures were well-defined. These showed that the low concentration solution was not conducive to crystal growth, leading to the formation of small particles of catalysts.
| Catalyst | Assignment | Hhf (kOe) | IS (mm s−1) | QS (mm s−1) | Γ/2 (mm s−1) | Area (%) |
|---|---|---|---|---|---|---|
a Reaction condition: 300 °C, H2/CO = 2, 1.0 MPa, 12![[thin space (1/6-em)]](https://www.rsc.org/images/entities/char_2009.gif) 000 mL (g h)−1. 000 mL (g h)−1. |
||||||
| FeMnSm-1200 | Fe3+ (spm) | 0.39 | 0.99 | 0.37 | 9.5 | |
| Fe3O4 | 488.74 | 0.33 | −0.03 | 0.25 | 33.3 | |
| 458.76 | 0.60 | −0.03 | 0.29 | 25.6 | ||
| MxFe(3−x)O4 | 433.58 | 0.70 | −0.12 | 0.28 | 11.7 | |
| χ-Fe5C2 | 216.06 | 0.25 | −0.15 | 0.22 | 4.7 | |
| 171.80 | 0.23 | −0.07 | 0.20 | 15.1 | ||
| FeMnSm-900 | Fe3+ (spm) | 0.44 | 1.01 | 0.59 | 11.1 | |
| Fe3O4 | 490.49 | 0.33 | −0.05 | 0.40 | 28.8 | |
| 459.24 | 0.60 | 0.05 | 0.45 | 25.7 | ||
| MxFe(3−x)O4 | 426.90 | 0.56 | −0.34 | 0.28 | 6.1 | |
| χ-Fe5C2 | 217.26 | 0.28 | −0.12 | 0.27 | 7.0 | |
| 173.65 | 0.24 | −0.04 | 0.40 | 20.1 | ||
| 100.07 | 0.10 | −0.14 | 0.13 | 1.2 | ||
| FeMnSm-600 | Fe3+ (spm) | 0.36 | 1.03 | 0.32 | 22.0 | |
| Fe3O4 | 485.73 | 0.40 | −0.05 | 0.27 | 3.5 | |
| χ-Fe5C2 | 215.13 | 0.25 | −0.11 | 0.17 | 26.8 | |
| 183.7 | 0.20 | 0.00 | 0.22 | 32.2 | ||
| 110.61 | 0.26 | 0.07 | 0.21 | 15.5 | ||
| FeMnSm-150 | Fe3+ (spm) | 0.28 | 1.05 | 0.27 | 6.1 | |
| Fe3O4 | 488.57 | 0.33 | −0.01 | 0.22 | 22.1 | |
| 459.08 | 0.62 | 0.03 | 0.32 | 20.8 | ||
| χ-Fe5C2 | 216.73 | 0.29 | −0.12 | 0.21 | 16.7 | |
| 172.68 | 0.24 | −0.07 | 0.21 | 24.1 | ||
| 102.66 | 0.20 | 0.01 | 0.21 | 10.2 | ||
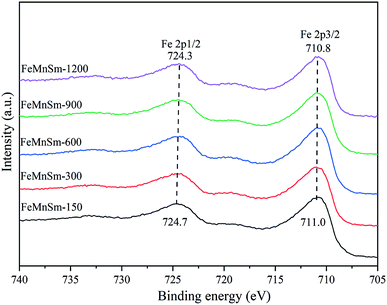
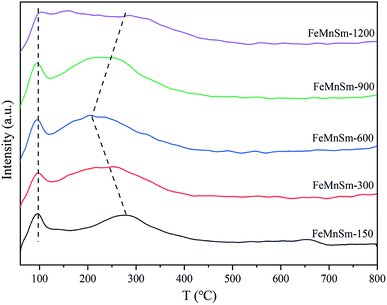
The hydrogenation performance of the catalyst after reduction was revealed by H2-TPD. Fig. 7 depicts the H2 desorption peaks over all catalysts. Previous studies have showed that the H2 desorption peaks could be divided into two types. Firstly, the H species desorbed around 100 °C tended to occupy the surface cavity or the top of the weak adsorption position, representing the weak Fe–H bond.33 Secondly, the H species desorbed in the range of 200–300 °C could be considered as the hydrogen desorbing from the deep hole or defect locations in the surfaces of metal Fe, indicating the chemisorption of H2.34 It could be seen from Fig. 7 that from the aspects of temperature and intensity, no obvious difference could be observed in the weak H2 desorption peak in the five catalysts, which meant that similar H2 weak adsorption occurred in the five samples. In the view of strong desorption, FeMnSm-600 showed the lowest desorption temperature, corresponding to the weakest H2 chemisorption ability. Compared with FeMnSm-150 and FeMnSm-300, the particle size of FeMnSm-600 was smaller and the dispersion was higher, and the electron density of the iron surface was also higher, which promoted weaker adsorption of H2.35 In sample FeMnSm-900 and FeMnSm-1200, both the capacity and strength of H2 chemical adsorption increased. According to XPS, this may be due to the fact that the electron density of iron in the catalyst was lower.
3.2. Catalysts performance in FTS
The reaction data for FTS activities and product distributions of nano iron-based catalysts are listed in Table 3. The CO conversion apparently increases from 58 to 79% from sample FeMnSm-150 to FeMnSm-600. The characterization results of BET, XRD, and SEM mentioned above prove that the particle size of samples FeMnSm-150, FeMnSm-300 and FeMnSm-600 decreased gradually. The catalysts with smaller particles provided more active sites, which was helpful for the reaction of feed gas on the catalyst surface. In addition, XPS, CO-TPD and Mössbauer spectroscopy confirmed that compared with the agglomerated catalyst of FeMnSm-150, the ability of manganese donating electrons to iron was stronger in the small particle catalyst of FeMnSm-600 with good dispersion, which promoted the increase of the surface electron density of iron atoms and the adsorption of CO and the formation of Fe5C2, leading to a higher CO conversion. Meanwhile, according to XPS and H2-TPD, the strong surface charge density of sample FeMnSm-600 could inhibit the adsorption of H2, that was, weaken the hydrogenation reaction, which would not only reduce the selectivity of methane, but also oppose the conversion of olefins to alkanes, and improve the O/P of the product.36 Furthermore, Fe3O4 was considered the active center of the WGS reaction. According to Mössbauer spectroscopy, FeMnSm-600 had the lowest Fe3O4 content, but showed the highest CO2 selectivity, which was contrary to the widely accepted conclusions. This could be explained by a new viewpoint proposed by Liu.37 Through the combination of theoretical study and experiments, Liu et al. verified that the Boudouard mechanism has a predominant effect in CO2 formation on the active χ-Fe5C2 phase, but the existence of the Fe3O4 phase favors the reverse water-gas shift (RWGS) reaction. Our previous research also confirmed this conclusion.24 From sample FeMnSm-600 to FeMnSm-1200, the CO conversion significantly decreased to 35%. Combined with catalyst characterization, the new phase of MnFe2O4 appeared in samples FeMnSm-900 and FeMnSm-1200. It was confirmed in H2-TPR that MnFe2O4 could inhibit the reduction of catalyst, which may be one of the reasons for the poor activities of catalysts. Besides, the formation of MnFe2O4 would not only consume iron as the active center, but also block the pores of catalysts, which were not conducive to the FTS reaction. Furthermore, compared with sample FeMnSm-600, in sample FeMnSm-900 and FeMnSm-1200, the selectivity of CH4 and C02–4 increases gradually, while the selectivity of C5+ and C![[double bond, length as m-dash]](https://www.rsc.org/images/entities/char_e001.gif) 2–4 decreases gradually. According to BET and CO-TPD studies, the reduction of particle size would shorten the residence time of CO on the catalyst surface and weaken the chemical adsorption of CO, thus reducing the growth probability of a carbon chain. Moreover, on the basis of XPS and H2-TPD, the lower electron density of iron atoms also provided a greater possibility for hydrogenation.
2–4 decreases gradually. According to BET and CO-TPD studies, the reduction of particle size would shorten the residence time of CO on the catalyst surface and weaken the chemical adsorption of CO, thus reducing the growth probability of a carbon chain. Moreover, on the basis of XPS and H2-TPD, the lower electron density of iron atoms also provided a greater possibility for hydrogenation.
| Catalyst | CO conversion (%) | CO2 selectivity (%) | HC distribution (%) | |||
|---|---|---|---|---|---|---|
| C1 | C![[double bond, length as m-dash]](https://www.rsc.org/images/entities/char_e001.gif) 2–4 2–4 |
C02–4 | C5+ | |||
a Reduction conditions: T = 350 °C, P = 0.1 MPa, 4000 mL (g h)−1, H2, TOS = 10 h. Reaction conditions: T = 300 °C, P = 1.0 MPa, 12![[thin space (1/6-em)]](https://www.rsc.org/images/entities/char_2009.gif) 000 mL (g h)−1, H2/CO = 2. 000 mL (g h)−1, H2/CO = 2. |
||||||
| FeMnSm-1200 | 35 | 11 | 20 | 24 | 19 | 36 |
| FeMnSm-900 | 46 | 20 | 18 | 26 | 18 | 38 |
| FeMnSm-600 | 79 | 46 | 14 | 33 | 14 | 39 |
| FeMnSm-300 | 67 | 44 | 15 | 28 | 16 | 41 |
| FeMnSm-150 | 58 | 35 | 17 | 23 | 18 | 42 |
3.3. Stability performance
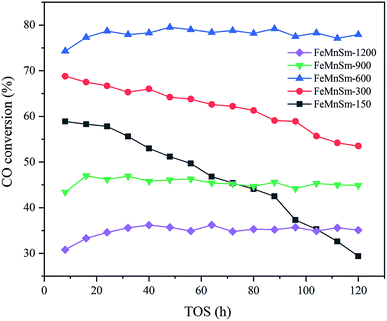
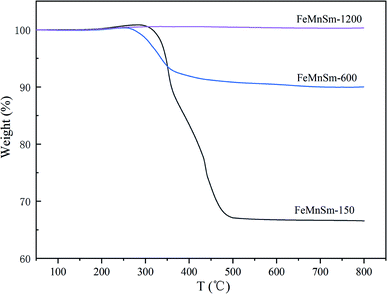
The results of CO conversion with TOS of different sizes of FeMnSm nano catalysts are shown in Fig. 8. As shown in Fig. 8, catalyst activities of sample FeMnSm-1200, FeMnSm-900 and FeMnSm-600 exhibited high stability. The activity of the three samples did not change significantly from the time when FTS reached the stable stage until 120 hours. However, the CO conversion of sample FeMnSm-300 decreased from 67% to 54% in 120 h. Furthermore, the activity of sample FeMnSm-150 decreased from 59% to 29%, which is most obvious. The results of the stability performance reveal the fact that smaller particles are not easily deactivated, and with the increase of catalyst particle size, deactivation will become more serious.TG is carried out to investigate coke formation, which is considered as one of the most important reasons for the deactivation of iron-based catalysts during the Fischer–Tropsch synthesis, and the results are shown in Fig. 9. For sample FeMnSm-150, the weight loss is almost 35%, indicating obvious carbon deposition takes place, and this may be an important reason for its activity decrease. In contrast, the weight loss is less than 10% in FeMnSm-600, which proves that the used FeMnSm-600 sample has low carbon deposition and good stability. Meanwhile, no significant mass change was found in sample FeMnSm-1200, combined with CO-TPD results, it could be that the weak adsorption of FeMnSm-1200 to CO led to less carbon deposition. As a result, the catalyst activity remains low. The results of TG reveal that the carbon deposition of the catalyst is related to the particle size, which affects the FTS stability of the catalyst.
4. Conclusion
The nano iron-based catalysts with different particle sizes were prepared by a co-precipitated method and investigated in a fixed bed reactor. It was found that in the process of catalyst preparation, the high concentration solution more easily caused agglomeration of the catalyst particles, which would not be conducive to the adsorption of CO, and exhibited poor activity of FTS. The decrease of solution concentration promoted the dispersion of catalyst particles, enhanced the interaction between Fe and Mn, promoted the chemical adsorption of CO and the formation of Fe5C2. When the particle size continued to decrease, MnFe2O4 appeared in the catalyst phase, which hindered the reduction of catalysts and the adsorption of feed gas. Overall, the sample FeMnSm-600 showed the highest C![[double bond, length as m-dash]](https://www.rsc.org/images/entities/char_e001.gif) 2–4 selectivity of 33% at the highest CO conversion of 79% during the reaction conditions of 300 °C, 1.0 MPa, 12
2–4 selectivity of 33% at the highest CO conversion of 79% during the reaction conditions of 300 °C, 1.0 MPa, 12![[thin space (1/6-em)]](https://www.rsc.org/images/entities/char_2009.gif) 000 mL (g h)−1, and H2/CO = 2.
000 mL (g h)−1, and H2/CO = 2.
Conflicts of interest
There are no conflicts to declare.Acknowledgements
We gratefully acknowledge financial supports from the National High Technology Research and Development Plan of China (863 Plan, 2011AA05A204) and the Fundamental Research Funds for the Central Universities (No: 50321012017013).References
- H. Schulz, Appl. Catal., A, 1999, 186, 3–12 CrossRef CAS.
- G. Henrici-Olivé and S. Olive, Angew. Chem., Int. Ed. Engl., 1976, 15, 136–141 CrossRef.
- E. Iglesia, Appl. Catal., A, 1997, 161, 59–78 CrossRef CAS.
- R. A. Dictor and A. T. Bell, J. Catal., 1986, 97, 121–136 CrossRef CAS.
- D. B. Bukur, D. Mukesh and S. A. Patel, Ind. Eng. Chem. Res., 1990, 29, 194–204 CrossRef CAS.
- N. Lohitharn and J. G. Goodwin Jr, J. Catal., 2008, 257, 142–151 CrossRef CAS.
- Y. Ji, H. Xiang, J. Yang, Y. Xu, Y. Li and B. Zhong, Appl. Catal., A, 2001, 214, 77–86 CrossRef CAS.
- Y. Yang, H. Xiang, R. Zhang, B. Zhong and Y. Li, Catal. Today, 2005, 106, 170–175 CrossRef CAS.
- Y. Liu, J. Chen, J. Bao and Y. Zhang, ACS Catal., 2015, 5, 3905–3909 CrossRef CAS.
- D. Wang, X. Cheng, Z. Huang, X. Wang and S. Peng, Appl. Catal., 1991, 77, 109–122 CrossRef CAS.
- W. Han, L. Wang, Z. Li, H. Tang, Y. Li, C. Huo, G. Lan, X. Yang and H. Liu, Appl. Catal., A, 2019, 572, 158–167 CrossRef CAS.
- L. Zhao, G. Liu and J. Li, Chin. J. Catal., 2009, 30, 637–642 CrossRef CAS.
- A. N. Pour, M. R. Housaindokht, S. F. Tayyari and J. Zarkesh, J. Nat. Gas Chem., 2010, 19, 284–292 CrossRef CAS.
- H. M. T. Galvis, J. H. Bitter, C. B. Khare, M. Ruitenbeek, A. I. Dugulan and K. P. de Jong, Science, 2012, 335, 835–838 CrossRef.
- J. Den Breejen, P. Radstake, G. Bezemer, J. Bitter, V. Frøseth, A. Holmen and K. d. de Jong, J. Am. Chem. Soc., 2009, 131, 7197–7203 CrossRef CAS.
- Y. Liu, J. Chen and Y. Zhang, RSC Adv., 2015, 5, 29002–29007 RSC.
- F. Bertella, P. Concepción and A. Martínez, Catal. Today, 2017, 289, 181–191 CrossRef CAS.
- L. Fan, K. Yokota and K. Fujimoto, AIChE J., 1992, 38, 1639–1648 CrossRef CAS.
- J. Park, Y. Lee, P. Khanna, K. Jun, J. Bae and Y. H. Kim, J. Mol. Catal. A: Chem., 2010, 323, 84–90 CrossRef CAS.
- Y. Yang, H. Xiang, Y. Xu, L. Bai and Y. Li, Appl. Catal., A, 2004, 266, 181–194 CrossRef CAS.
- M. Mahmoud, H. Hamdeh, J. Ho, M. O'shea and J. Walker, J. Magn. Magn. Mater., 2000, 220, 139–146 CrossRef CAS.
- M. V. Badani and W. N. Delgass, J. Catal., 1999, 187, 506–517 CrossRef CAS.
- C. Jia, L. Sun, F. Luo, X. Han, L. J. Heyderman, Z. Yan, C. Yan, K. Zheng, Z. Zhang and M. Takano, J. Am. Chem. Soc., 2008, 130, 16968–16977 CrossRef CAS.
- X. Wu, H. Ma, H. Zhang, W. Qian, D. Liu, Q. Sun and W. Ying, Ind. Eng. Chem. Res., 2019, 58, 21350–21362 CrossRef CAS.
- H. W. Pennline, M. F. Zarochak, J. M. Stencel and J. R. Diehl, Ind. Eng. Chem. Res., 1987, 26, 595–601 CrossRef CAS.
- F. Jiang, M. Zhang, B. Liu, Y. Xu and X. Liu, Catal. Sci. Technol., 2017, 7, 1245–1265 RSC.
- C. Zhang, Y. Yang, B. Teng, T. Li, H. Zheng, H. Xiang and Y. Li, J. Catal., 2006, 237, 405–415 CrossRef CAS.
- M. C. Ribeiro, G. Jacobs, R. Pendyala, B. H. Davis, D. C. Cronauer, A. J. Kropf and C. L. Marshall, J. Phys. Chem. C, 2011, 115, 4783–4792 CrossRef CAS.
- X. Li, B. Zhong, S. Peng and Q. Wang, Catal. Lett., 1994, 23, 245–250 CrossRef CAS.
- T. Li, Y. Yang, C. Zhang, X. An, H. Wan, Z. Tao, H. Xiang, Y. Li, F. Yi and B. Xu, Fuel, 2007, 86, 921–928 CrossRef CAS.
- J. Li, X. Cheng, C. Zhang, J. Wang, W. Dong, Y. Yang and Y. Li, J. Chem. Technol. Biotechnol., 2017, 92, 1472–1480 CrossRef CAS.
- J. Li, C. Zhang, X. Cheng, M. Qing, J. Xu, B. Wu, Y. Yang and Y. Li, Appl. Catal., A, 2013, 464, 10–19 CrossRef.
- H. Suo, S. Wang, C. Zhang, J. Xu, B. Wu, Y. Yang, H. Xiang and Y. Li, J. Catal., 2012, 286, 111–123 CrossRef CAS.
- M. Qing, Y. Yang, B. Wu, H. Wang, H. Wang, J. Xu, C. Zhang, H. Xiang and Y. Li, Catal. Today, 2012, 183, 79–87 CrossRef CAS.
- D. G. Miller and M. Moskovits, J. Phys. Chem., 1988, 92, 6081–6085 CrossRef CAS.
- Y. Zhang, T. Wang, L. Ma, N. Shi, D. Zhou and X. Li, J. Catal., 2017, 350, 41–47 CrossRef CAS.
- B. Liu, W. Li, J. Zheng, Q. Lin, X. Zhang, J. Zhang, F. Jiang, Y. Xu and X. Liu, Catal. Sci. Technol., 2018, 8, 5288–5301 RSC.
| This journal is © The Royal Society of Chemistry 2020 |

