 Open Access Article
Thermoelectric properties of flexible PEDOT:PSS-based films tuned by SnSe via the vacuum filtration method†
Zhuqing Yan,
Yaxin Zhao,
Dan Liu *,
Zhidong Zhang,
Yongqiu Zheng,
Juan Cui,
Yanjun Zhang* and
Chenyang Xue
Key Laboratory of Instrumentation Science & Dynamic Measurement, Ministry of Education, North University of China, Taiyuan 030051, China. E-mail: liudan235@nuc.edu.cn; zhangyanjun@nuc.edu.cn
First published on 9th December 2020
Abstract
In this study, flexible thermoelectric tin selenide (SnSe)/poly(3,4-ethylenedioxythiophene):poly(styrenesulfonate) (PEDOT:PSS) composite films have been fabricated by the vacuum filtration method, and their thermoelectric properties were investigated. The electrical conductivities of the composite films have a tendency to decrease with an increase in the SnSe content, while their Seebeck coefficients have an inverse tendency. The electrical conductivities decrease gradually with an increase in temperature, while the Seebeck coefficients show a tendency to increase first and then decrease with the increase in temperature. The maximum power factor (PF = S2σ) of the composite film is obtained when the SnSe content is 10 wt%, which is 24.42 μW m−1 K−2 at 353 K. Besides, the 10 wt% SnSe/PEDOT:PSS film exhibited excellent stability with only a 9% increase in resistance after 1000 bends under a bending radius of 4 mm. When the temperature gradient is 50 K, a flexible thermoelectric generator fabricated by 3 legs of the 10 wt% SnSe/PEDOT:PSS film has an open-circuit voltage and maximum output electrical power of 3.2 mV and 13.73 nW, respectively, which demonstrates a great potential application to power wearable flexible electronic devices.
Introduction
In recent years, wearable devices have become increasingly popular due to their advantages of portability, flexibility, ductility, and integration.1–3 However, battery replacement is a major issue for wearable devices. Thermoelectric (TE) devices made of TE materials can generate electricity by converting the temperature difference between the environment and human skin. It can be self-powered without an external power supply. The properties of TE materials are evaluated by the dimensionless figure of merit ZT, which is defined as ZT = S2σT/k, where σ, S, T, and k are electrical conductivity, Seebeck coefficient, absolute temperature, and thermal conductivity, respectively. The higher conversion efficiency depends on a higher ZT, which can be achieved by a higher power factor PF = S2σ as well as lower k.In previous studies, inorganic TE material Te compounds (such as Bi2Te3, the ZT of 0.96 peaked at 380 K,4 PbTe, the ZT is 1.5 at 773 K,5 Sb2Te3, the average ZT value is 1.02 among the temperature from 300 to 680 K,6 and their alloys), Pb compounds (such as PbSe, which was doped with Na and its ZT > 1.2 at 850 K),7 and PbS, (the maximum ZT is 1.8 for 2% Na-doped PbTe–PbS at 800 K,8 and their alloys) have been studied. Although their ZT is extremely high, these inorganic materials are inadaptable for wearable TE generators due to their characteristics of being toxic, rigid, rare, and high-priced.7–11 In order to obtain a flexible TE generator, organic TE materials, such as conducting polymers PEDOT:PSS,12,13 polyaniline (PANI),14 and polypyrrole (PPy),15 have been widely explored because of their flexibility, non-toxicity, simple-fabrication, light-weight and low cost.12,13,15 Among them, PEDOT:PSS is viewed as the best organic TE material because of its high σ and low k, while its thermoelectric property is lower than inorganic TE materials, which need to be enhanced to meet the actual wearable devices. The most common method used to enhance the PF of PEDOT:PSS is the organic treatment. Kim et al. reported that S and σ were ∼28 μV K−1 and ∼620 S cm−1 for PEDOT:PSS when mixed with dimethyl sulfoxide (DMSO), respectively.16 Luo et al. reported that σ increased up to ∼930 S cm−1 and S went down to 17.99 μV K−1 for the PEDOT:PSS film with the DMSO post-treatment.12 It can be seen that S decreases gradually, while σ increases by the organic treatment.17 Therefore, it is difficult to greatly enhance the PF of PEDOT:PSS due to the interdependence between S and σ. Due to the superior thermoelectricity of inorganic TE materials, they have been added to PEDOT:PSS to enhance TE properties. Du et al. prepared the composed film of 10 wt% Bi–Te based alloy NS/PEDOT:PSS, and its PF reached 58.9 μW m−1 K−2 at 300 K.18 Cheng et al. enhanced the TE properties of PEDOT:PSS by mixing SnS nanobelts.19 Xiong et al. fabricated 3 wt% graphene-doped PEDOT:PSS nanofilms, and their PF reached up to 53.3 μW m−1 K−2.20 Wang et al. reported that the hybrid of high purity SiC-NWs with PEDOT:PSS obtained a high PF of 67.7 μW m−1 K−2.21 Recently, SnSe as a p-type TE material with an ultrahigh ZT of 2.6 ± 0.3 was reported by Zhao et al.22 and has shown prominent TE properties due to its high PF and ultralow k (ref. 23–25) and has been a promising composite candidate with non-toxic and lower cost.26 However, to the best of our knowledge, a flexible SnSe/PEDOT:PSS TE composite film is rarely investigated and its thermoelectric property should be studied further.
Herein, we present a type of hybrid of flexible TE films composed of organic conducting polymer PEDOT:PSS and inorganic TE material SnSe via a vacuum filtration method. By studying the effects of the SnSe content and temperature gradient for the TE properties of the composite films, the PF was enhanced to 24.42 μW m−1 K−2 at 353 K for the 10 wt% SnSe/PEDOT:PSS film. Also, the excellent flexibility, stability, and output property of TE generators were studied.
Experimental
Materials
A PEDOT:PSS solution (Clevios PH1000) was bought from Juyuan New Materials Co., LTD. Tin selenide (SnSe, 99.999%) was purchased from Shanghai Macklin Biochemical Technology Co., LTD. The silver paste was bought from Shenzhen Sinwe Electronic Material Co., LTD. Nylon membranes were purchased from Yancheng Prich Experimental Instrument Co., LTD. The purchased SnSe particles were ground in an agate mortar for 2 h in a nitrogen environment. Then, the resulting SnSe particles were rinsed with an aqueous HCl (3 vol%) solution to reduce oxidation. Further, the particles were alternatively washed several times with ethyl alcohol and deionized water, respectively. Finally, it was dried at 60 °C on a hot plate in a nitrogen environment. Other materials were directly used without further purification.Fabrication of flexible SnSe/PEDOT:PSS composite films
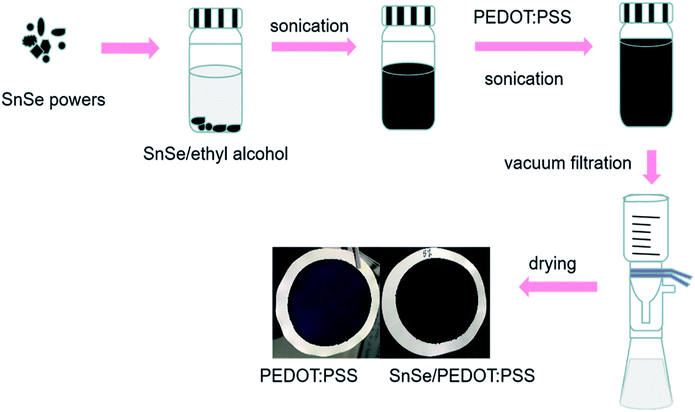
The schematic of fabrication for the flexible SnSe/PEDOT:PSS films are shown in Fig. 1. First, numerous contents of SnSe (0, 2.5, 5, 7.5, 10, 15 wt%) were introduced in 10 mL ethyl alcohol and sonicated by an ultrasonic cell disruptor (Scientz, JY96-IIN) for 1 h. Then, the upper mixtures were mixed with 0.2 mL PEDOT:PSS and sonicated for 1 h again. After that, the above mixtures were vacuum-filtered using nylon membranes (with the pore size of 0.22 μm). Finally, the composite films were dried for 4 h at 60 °C in a glove box filled with nitrogen gas.Fabrication of flexible TE generators
The 10 wt% SnSe/PEDOT:PSS film was cut into strips (2 cm × 0.5 cm) and pasted on a polyimide (PI) substrate using a double-faced adhesive tape with an interval of 1 cm. Next, three legs were connected in series using the silver paste to form a TE generator. Finally, copper wires were pasted using silver paste at the end of the TE generator to output electrical power.Measurements and characterizations of flexible SnSe/PEDOT:PSS films and TE generators
To evaluate the properties of SnSe/PEDOT:PSS films, σ, S, carrier concentration (n), and mobility (μ) were measured. The electrical resistivity and S were simultaneously measured in the helium (He) environment by the standard four-probe method in an LSR-3 Seebeck & Electric Resistivity Unit (Linseis, Germany) with the temperature gradient (∼10 K) between two ends of the films. n and μ of the films were measured using the van der Pauw four-probe method in an HCS 1 Hall-effect measurement (Linseis, Germany). The morphologies and thickness of the samples were characterized by SEM (Zeiss, SUPRA-55) with energy-dispersive X-ray spectroscopy (EDS). In addition, Raman spectra were used to analyze the structure of SnSe/PEDOT:PSS films by a Raman spectrometer (Renishaw, inVia Microscope). The bending test was performed using metal sticks with different diameters. The output voltage and output electrical power of the flexible TE generators were measured by a home-made circuit (Fig. S1†). The cold side temperature was kept by a circulating water system and the hot side temperature was raised by the heating stage to estimate the output properties of TE generators. An amperemeter (Keithley 6514) and a resistance box are connected in series with the TE generator, and the output voltage of TE generators under different resistances and temperature gradients were tested using a digital multimeter.Results and discussion
To observe the effects of different contents of SnSe on the morphology of films, their SEM images were recorded and are shown in Fig. 2. It is obvious that the SnSe particles are homogeneously dispersed in the PEDOT:PSS matrices and the number of SnSe particles become on the surface of the films increase with an increase in the SnSe content from 2.5 wt% to 15 wt%. This indicates that SnSe was successfully added to PEDOT:PSS to form composite films. In addition, different sizes of SnSe particles are observed in Fig. 2, which can be ascribed to the ground raw material of SnSe with sizes of several μm.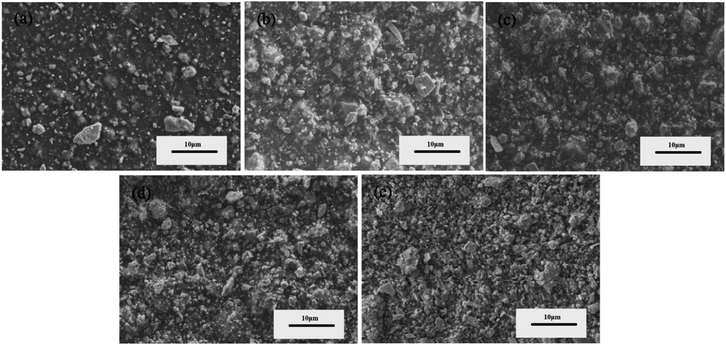 | ||
| Fig. 2 SEM images of (a) 2.5 wt%, (b) 5 wt%, (c) 7.5 wt%, (d) 10 wt%, (e) 15 wt% SnSe/PEDOT:PSS films. | ||
In order to study the elemental composition of the composite films, Fig. 3 shows the EDS spectrum of the SnSe particles in the 2.5 wt% SnSe/PEDOT:PSS film. Sn and Se are the main elements in the EDS spectrum and the appearance of C, O, and S elements originates from PEDOT:PSS (the illustration of Fig. 3b). Furthermore, the atomic ratio of Sn![[thin space (1/6-em)]](https://www.rsc.org/images/entities/char_2009.gif) :
:![[thin space (1/6-em)]](https://www.rsc.org/images/entities/char_2009.gif) Se is 1
Se is 1![[thin space (1/6-em)]](https://www.rsc.org/images/entities/char_2009.gif) :
:![[thin space (1/6-em)]](https://www.rsc.org/images/entities/char_2009.gif) 1.079, near unity.
1.079, near unity.
 | ||
| Fig. 3 (b) Point scanning EDS spectrum of the selected area in (a) 2.5 wt% SnSe/PEDOT:PSS SEM image and the illustration of (b) is the molecular structure of PEDOT:PSS. | ||
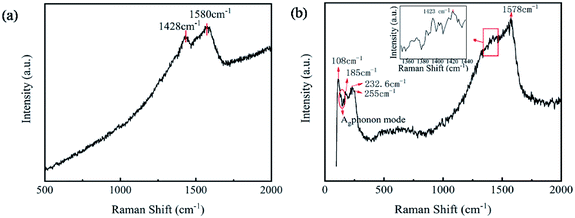
To analyze the internal bonding structure of SnSe/PEDOT:PSS films, the Raman spectra of 0 wt% SnSe/PEDOT:PSS and 2.5 wt% SnSe/PEDOT:PSS films are shown in Fig. 4. In Fig. 4a, the curves present the typical peaks of PEDOT:PSS at 1428 cm−1 and 1580 cm−1. The bands between 1400 and 1500 cm−1 are caused by the Cα![[double bond, length as m-dash]](https://www.rsc.org/images/entities/char_e001.gif) Cβ symmetric stretching vibration of the benzoid structures in the thiophene rings.19,27 The peak at 1580 cm−1 is attributed to the Cα
Cβ symmetric stretching vibration of the benzoid structures in the thiophene rings.19,27 The peak at 1580 cm−1 is attributed to the Cα![[double bond, length as m-dash]](https://www.rsc.org/images/entities/char_e001.gif) Cβ antisymmetric stretching.20 Ag and B3g are the characteristic plane phonon vibration modes in b and c directions, respectively.28 It can be observed that the peak 108 cm−1 conforms to the B3g phonon mode and 130 cm−1, and 150 cm−1 accords with the Ag phonon mode of SnSe in Fig. 4b. The peak of 185 cm−1 is the Ag1 mode, corresponding to the characteristics of SnSe2 and 232.6 cm−1, while 255 cm−1 indicates the presence of Se.29 The existence of Se and SnSe2 indicates that the SnSe raw material is not pure. After the introduction of SnSe particles, the characteristic peaks of PEDOT:PSS shift to 1423 cm−1 and 1578 cm−1, which was caused by the size-induced phonon confinement and surface relaxation.30 The above results once again indicate that SnSe particles were successfully added to the PEDOT:PSS matrix.
Cβ antisymmetric stretching.20 Ag and B3g are the characteristic plane phonon vibration modes in b and c directions, respectively.28 It can be observed that the peak 108 cm−1 conforms to the B3g phonon mode and 130 cm−1, and 150 cm−1 accords with the Ag phonon mode of SnSe in Fig. 4b. The peak of 185 cm−1 is the Ag1 mode, corresponding to the characteristics of SnSe2 and 232.6 cm−1, while 255 cm−1 indicates the presence of Se.29 The existence of Se and SnSe2 indicates that the SnSe raw material is not pure. After the introduction of SnSe particles, the characteristic peaks of PEDOT:PSS shift to 1423 cm−1 and 1578 cm−1, which was caused by the size-induced phonon confinement and surface relaxation.30 The above results once again indicate that SnSe particles were successfully added to the PEDOT:PSS matrix.
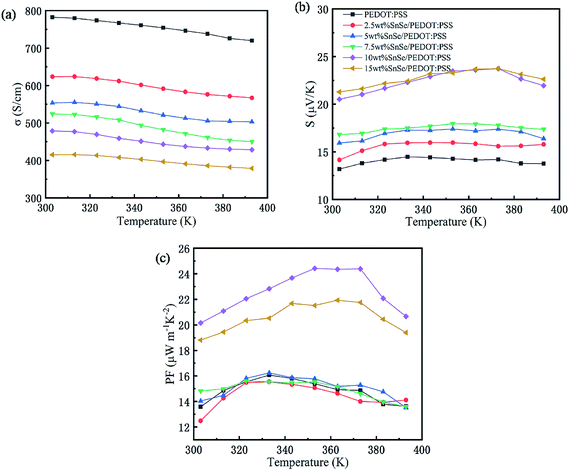
The effects of different SnSe content and temperature on σ, S, and PF of SnSe/PEDOT:PSS composite films are shown in Fig. 5 (the thicknesses of the films were measured by SEM, the cross-sectional 2.5 wt% SnSe/PEDOT:PSS of is shown in Fig. S2† and their thickness is in the range of 2.57–5.80 μm as listed in Table S1†). Fig. 5a shows that σ of all composite films is lower than that of the 0 wt% SnSe/PEDOT:PSS film with an increase in the SnSe content from 0 wt% to 15 wt% at 303 K, which decreases gradually from 782.5 S cm−1 to 378.9 S cm−1. Simultaneously, σ of all composite films have a tendency to decrease with the increase in temperature. In Fig. 5b, S of the composite films reached up to 21.28 μV K−1 for 15 wt% SnSe/PEDOT:PSS at 303 K, which is higher than that for 0 wt% SnSe/PEDOT:PSS (13.18 μV K−1 at 303 K). Besides, S of the composite films increases first and then decrease slowly when the temperature changes from 303 K to 393 K. Also, the temperature points of the S peak for different SnSe contents are different. As an important index for thermoelectric films, PF of the composite films are shown in Fig. 5c. The PF of 2.5 wt% SnSe/PEDOT:PSS (12.5 μW m−2 K−1) is smaller than that of 0 wt% SnSe/PEDOT:PSS (13.6 μW m−2 K−1) at 303 K, which is caused by the sharp decrease of σ and slight increase of S, while the increase in PFs for other composite films are mainly caused by the large increase of S at 303 K. Also, PF has a similar tendency of S for all composite films with the temperature. The maximum of PF shifts to the higher temperature with the increase in the SnSe content because SnSe has an excellent thermoelectric property at a higher temperature. The maximum of PF is achieved for the 10 wt% SnSe/PEDOT:PSS film at 353 K, which is 24.42 μW m−2 K−1.
The change in σ and S is closely related to n and μ, the change of n and μ with different SnSe contents and temperatures are measured to investigate the internal essence as shown in Fig. 6. Fig. 6a shows the Hall measurement results of different SnSe contents at 303 K. With the increase in SnSe contents from 0 wt% to 15 wt%, n decreases gradually from 9.3 × 1022 cm−3 to 4.53 × 1022 cm−3, and the μ of composite films is among 0.046–0.060 cm−2 V−1 s−1. The electrical conductivity is defined as the following equation:30
| σ = neμ | (1) |
| S = (8π2kB/3eh2)m* × T(π/3n)2/3 | (2) |
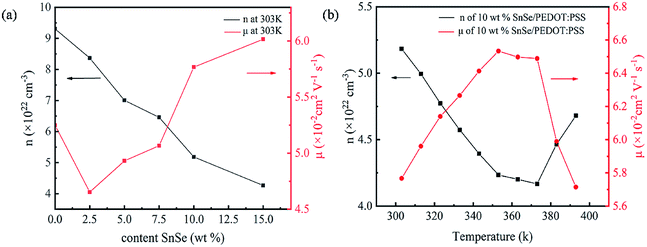 | ||
| Fig. 6 (a) n and μ of different SnSe content composite films at 303 K; (b) temperature dependence of the n and μ for 10 wt% SnSe/PEDOT:PSS. | ||
The temperature dependence of n and μ of the 10 wt% SnSe/PEDOT:PSS film is shown in Fig. 6b (the temperature dependences of n and μ of other SnSe content composite films are shown in Fig. S3†). When the temperature rises from 303 K to 393 K, n decreases first from 5.18 × 1022 cm−3 to 4.16 × 1022 cm−3 and then increases rapidly to 4.68 × 1022 cm−3. The μ of 10 wt% SnSe/PEDOT:PSS increases from 0.0576 cm2 V−1 s−1 to 0.0653 cm2 V−1 s−1 and then decreases to 0.0571 cm2 V−1 s−1. Therefore, the main reason for the decrease of σ is that n decreases obviously and the μ increases infinitesimally from 303 K to 393 K. For the composite materials, the S is defined as the following equation:31
| S = (kB/e)(E − EF)/kBT | (3) |
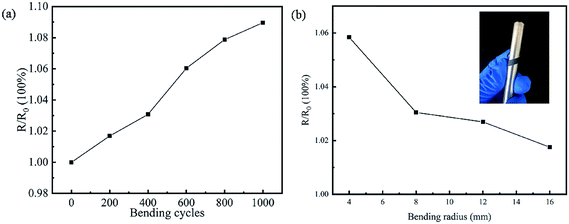
Excellent flexibility is the most desired for wearable applications, which can fit the curved surface of the body. The flexibility test on 10 wt% SnSe/PEDOT:PSS TE leg was carried out to evaluate its stability by the change in resistance, as shown in Fig. 7. In Fig. 7a, the resistance increases with the number of bends under a bending radius of 4 mm, and it only increases by 9% after 1000 cycles, indicating excellent stability. In Fig. 7b, the resistance increment decreases with the increase in the bending radius under bending 500 cycles (the illustration in Fig. 7b is a photo of the flexible test for the TE leg). In conclusion, the composite films show good flexibility and stability, which are suitable for wearable applications.
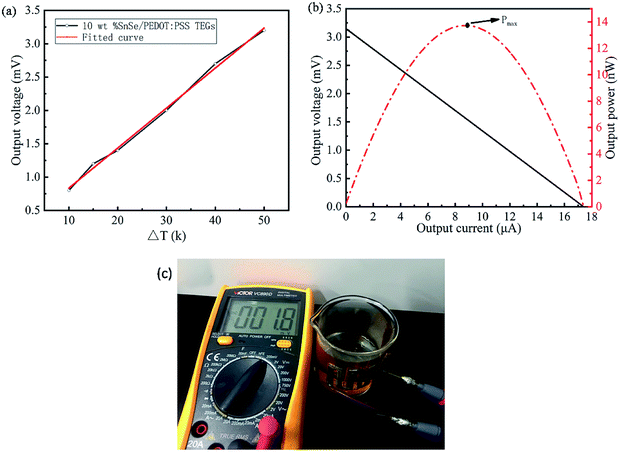
To verify the practical application ability of the TE film, the corresponding TE generator was constructed and evaluated in practice. The graph in Fig. 8 corresponds to the output voltage and output electric power of the 3-leg TE generator. In Fig. 8a, the black wire shows the output voltage of the 10 wt% SnSe/PEDOT:PSS TE generator, which is nearly proportional to the temperature gradient (the red wire is a fitting curve of output voltage of 10 wt% SnSe/PEDOT:PSS TE generator and temperature gradient). In Fig. 8b, the relationship between the output voltage, output electric power, and output current are measured at the temperature gradient of 50 K. It should be noted that the open-circuit voltage and the maximum output electric power of the TE generator are 3.2 mV and 13.73 nW, respectively. The open-circuit voltage can be calculated by the equation:
| Uo = N × S × ΔT | (4) |
Conclusions
In summary, different SnSe content composite films have been prepared by the vacuum filtration method, and the SnSe particles were homogeneously dispersed in the films. The maximum PF value of the composite film was improved to 24.42 μW m−1 K−2 of 10 wt% SnSe/PEDOT:PSS at 353 K. A TE generator with 3-leg of 10 wt% SnSe/PEDOT:PSS could generate the output voltage of 3.2 mV and the maximum output electric power of 13.73 nW at the temperature gradient of 50 K. The SnSe/PEDOT:PSS films also displayed higher flexibility, which may have the potential to power wearable electronic devices.Conflicts of interest
There are no conflicts of interest to declare.Acknowledgements
The project was supported by the National Natural Science Foundation of China (No. 62001428), National Key Research and Development Program of China (No. 2019YFB2004800), National Science Foundation for Distinguished Young Scholars of China (No. 61525107), Shanxi “1331 Project” Key Subject Construction (1331KSC), National Natural Science Foundation for China as National Major Scientific Instruments Development Project (No. 61727806), and Science Foundation of North University of China (No. XJJ201911).Notes and references
- R. Feng, F. Tang, N. Zhang and X. Wang, ACS Appl. Mater. Interfaces, 2019, 11, 38616–38624 CrossRef CAS.
- F. Deng, H. Qiu, J. Chen, L. Wang and B. Wang, IEEE Trans. Ind. Electron. Control Instrum., 2017, 64, 1477–1485 Search PubMed.
- Y. Zhang and S. J. Park, Polymers, 2019, 11, 909 CrossRef CAS.
- G. Zhang, B. Kirk, L. A. Jauregui, H. Yang, X. Xu, Y. P. Chen and Y. Wu, Nano Lett., 2012, 12, 56–60 CrossRef CAS.
- J. P. Heremans, V. Joseph, E. S. Toberer, A. Saramat, K. Kurosaki, A. Charoenphakdee, S. Yamanaka and G. J. Snyder, Science, 2008, 321, 554–557 CrossRef CAS.
- L. Xie, H. Qin, J. Zhu, L. Yin, D. Qin, F. Guo, W. Cai, Q. Zhang and J. Sui, Adv. Electron. Mater., 2019, 6, 1901178 CrossRef.
- H. Wang, Y. Pei, A. D. LaLonde and G. J. Snyder, Adv. Mater., 2011, 23, 1366–1370 CrossRef CAS.
- S. N. Girard, J. He, X. Zhou, D. Shoemaker, C. M. Jaworski, C. Uher, V. P. Dravid, J. P. Heremans and M. G. Kanatzidis, J. Am. Chem. Soc., 2011, 133, 16588–16597 CrossRef CAS.
- S. Johnsen, J. He, J. Androulakis, V. P. Dravid, I. Todorov, D. Y. Chung and M. G. Kanatzidis, J. Am. Chem. Soc., 2011, 133, 3460–3470 CrossRef CAS.
- Y. Pei, J. Lensch-Falk, E. S. Toberer, D. L. Medlin and G. J. Snyder, Adv. Funct. Mater., 2011, 21, 241–249 CrossRef CAS.
- X. Zhang, J. Li, X. Wang, Z. Chen, J. Mao, Y. Chen and Y. Pei, J. Am. Chem. Soc., 2018, 140, 15883–15888 CrossRef CAS.
- J. Luo, D. Billep, T. Waechtler, T. Otto, M. Toader, O. Gordan, E. Sheremet, J. Martin, M. Hietschold, D. R. T. Zahn and T. Gessner, J. Mater. Chem. A, 2013, 1, 7576 RSC.
- S. Liu, H. Deng, Y. Zhao, S. Ren and Q. Fu, RSC Adv., 2015, 5, 1910–1917 RSC.
- Q. Yao, L. Chen, W. Zhang, S. Liufu and X. Chen, ACS Nano, 2014, 4, 2445–2451 CrossRef.
- J. Wang, K. Cai, S. Shen and J. Yin, Synth. Met., 2014, 195, 132–136 CrossRef CAS.
- G. H. Kim, L. Shao, K. Zhang and K. P. Pipe, Nat. Mater., 2013, 12, 719–723 CrossRef CAS.
- S. H. Lee, H. Park, S. Kim, W. Son, I. W. Cheong and J. H. Kim, J. Mater. Chem. A, 2014, 2, 7288–7294 RSC.
- Y. Du, K. F. Cai, S. Chen, P. Cizek and T. Lin, ACS Appl. Mater. Interfaces, 2014, 6, 5735–5743 CrossRef CAS.
- X. Wang, F. Meng, T. Wang, C. Li, H. Tang, Z. Gao, S. Li, F. Jiang and J. Xu, J. Alloys Compd., 2018, 734, 121–129 CrossRef CAS.
- J. Xiong, F. Jiang, H. Shi, J. Xu, C. Liu, W. Zhou, Q. Jiang, Z. Zhu and Y. Hu, ACS Appl. Mater. Interfaces, 2015, 7, 14917–14925 CrossRef CAS.
- X. Cheng, L. Wang, X. Wang and G. Chen, Compos. Sci. Technol., 2018, 155, 247–251 CrossRef CAS.
- L. Zhao, S. Lo, Y. Zhang, H. Sun, G. Tan, C. Uher, C. Wolverton, V. P. Dravid and M. G. Kanatzidis, Nature, 2014, 508, 373–377 CrossRef CAS.
- C. Chang, M. Wu, D. He, Y. Pei, C. Wu, X. Wu, H. Yu, F. Zhu, K. Wang, Y. Chen, L. Huang, J. Li, J. He and L. Zhao, Science, 2018, 360, 778–783 CrossRef CAS.
- X. Zhang and L. Zhao, J. Materiomics, 2015, 1, 92–105 CrossRef.
- L. Zhao, C. Chang, G. Tan and M. G. Kanatzidis, Energy Environ. Sci., 2016, 9, 3044–3060 RSC.
- Y. Zhou and L. Zhao, Adv. Mater., 2017, 29, 1702676 CrossRef.
- F. Pang, S. Li, W. Sun and G. Han, Mater. Chem. Phys., 2017, 186, 246–250 CrossRef CAS.
- S. Zhao, H. Wang, Y. Zhou, L. Liao, Y. Jiang, X. Yang, G. Chen, M. Lin, Y. Wang, H. Peng and Z. Liu, Nano Res., 2015, 8, 288–295 CrossRef CAS.
- P. A. Fernandes, M. G. Sousa, P. M. P. Salomé, J. P. Leitão and A. F. da Cunha, CrystEngComm, 2013, 15, 10278 RSC.
- Y. Lu, Y. Qiu, K. Cai, Y. Ding, M. Wang, C. Jiang, Q. Yao, C. Huang, L. Chen and J. He, Energy Environ. Sci., 2020, 13, 1240–1249 RSC.
- Y. Lu, Y. Ding, Y. Qiu, K. Cai, Q. Yao, H. Song, L. Tong, J. He and L. Chen, ACS Appl. Mater. Interfaces, 2019, 11, 12819–12829 CrossRef CAS.
Footnote |
| † Electronic supplementary information (ESI) available. See DOI: 10.1039/d0ra08458a |
| This journal is © The Royal Society of Chemistry 2020 |

