 Open Access Article
A study on the electrochemical behavior of hydroquinone at a nanometer cobalt/L-glutamate-modified electrode
Baomei Huang *a,
Chengwei Yaob,
Jing Yanga,
Shizhuang Dua and
Xiaoquan Luc
aCollege of Chemistry & Chemical Engineering, MianYang Normal University, MianYang, 621000, China. E-mail: hbm790117@163.com; Tel: +86-15881432277
bFacility Design and Instrumentation Institute, China Aerodynamics Research and Development Center, MianYang, 621000, China
cKey Laboratory of Bioelectrochemistry & Environmental Analysis of Gansu Province, College of Chemistry & Chemical Engineering, Northwest Normal University, Lanzhou 730070, China
First published on 8th December 2020
Abstract
A new electrochemical sensor for hydroquinone (HQ) was prepared. The electrochemical sensor was modified by electrodeposition and electrochemical polymerization to modify nanometer cobalt (nano-Co) and poly-L-glutamic acid (poly-L-glu) on the surface of a glassy carbon electrode (GCE). Then, the electrochemical behavior of hydroquinone on the electrochemical sensor was investigated by cyclic voltammetry (CV). The experimental conditions were optimized from the aspects of electrolyte type, concentration, acidity, enrichment time and scanning speed. The experimental results showed that under optimized conditions the oxidation peak current has a good linear relationship with the concentration of hydroquinone in the range of 3.85 × 10⁻⁶ to 1.30 × 10⁻³ mol L−1 (R2 = 0.9998). Moreover, there was a low detection limit of 4.97 × 10⁻⁷ mol L−1. When the sensor was used for the analysis of hydroquinone in water samples, the recoveries with satisfactory results were in the range of 97.2–102.6%.
Introduction
Hydroquinone (HQ, 1,4-dihydroxybenzene) is a phenolic compound naturally found in wood, tobacco smoke, coaltar, crude oil, and other materials.1 It is widely used in dyes, cosmetics, anti-oxidants, and secondary coloring matter.2 Due to its high toxicity and low degradation in the ecological environment, its presence in cosmetics, medicines, environment and human diet poses environmental pollution and toxic risks for the human health.3,4 The US Environmental Protection Agency (EPA) and the European Union (EU) have included hydroquinone in their lists of priority pollutants.5 According to the national standard of China (GB 8978-1996), the acceptable emission of phenolic compounds is 0.5 mg mL−1 (0.00454 M).5Up to now, numerous detection methods have been established to determine HQ, such as capillary electrophoresis,6 fluorescence,7 gas chromatography (GC),8,9 spectrophotometry,10 and high performance liquid chromatography (HPLC).11,12 These methods have the disadvantages of complicated processes, long time and high cost.5 The electrochemical method has attracted considerable attention since it has the merits of simple operation, fast response and low cost, which offer the opportunity for portable, cheap and rapid methodologies.13
In recent years, electrochemical sensors with different modified electrodes have been successfully constructed, such as carbon-modified materials,5,14–16 organic matter-modified materials,17–20 metal-nanomaterials21–24 and other composite electrodes.25–34 However, the development of more reliable and sensitive electrochemical sensors for HQ is still one of the hot topics. Metal nanoparticles have the advantages of large specific surface area, high surface activity and high strength, which can improve the performance of electrochemical sensors.35,36 However, the adsorption of nano-Co on the GCE is unstable, and it needs to be combined with other materials to improve the stability. Amino acids have active sites and groups. The interactions between amino acids and metallic ions provide a better support for the performance of the sensor.
In this study, a simple and fast method for the determination of HQ at the nano-Co and L-glu-modified GCE is presented using electrodeposition and electrochemical polymerization sequentially (Scheme 1). The characteristics of the two modified materials were combined to improve the conductivity and sensitivity of the electrode. The electrochemical behavior of HQ was investigated via cyclic voltammetry (CV), and the electrochemical conditions were optimized. A new electrochemical sensor was established for the determination of HQ with satisfactory results.
Experimental
Reagents and materials
HQ and L-glu were purchased from Kelong Chemical Reagent Factory in Chengdu. Cobalt nitrate was acquired from the second reagent factory in Shanghai. All the other chemicals were of analytical reagent grade and used without further purification.Apparatus
Electrochemical experiments were performed on a CHI660E (Shanghai Chenhua Co., China) electrochemical workstation. The three-electrode system consisted of bare or modified GCE as the working electrode, a platinum wire as the counter electrode, and Ag/AgCl as the reference electrode in a saturated KCl solution. The surface characterization was observed via scanning electron microscopy (SEM) on a JSM-6460F, which was purchased from Japan Electron Optics Company.Preparation of nano-Co/poly-L-glu/GCE
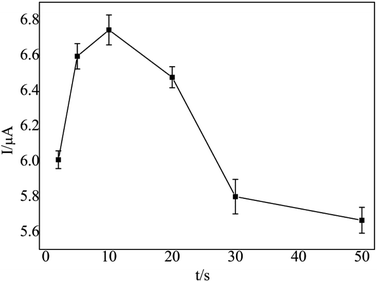
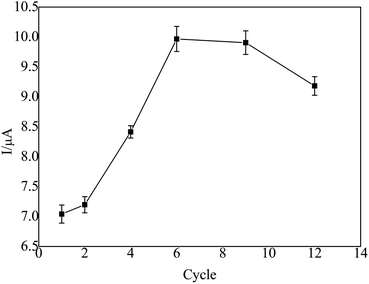
Before modification, the bare GCE was polished to be mirror-like with 0.03 μm alumina slurry, washed successively with anhydrous alcohol and deionized water in an ultra-sonic bath for 5 min. Then, it was potential cyclically scanned in the range from −0.1 V to +0.5 V in a 1 × 10⁻³ M K3[Fe(CN)6] solution containing the 0.1 M KCl supporting electrolyte until a pair of well-defined redox peaks was observed.First, the treated GCE was placed in a 3 × 10⁻² mol L−1 cobalt nitrate solution, which was electrodeposited for 30 s at a constant potential of −0.9 V and dried at room temperature, which was denoted as nano-Co/GCE. Second, nano-Co/poly-L-glu/GCE was synthesized from nano-Co/GCE in an L-glu solution (2 × 10⁻³ mol L−1) by CV at a scanning rate of 100 mV s−1 in a potential range from −0.8 to −2.0 V. After 6 cycles of polymerization, the GCE was dried at room temperature. The obtained electrode was denoted as nano-Co/poly-L-glu/GCE.
Results and discussion
Characterization of the electrode
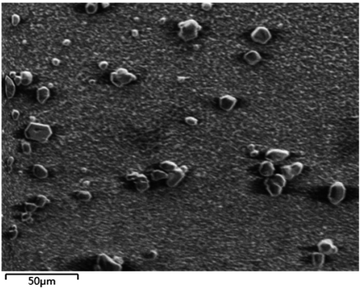
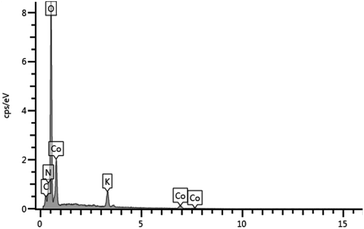
The SEM image of nano-Co/GCE (Fig. 1) displays the spherical size of the particles. Fig. 2 is the EDS of the modified nano-Co/GCE, which showed that nano-Co was modified on GCE.Electrochemical behavior of HQ at different sensors
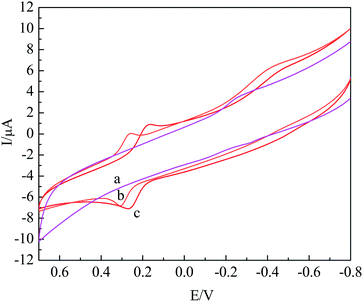
The electrochemical behavior of HQ on different modified electrodes was studied via CV, as shown in Fig. 3. It could be seen that the oxidation peak current at GCE (curve (a)) was the minimum, and the peak current of curve (d) significantly increased as compared to that of other electrodes, indicating that the modified material improved the catalytic effect. According to the Laviron formula Ip = nFQv/4RT, in which Ip is the peak current, n is the number of electrons transferred, F is the Faraday constant, Q is the electric quantity, v is the scan rate, R is the gas constant, T is the temperature, and n was calculated to be 2.3, indicating that the number of electron transfer in the reaction of HQ on the modified electrode was about 2. Thus, the redox reaction of HQ on the nano-Co/poly-L-glu/GCE was a 2-electron reaction.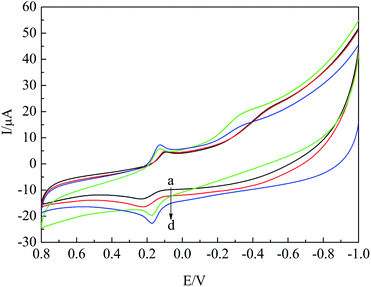 | ||
| Fig. 3 CV curves of 2 × 10⁻⁴ mol L−1 HQ at GCE (a), poly-L-glu/GCE (b), nano-Co/GCE (c) and nano-Co/poly-L-glu/GCE (d) in 0.2 M PBS solution(pH = 7.0). | ||
In addition, according to the Randles–Sevcik formula Ip = 2.69 × 10⁵n3/2Acd1/2v1/2, in which A is the electrode area, c is the concentration, D is the diffusion coefficient, v is the scan rate, and the effective surface areas of nano-Co/poly-L-glu/GCE and the bare GCE were calculated to be 0.035 cm2 and 0.025 cm2 respectively, indicating that the effective surface area of the nano-Co/poly-L-glu/GCE was increased by 1.4 times. Based on the coaction of poly-L-glu and nano-Co, the effective area of the electrode increased and the catalytic capacity improved.
Optimization of the experimental parameters
A good linear relationship between Epa and pH was constructed with the linear regression equation as Epa = −0.0548pH + 0.5950, and the correlation coefficient as 0.9905 (inset). The slope of the equation was −54.8 mV pH−1, similar to −59 mV pH−1, which indicated that the equal proton and equal electron reaction of HQ reacted on the sensor nano-Co/poly-L-glu/GCE.
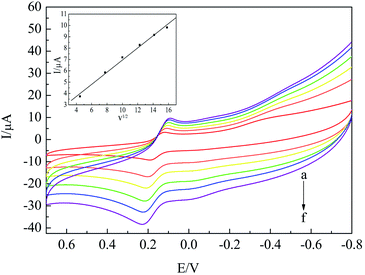 | ||
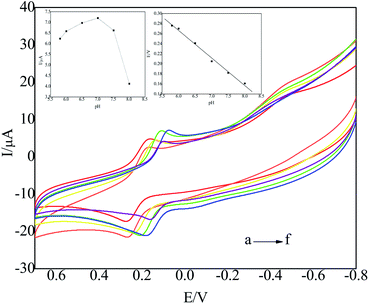
| Fig. 7 CV curves of HQ on nano-Co/poly-L-glu/GCE at different scanning rates from (a) to (f) as 20, 60, 100, 150, 200 and 250 mV s−1. | ||
It can be seen from Fig. 7 that the oxidation peak current of HQ increased with an increase in the scanning rate. The square root of the scanning rate had a good linear relationship with the oxidation peak current of HQ. The linear correlation coefficient was equal to 0.9922, and the linear regression equation was Ipa (μA) = 0.5353v1/2 + 1.5919 (inset), which showed that the redox reaction of HQ on the sensor was controlled by diffusion. However, in order to maintain the stability of the electrode, the reversibility of the redox reaction and to reduce the influence of the background current, 100 mV s−1 was chosen as the scanning rate of the experiment.
Calibration curve
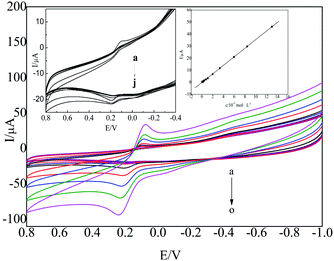
Under the optimum experimental conditions, the CV method was used to determine HQ. The CV curve of the oxidation peak current of HQ with varied concentrations was obtained, as shown in Fig. 9.The oxidation peak current of HQ had a good linear relationship with its concentration in the range from 3.85 × 10⁻⁶ to 1.30 × 10⁻³ mol L−1, which is shown in the inset of Fig. 9. The linear regression equation was I (μA) = 3.5556c (10−4 mol L−1) − 0.1100 (R2 = 0.9998). The detection limit was as low as 4.97 × 10⁻⁷ mol L−1.
There were numerous reported methods for the detection of HQ using different modified electrodes as sensors, but as compared to the results of other sensors (Table 1), the linear range of nano-Co/poly-L-glu was wider or the detection limit of nano-Co/poly-L-glu was lower.
| Electrode | Linear range/mol L−1 | Detection limit/mol L−1 | Method | literature |
|---|---|---|---|---|
| Meso-Co3O4-modified electrode | 1.0 × 10⁻⁶ to 5.0 × 10⁻⁴ | 1 × 10⁻⁷ | Differential pulse voltammetry (DPV) | 23 |
| Graphene–chitosan-modified electrode | 1.0 × 10⁻⁶ to 3.0 × 10⁻⁴ | 7.5 × 10⁻⁷ | Differential pulse voltammetry (DPV) | 34 |
| p-Phenylalanine-modified electrode | 1.0 × 10⁻⁷ to 1.4 × 10⁻⁴ | 1.0 × 10⁻⁶ | Differential pulse voltammetry (DPV) | 37 |
| Poly glutamic acid-modified electrode | 5 × 10⁻⁶ to 8 × 10⁻⁵ | 1 × 10⁻⁶ | Differential pulse voltammetry (DPV) | 38 |
| Co3O4/MWCN-modified electrode | 1.0 × 10⁻⁶ to 8.0 × 10⁻⁴ | 5.6 × 10⁻⁶ | Differential pulse voltammetry (DPV) | 39 |
| GR–P4VP-modified electrode | 1.0 × 10⁻⁷ to 1.0 × 10⁻⁵ | 8.1 × 10⁻⁹ | Differential pulse voltammetry (DPV) | 40 |
| Poly L-glutamic acid/nano-cobalt-modified electrode | 3.85 × 10⁻⁶ to 1.30 × 10⁻³ | 4.97 × 10⁻⁷ | Cyclic voltammetry (CV) | This method |
Analytical performance
When the nano-Co/poly-L-glu/GCE sensor was continuously scanned for 8 times in the 2 × 10⁻⁴ mol L−1 HQ solution, the relative standard deviation (RSD) was 1.9%, and the oxidation peak potential did not shift during continuous scanning, indicating that the electrochemical sensor had a good stability. The relative standard deviation (RSD) in the intra-day analysis was 2.3% and that in the inter-day analysis was 3.5%, indicating that the poly-L-glu/nano-Co/GCE electrode presented high reproducibility. To investigate the selectivity of this experiment under the optimized conditions, ascorbic acid (2 × 10⁻⁴ mol L−1), resorcinol (2 × 10⁻⁴ mol L−1), catechol (2 × 10⁻⁴ mol L−1) and L-phenylalanine (2 × 10⁻⁴ mol L−1) were added into the HQ solution, respectively, and the results showed that there was no interference in the determination of HQ, which indicated that the sensor prepared by nano-Co/poly-L-glu had good selectivity.Analytical application
In order to evaluate the validity of the proposed method, the nano-Co/poly-L-glu/GCE was applied for standard addition recovery experiments for simulated water samples, as shown in Table 2. The recoveries calculated from Table 2 ranged from 97.2% to 102.6%, which showed that the electrochemical sensor based on nano-Co/poly-L-glu had a good application prospect for HQ detection.| Number | Sample content/mol L−1 | Scalar addition/mol L−1 | Measurements/mol L−1 | Recovery rate of standard addition/% |
|---|---|---|---|---|
| 1 | 1.80 × 10⁻⁴ | 2.88 × 10⁻⁵ | 2.09 × 10⁻⁴ | 100.7 |
| 2 | 1.80 × 10⁻⁴ | 5.75 × 10⁻⁵ | 2.39 × 10⁻⁴ | 102.6 |
| 3 | 1.80 × 10⁻⁴ | 1.42 × 10⁻⁴ | 3.18 × 10⁻⁴ | 97.2 |
Conclusion
Nano-Co/poly-L-glu modified GCE was prepared by the electrodeposition and electrochemical polymerization of nano-Co and poly-L-glu. It provided a new idea for the preparation of novel electrochemical sensors for HQ. The electrochemical sensor based on the modified electrode could not only effectively reduce the potential difference of HQ, but could also significantly increase the response current. The sensor has the advantages of simple fabrication, low cost, good reproducibility and selectivity. Therefore, the nano-Co/poly-L-glu electrochemical sensor has a good application prospect in the detection of HQ.Conflicts of interest
There are no conflicts to declare.Acknowledgements
This work was supported by Scientific Research Found of Mianyang Normal University (QD2015B03, MYSY2018T007), Key fund Project of Sichuan Provincial Department of Education (18ZA0256) and Department of Science and Technology of Sichuan Province (18YYJC1173).References
- F. A. Gorla, E. H. Duarte, E. R. Sartori and C. R. T. Tarley, Microchem. J., 2016, 124, 65 CrossRef CAS.
- J. Wang, J. N. Park, X. Y. Wei and C. W. Lee, Chem. Commun., 2003, 5, 628 RSC.
- M. J. Shen, Z. Zhang and Y. P. Ding, Microchem. J., 2016, 124, 209 CrossRef CAS.
- T. Y. Xie, Q. W. Liu, Y. R. Shi and Q. Y. Liu, J. Chromatogr. A, 2006, 1109, 317 CrossRef CAS.
- L. Fan, X. Li and X. Kan, Electrochim. Acta, 2016, 213, 504 CrossRef CAS.
- H. Kang and L. Z. Zhai, Anal. Lab., 2011, 30, 107 Search PubMed.
- F. R. Zeng, Y. Q. Xi, S. Q. Zhang, H. O. Qiu and Z. Y. Tang, Anal. Lab., 2008, 26, 76 Search PubMed.
- K. Jurical, I. B. Karačonji, S. Šegan, D. M. Opsenica and D. Kremer, Arh. Hig. Rada Toksikol., 2015, 66, 197 Search PubMed.
- H. M. Joseph and J. Andrzejczak, Isr. J. Chem., 1973, 411, 599 CrossRef.
- Sirajuddin, M. I. Bhanger, A. Niaz, A. Shah and A. Rauf, Talanta, 2007, 72, 546 CrossRef CAS.
- X. Luo, H. Zheng, Z. Zhang, M. Wang, B. Yang, L. Huang and M. Wang, Microchem. J., 2018, 137, 148 CrossRef CAS.
- E. Scobbie and J. A. Groves, Ann. Occup. Hyg., 1999, 743, 131 CrossRef.
- J. Zhou, X. Li, L. Yang, S. Yan, M. Wang, D. Cheng, Q. Chen, Y. Dong, P. Liu, W. Cai and C. Zhang, Anal. Chim. Acta, 2015, 899, 57 CrossRef CAS.
- F. Hu, S. Chen, C. Wang, R. Yuan, D. Yuan and C. Wang, Anal. Chim. Acta, 2012, 724, 40 CrossRef CAS.
- S. J. Li, C. Qian, K. Wang, B. Y. Hua, F. B. Wang, Z. H. Sheng and X. H. Xia, Sens. Actuators, B, 2012, 174, 441 CrossRef CAS.
- Q. Guo, J. Huang, P. Chen, Y. Liu, H. Hou and T. You, Sens. Actuators, B, 2012, 163, 179 CrossRef CAS.
- Y. Fu, Y. Lin, T. Chen and L. Wang, J. Electroanal. Chem., 2012, 687, 25 CrossRef CAS.
- G. H. Ribeiro, L. M. Vilarinho, T. d. S. Ramos, A. L. Bogado and L. R. Dinelli, Electrochim. Acta, 2015, 176, 394 CrossRef CAS.
- X. Feng, Y. Shi and Z. Hu, Mater. Chem. Phys., 2011, 131, 72 CrossRef CAS.
- C. Z. Zhao, J. Y. Liang, X. L. Gu and H. Liu, Chin. Chem. Lett., 2014, 25, 370 CrossRef CAS.
- J. Tashkhourian, M. Daneshi, F. Nami-Ana, M. Behbahani and A. Bagheri, J. Hazard. Mater., 2016, 318, 117 CrossRef CAS.
- A. T. E. Vilian, S. M. Chen, L. H. Huang, M. A. Ali and M. A. Fahad, Electrochim. Acta, 2014, 125, 503 CrossRef CAS.
- S. Cui, L. Li, Y. Ding and J. Zhang, J. Electroanal. Chem., 2016, 782, 225 CrossRef CAS.
- B. Unnikrishnan, P. L. Ru and S. M. Chen, Sens. Actuators, B, 2012, 169, 235 CrossRef CAS.
- J. Yu, W. Du, F. Zhao and B. Zeng, Electrochim. Acta, 2009, 54, 984 CrossRef CAS.
- Y. Song, M. Zhao, X. Wang, H. Qu, Y. Liu and S. Chen, Mater. Chem. Phys., 2019, 234, 217 CrossRef CAS.
- R. M. A. Tehrani, H. Ghadimi and S. Ab Ghani, Sens. Actuators, B, 2013, 177, 612 CrossRef CAS.
- W. Sun, Y. Wang, Y. Lu, A. Hu, F. Shi and Z. Sun, Sens. Actuators, B, 2013, 188, 564 CrossRef CAS.
- H. L. Guo, S. Peng, J. H. Xu, Y. Q. Zhao and X. F. Kang, Sens. Actuators, B, 2014, 19, 623 CrossRef.
- D. M. Zhao, X. H. Zhang, L. J. Feng, L. Jia and S. F. Wang, Colloids Surf., B, 2009, 74, 317 CrossRef CAS.
- L. A. Alshahrani, L. Liu, P. Sathishkumar, J. Nan and F. L. Gu, J. Electroanal. Chem., 2018, 815, 68 CrossRef CAS.
- C. Wei, Y. Zhao, J. Huo, Q. Yang, C. Hu and Y. Zhang, Int. J. Electrochem. Sci., 2017, 12, 1421 CrossRef CAS.
- P. Bai, G. Fan and F. Li, Mater. Lett., 2011, 65, 2330 CrossRef CAS.
- H. Yin, Q. Zhang, Y. Zhou, Q. Ma, T. Liu, L. Zhu and S. Ai, Electrochim. Acta, 2011, 56, 2748 CrossRef CAS.
- S. Erogul, S. Z. Bas, M. Ozmen and S. Yildiz, Electrochim. Acta, 2015, 186, 302 CrossRef CAS.
- M. Zhang, J. Ye, P. Fang, Z. Zhang, C. Wang and G. Wu, Electrochim. Acta, 2019, 317, 618 CrossRef CAS.
- L. Wang, P. Huang, J. Bai, H. Wang, L. Zhang and Y. Zhao, Int. J. Electrochem. Sci., 2006, 1, 403 CAS.
- L. Wang, J. Bai, H. Wang, L. Zhang and Y. Zhao, Int. J. Electrochem. Sci., 2007, 2, 123 CAS.
- Y. Song, M. Zhao, X. Wang, H. Qu, Y. Liu and S. Chen, Mater. Chem. Phys., 2019, 234, 217 CrossRef CAS.
- R. M. A. Tehrani, H. Ghadimi and S. A. Ghani, Sens. Actuators, B, 2013, 177, 612 CrossRef CAS.
| This journal is © The Royal Society of Chemistry 2020 |


