DOI:
10.1039/D0RA08122A
(Paper)
RSC Adv., 2020,
10, 39121-39129
Cycling system for decomposition of gaseous benzene by hydrogen peroxide with naturally Fe-containing activated carbon
Received
23rd September 2020
, Accepted 14th October 2020
First published on 26th October 2020
Abstract
For the removal of volatile organic compounds (VOCs) from environmental systems, gaseous benzene, a model VOC, was adsorbed on naturally Fe-containing activated carbon and subsequently, decomposed in the presence of de-ionized water, and low (0.03%, pH 6.5) and high (30%, pH 2.5) concentration H2O2 solutions. The intermediates produced during benzene decomposition were analyzed and compared using gas chromatography-mass spectrometry. After the decomposition process, the activated carbon sample was air dried. Three cycles were carried out with de-ionized water and low and high concentration H2O2 solutions as oxidants. The adsorption capacity of the activated carbon sample treated with DI water gradually decreased as the number of cycles increased. On the other hand, the benzene adsorption capacity of the activated carbon samples treated with the H2O2 solutions was improved due to the relatively higher specific surface areas of these samples. After treatment with the low-concentration H2O2 solution, intermediates such as glyoxylic acid, oxalic acid, phenol, malonic acid, and pyrocatechol were observed. After treatment with high-concentration H2O2 solution, intermediates such as glyoxylic acid, formic acid, and acetic acid were formed. With increasing H2O2 concentration, the number and the molecular weight of the intermediate formed by the oxidative degradation of benzene, simultaneously decreased. The Fenton reaction induced by naturally Fe-containing activated carbon and H2O2 could lead to more efficient decomposition of benzene.
1. Introduction
Volatile organic compounds (VOCs) are environmental contaminants that promote the production of ozone and photochemical smog in air, along with nitrogen oxides (NOx).1,2 Derwent et al. defined the photochemical ozone creation potential (POCP) as a parameter for quantifying the level of contribution of a compound to ozone formation.3 The POCP of a given VOC is expressed as a function of the concentration. Compounds derived from benzene such as 1,2,4-trimethylbenzene, alkylbenzenes, dialkylbenzenes, and trialkylbenzenes account for 30% of the major high-POCP compounds.4 Thus, various methods of oxidizing VOCs including benzene-derived molecules have been studied. Huang et al. proposed the oxidation of benzene by photocatalysis on TiO2 doped with transition metals (Mn, Co, Cu, and Fe) under UV irradiation. Under vacuum UV irradiation, ozone can react with phototacatalysts to produce O2 and ˙O. After the reaction of the produced ˙O with H2O, the generated ˙OH can oxidize gaseous benzene.5 The decomposition of VOCs using hydroxyl radical (˙OH) produced from H2O2 has been proposed.6 In the decomposition of organic compounds by hydroxyl radicals, H2O2 can be decomposed into ˙OH using ferrous ions as catalysts in the pH range of 3–3.5, in a process well known as the Fenton reaction. In the Fenton reaction, iron(II) is oxidized to iron(III) by hydrogen peroxide, forming a hydroxyl radical and a hydroxide ion in the process (eqn (1)).7 Iron(III) is then reduced to iron(II) by another molecule of hydrogen peroxide, forming a hydroperoxyl radical and a proton (eqn (2)). The net effect is the disproportionation of hydrogen peroxide to create two different oxygen-radical species, with water (H+ + OH−) as a byproduct (eqn (3)).| | |
Fe2+ + H2O2 → Fe3+ + ˙OH + OH−
| (1) |
| | |
Fe3+ + H2O2 → Fe2+ + ˙OOH + H+
| (2) |
| | |
2H2O2 → ˙OH + ˙OOH + H2O
| (3) |
Recently, Aziz and Kim et al. reported the effective oxidation of VOCs on a zeolite (ZSM-5) modified with Fe under UV irradiation.8 Water molecules adsorbed on ZSM-5 were oxidized to H2O2 under UV, and the produced H2O2 could effectively oxidize the VOCs adsorbed on naturally Fe-containing ZSM-5 by the Fenton reaction. Furthermore, Takeuchi et al. reported that, compared to a hydrophilic zeolite structure, a relatively hydrophobic zeolite exhibited comparatively high capacity for benzene adsorption.9 Rey et al. compared the adsorption and decomposition of phenol on different pristine commercial activated carbons versus on the carbon samples modified with iron(III) nitrate (Fe(NO3)3) or iron pentacarbonyl (Fe(CO)5).10 The improved adsorption capacity and decomposition reaction were higher for the modified samples because of the Fenton reaction involving the iron compounds on the activated carbon and H2O2. Recently, Yang et al. reported the oxidation and decomposition of phenol on Zeolite Socony Mobil-5 (ZSM-5) modified with different concentrations of iron compounds and also found that phenol oxidation was maximal on ZSM-5 containing an optimum amount of Fe.11 In the present study, the benzene adsorption capacity of the activated carbon samples modified by metals was increased. However, for pilot-scale applications, we used naturally Fe-containing activated carbon sample for the effective oxidation of benzene. In this study, (1) gaseous benzene was completely adsorbed on naturally Fe-containing activated carbon sample filled in a reactor and (2) then the various solutions (de-ionized (DI) water and low (0.03%, pH 6.5)- and high (30%, pH 2.5)-concentrated H2O2 solutions) were inserted in the reactor to oxidize the benzene molecules. For the decomposition of benzene, the intermediates were analyzed and compared using gas chromatography-mass spectrometry analysis (GC-MS). Finally, after the oxidation process, (3) the activated carbon sample was dried by air. The steps from (1) to (3) were denoted as “one cycle”. Herein, three cycles were carried out with DI water and low and high concentration H2O2 solutions as oxidants.
2. Experimental section
2.1. Materials
Coal activated carbon (AC, SGP-100, Samchully Co., Korea) in a pellet type powder (diameter = 4 mm, length = 10 mm) was used as an adsorbent for the VOCs. For application to a mini-column (inner diameter: 6 mm, length: 100 mm), the activated carbon powder was cut and collected with 10–14 mesh (1.4–2.0 mm) using a sieve shaker. The collected activated carbon powder was washed with DI water several times to remove impurities and then dried in a 105 °C oven for 24 h. After drying, to avoid adsorption of water by the washed activated carbon, the sample was stored in a desiccator. The low (0.03%, pH = 6.5) and high (30%, pH = 2.5) concentration H2O2 solutions were prepared using H2O2 (Samchun Co., Korea). The concentration of the solution was confirmed by using a measuring kit (Kyoritsu, Japan).
2.2. Benzene adsorption experiment
The naturally Fe-containing activated carbon powder (0.5 g) was loaded into a transparent tube (h = 3.2 cm) that was used as a mini-column and was fixed with static mixers in the top and bottom of the tube. First, to confirm the maximum benzene adsorption capacity of the prepared activated carbon, benzene gas (100 ppmv) was introduced into the column at a flow rate of 2 L min−1. The activated carbon layer and benzene gas were allowed to react for 0.001 s. To investigate the correlation between benzene decomposition and the concentration of H2O2, DI water and low and high concentration H2O2 solutions were circulated in the column filled with the benzene-adsorbed activated carbon powder at a flow rate of 24 mL min−1 for 2 h. Air was then introduced into the column at a flow rate of 2 L min−1 to remove the decomposition benzene products or compounds desorbed from the activated carbon sample. In this study, the cycle compromising the adsorption, oxidation, and desorption processes was performed four times with de-ionized water and low- and high-concentration H2O2 solutions as oxidants, respectively. Fig. 1 show schematic diagram of cycling system for gaseous benzene adsorption and H2O2 oxidation. The output concentration of benzene gas was automatically analyzed every 5 min using a gas chromatography-flame ionization detector (GC-FID, column: Agilent HP-5 (300 cm, 0.32 mm, 0.25 μm)) with a 6-port valve. The adsorption capacity of the columns filled with the activated carbon powder samples treated with DI water and low- and high-concentration H2O2 solutions was calculated and compared by normalizing the input and output concentrations.
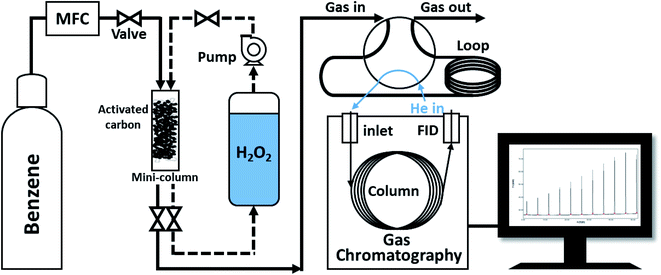 |
| | Fig. 1 Schematic diagram of cycling system for gaseous benzene adsorption and H2O2 oxidation. | |
2.3. Structural and chemical characterization
The N2 adsorption/desorption isotherms of the activated carbon powder samples treated with DI water and low- and high-concentration H2O2 solutions were characterized using an ASAP 2020 adsorption analyzer (Micromeritics, USA) at 77 K. Before the analysis, all of the samples were degassed at 573 K for 180 min. The specific surface area and pore size distribution were calculated using the Brunauer–Emmett–Teller (BET) equation from the date in the relative pressure range of 0.01–0.3 and by applying the Barrett–Joyner–Halenda (BJH) method, respectively. The crystal structure of the samples was confirmed by using an X-ray diffractometer (XRD, Bruker AXS, D2 Phaser, USA) operating at 30 kV and 10 mA with a Cu Kα1 radiation source (λ = 1.5418 Å) and a nickel filter. Thermogravimetric analysis (TGA) was conducted using a thermal analyzer (SDTA851, Mettler Toledo) in the range of 25–600 °C under air flow at 60 cm3 min−1. To analyze the surface functional groups of the samples, the Fourier-transform infrared spectra (FT-IR, Vertex 70, Bruker, USA) were acquired with a DLaTGS detector equipped with a KBr window. For the FT-IR analysis, pellet samples were prepared from the fine powder sample and KBr, which were compressed under a pressure of 15 MPa. Gas chromatography-mass spectrometry analysis (GC-MS, 7890B-5977A, Agilent Technologies, USA) with a column (Agilent HP-5MS UI (300 cm, 0.32 mm, 0.25 μm)) was utilized to identify the compounds or intermediates formed during oxidation of benzene by H2O2. The headspace method was applied for efficient analysis of the VOCs in the liquid solution. The liquid samples were stored in a dark room at <4 °C to prevent transformation of the VOCs. X-ray photoelectron spectroscopy (XPS, Thermo scientific, K-Alpha) was carried out with Al Kα X-ray of 1468.8 eV and beam power of 200 W under a chamber pressure of 7.8 × 10⁻⁹ torr.
3. Results and discussion
3.1. Evaluation of gaseous benzene adsorption capacity of activated carbon
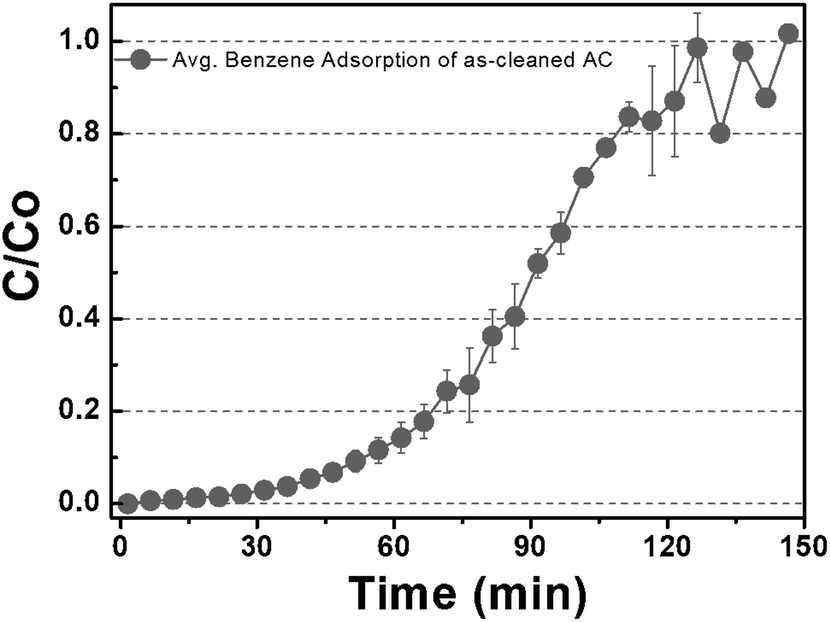
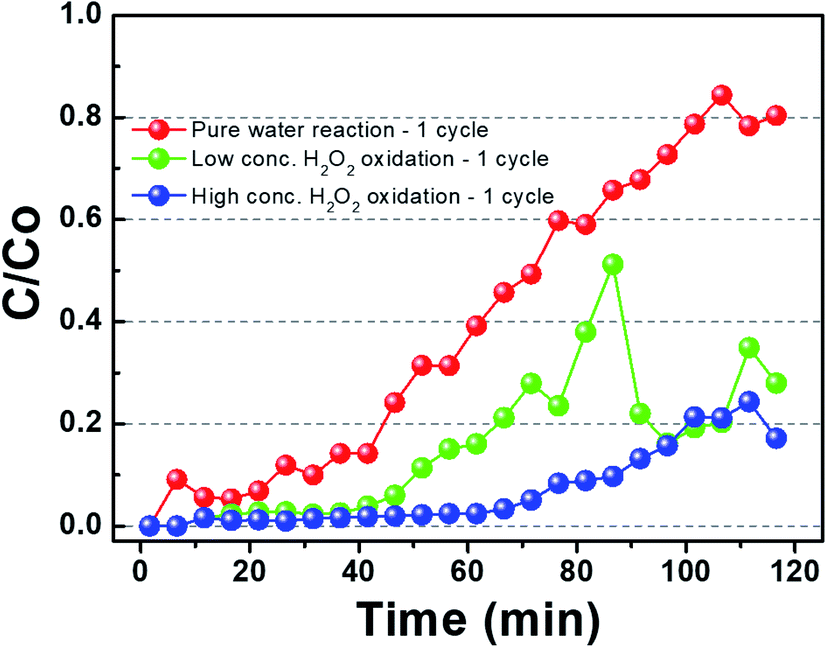
Fig. 2 shows the benzene adsorption capacity of the as-cleaned activated carbon loaded into the mini-column, measured over one cycle. The maximum average benzene adsorption capacity was 110.74 mg g−1, i.e., the maximum amount of benzene adsorption per 1 gram of activated carbon, with breakthrough at a reaction time of 135 ± 15 min. The measured values were utilized to apply to a reactor, filled with activated carbon, linked to GC-FID. After complete adsorption of benzene on the activated carbon, DI water and low- and high-concentration H2O2 solutions were supplied to the reactor filled with the benzene-adsorbed activated carbon and air was then introduced into the column to remove the benzene decomposition products or desorbed compounds. This process, i.e., benzene adsorption, solution treatment, and air drying, is denoted as one cycle. Fig. 3 shows the adsorption capacity of the activated carbon samples after the 1st cycle. Based on the solution treatment, the benzene adsorption capacity of the activated carbon followed the order: high-concentration H2O2 (93%) > low-concentration H2O2 (85%) > DI water (61%).
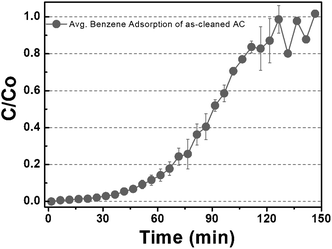 |
| | Fig. 2 Gaseous benzene adsorption capacity of the as-cleaned activated carbon sample. (The maximum adsorption capacity of gaseous benzene was observed for 120 min before inserting water and H2O2.) | |
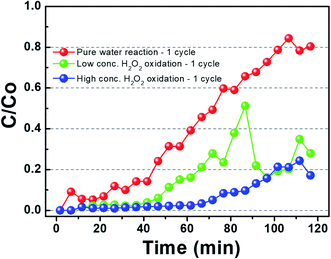 |
| | Fig. 3 Gaseous benzene adsorption by activated carbon the presence of hydrogen peroxide for 1 cycle. (Benzene was adsorbed before the saturation and then sufficiently desorbed to calculate the amount of desorption.) | |
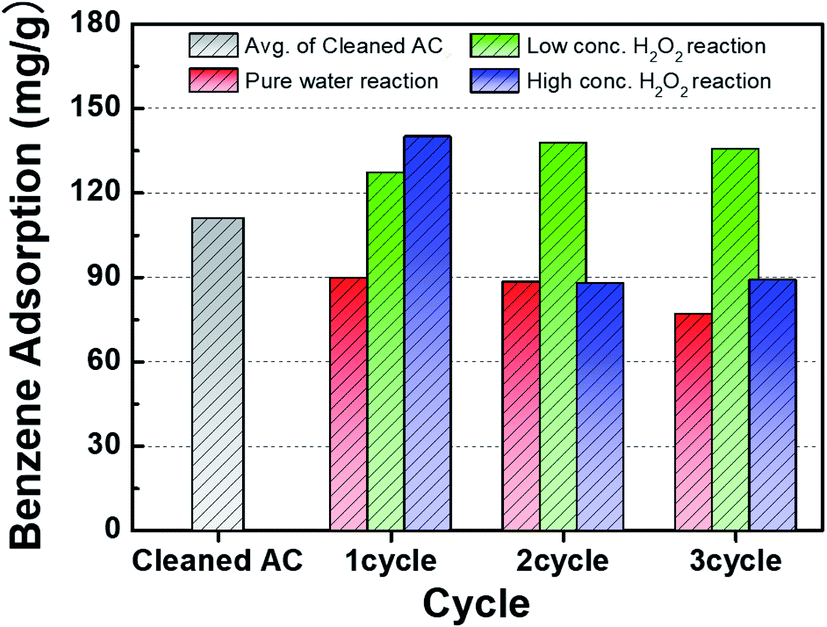
Fig. 4 presents a comparison of the benzene adsorption capacity of the activated carbon samples treated with DI water and low- and high-concentration H2O2 solutions. Compared to the adsorption capacity of the cleaned activated carbon, the adsorption capacity of the activated carbon sample treated with DI water gradually decreased as the number of cycles increased. The improvement of the adsorption capacity of the activated carbon samples treated with the H2O2 solutions in the 1st cycle can be attributed to the relative increase in the specific surface area (Table 1). In particular, compared to the activated carbon sample treated with the low-concentration H2O2 solution, the higher adsorption capacity of the activated carbon sample treated with the high-concentration H2O2 solution may result from the higher specific surface area. The contents of H2O molecules after H2O2 solution treatment were compared. The hydrophilicity in the activated carbon samples increased as observed from FT-IR analysis (Fig. 8). The activated carbon sample treated with the low-concentration H2O2 solution maintained the maximum adsorption capacity during cycling. However, the adsorption capacity of the activated carbon sample treated with the high-concentration H2O2 solution increased capacity in the 2nd cycle, followed by a significant decrease. Specifically, the cycling process in the high-concentration H2O2 solution at pH 2.5 might confer significant hydrophilicity to originally hydrophobic activated carbon sample. Compared to the sample treated with the high-concentration H2O2 solution, the relatively increased hydrophilicity of the surface of the activated carbon sample treated with the high-concentration H2O2 solution may reduce adsorption capacity as benzene is typically hydrophobic.12,13
 |
| | Fig. 4 Comparison of gaseous benzene adsorption on activated carbon samples after treatment with DI water and H2O2 solutions during cycling. | |
Table 1 Characteristics of specific surface area and pore structure for the activated carbon samples after treatment with DI water and H2O2 solutions during cycling
| Activated carbon |
Cycle |
BET surface areaa (m2 g−1) |
Meso surface areaa (m2 g−1) |
Micro surface areab (m2 g−1) |
Micro pore volumec (cm3 g−1) |
Pore diameterd (nm) |
| Calculated using BET equation. Calculated using t-plot equation. Pore volume evaluated from the N2 adsorption–desorption isotherms. Peak pore size determined from BJH desorption branch. |
| Raw |
— |
682 |
212 |
470 |
0.23 |
2.06 |
| Pure water reaction |
1 |
675 |
176 |
499 |
0.23 |
2.06 |
| Low conc. H2O2 oxidation |
1 |
714 |
190 |
524 |
0.25 |
2.05 |
| Low conc. H2O2 oxidation |
3 |
681 |
184 |
497 |
0.23 |
2.06 |
| High conc. H2O2 oxidation |
1 |
743 |
203 |
539 |
0.26 |
2.05 |
| High conc. H2O2 oxidation |
3 |
775 |
238 |
537 |
0.25 |
2.05 |
3.2. Characterization of the treated activated carbon samples
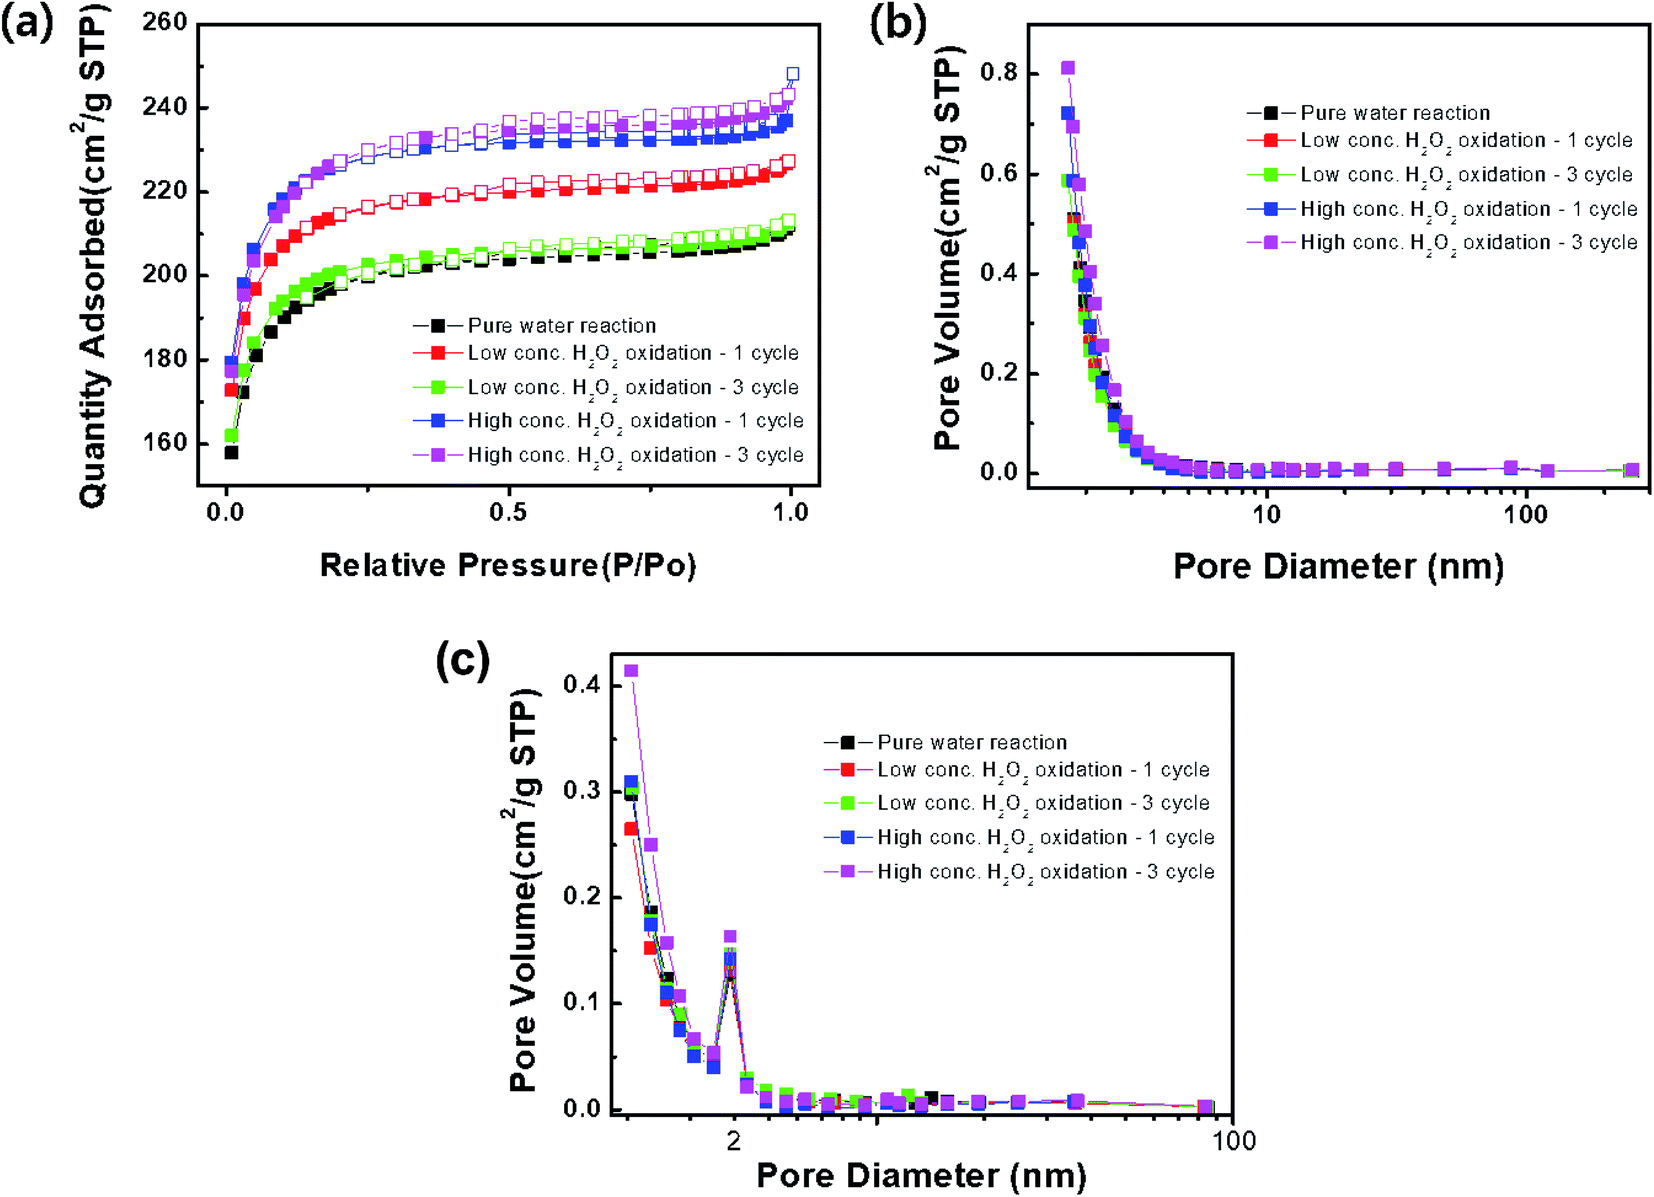
The specific surface area and pore structure of the activated carbon samples treated with DI water and low- and high-concentration H2O2 solutions were characterized as shown in Fig. 5 and Table 1. All of the samples exhibited Langmuir-type adsorption on the surfaces, where a monolayer is formed by fast adsorption. Furthermore, it is likely that the activated carbon sample consisted of narrow long pores with irregular inner shapes.14 Compared to the sample treated with DI water, the surface area of the samples treated with the H2O2 solutions increased, while the pore diameter was maintained at ∼2.0 nm, corresponding to a size between super micropores (0.7–2 nm) and small mesopores (2–2.5 nm). Chemical treatment with H2O2, strongly acidic, or strongly alkaline solutions might lead to the formation of ultra-micropores and the increased benzene adsorption capacity.15–17 Thus, after treatment with the high-concentration H2O2 solution, the surface area of the activated carbon sample increased after the 2nd and 3rd cycles.
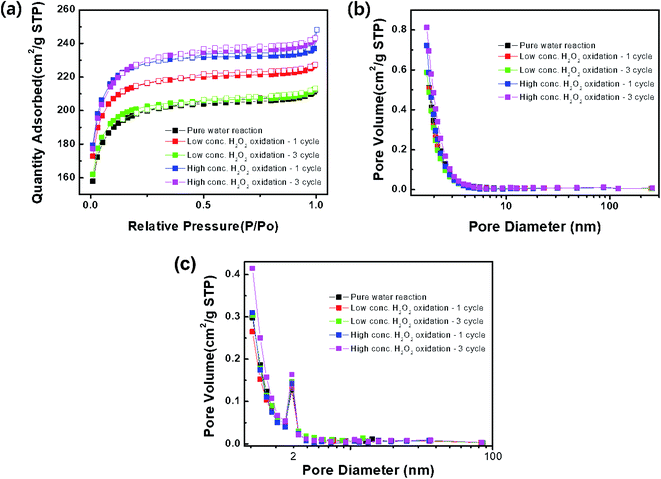 |
| | Fig. 5 (a) N2 adsorption (closed squares)–desorption (open squares) isotherms, (b) BJH adsorption and (c) desorption branch. | |
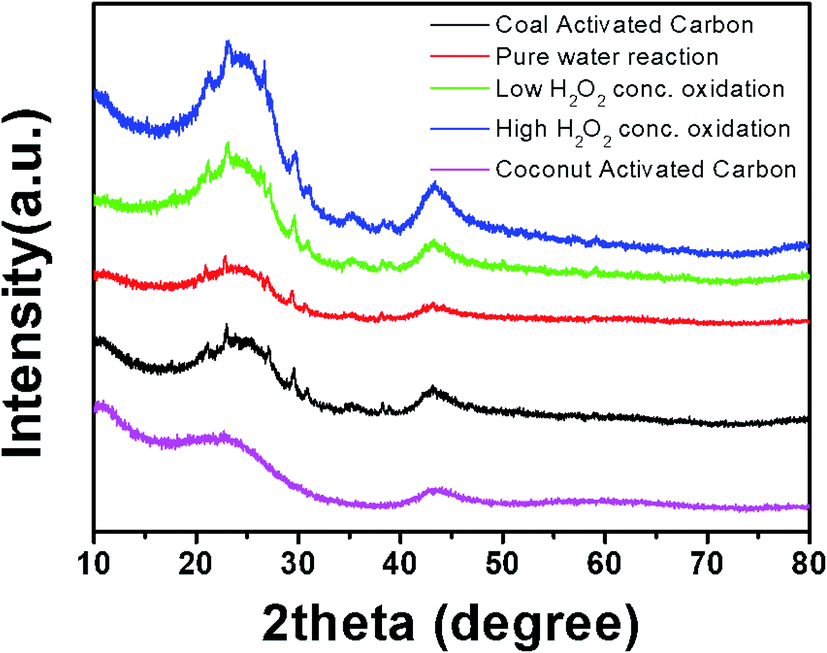
Fig. 6 shows the XRD patterns of the activated carbon samples treated with DI water and low- and high-concentration H2O2 solutions. The profiles of all of the samples showed the broad main characteristic peaks at ∼25° and ∼45°, corresponding to the (002) and (100) planes in the carbon crystal structure. In addition, interestingly, peaks of Fe-related phases such as Fe2O3 and Fe3O4, which catalyze carbon formation, were observed. The Fe-related phases can participate in the Fenton reaction, creating two different oxygen-radical species (˙OH and ˙OOH) through a disproportionation of H2O2.6,7 It has been reported that the free radicals can convert benzene into phenol or other oxidation products.18,19 Thus, it is expected that benzene adsorbed on the naturally Fe-containing activated carbon samples can be hydroxylated or oxidized through the Fenton reaction during treatment with the H2O2 solution (eqn(1)–(3)).
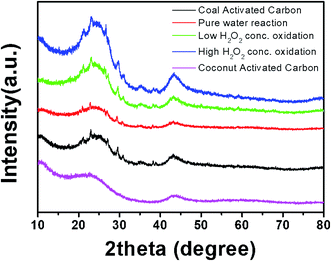 |
| | Fig. 6 XRD patterns of activated carbon samples after treatment with DI water and H2O2 solutions during cycling. | |
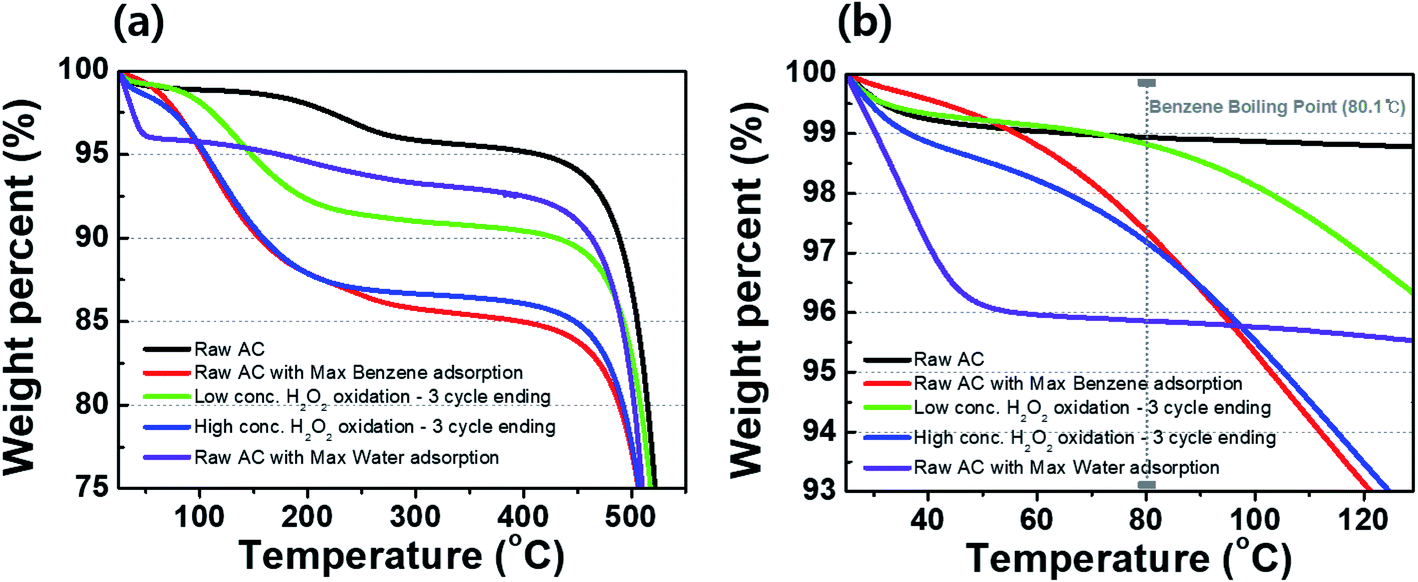
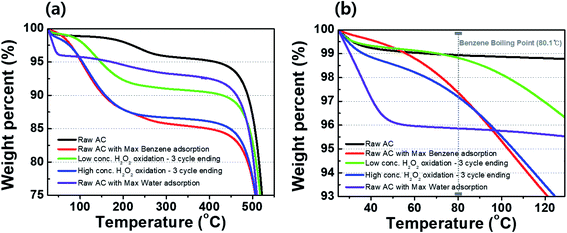
Fig. 7(a) shows the TGA curves of raw activated carbon and the activated carbon samples treated with DI water and low- and high-concentration H2O2 solutions. For the raw activated carbon sample, weight losses of ∼1% and ∼4% at 80 and 300 °C, respectively, caused by evaporation water molecules of the water molecules on the surface and in the pores (Fig. 7(b)). For the activated carbon sample with the maximum amount of adsorbed benzene, a weight loss of ∼15% was observed up to 300 °C. As previously measured, the maximum benzene adsorption for the activated carbon used in this study was 110.74 mg g−1, corresponding to ∼10% of the total weight of the activated carbon. Thus, the weight loss of ∼15% may be the sum of adsorbed benzene (∼10%) and water molecules (∼4%). The weight losses in the activated carbon sample treated with the low-concentration H2O2 solution might result from minor water evaporation at 80 °C (∼1%) and the evaporation of benzene at >80 °C. Compared to the activated carbon sample treated with the low-concentration H2O2 solution, the activated carbon sample treated with and high-concentration H2O2 solution exhibited a greater weight loss of ∼3% at 80 °C, suggesting a partial transition of the activated carbon sample from hydrophobic to hydrophilic.12,13
 |
| | Fig. 7 TGA curves of activated carbon samples after treatment with DI water and H2O2 solutions during cycling in (a) the wide range and (b) the vicinity of a boiling point of benzene. | |
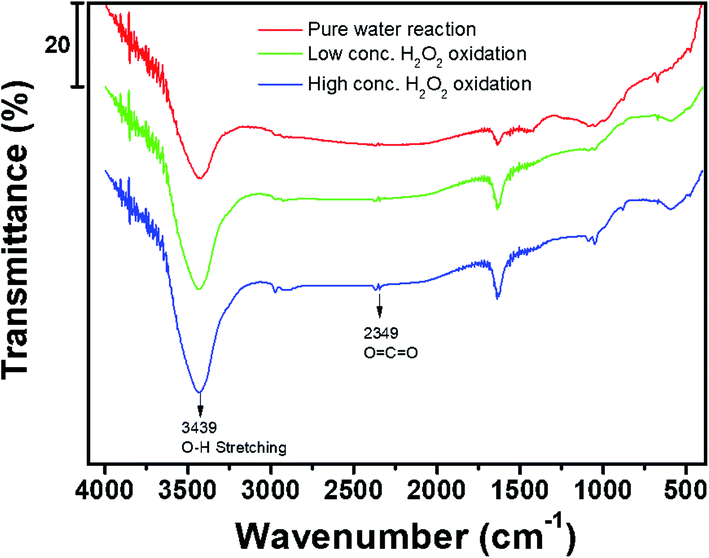
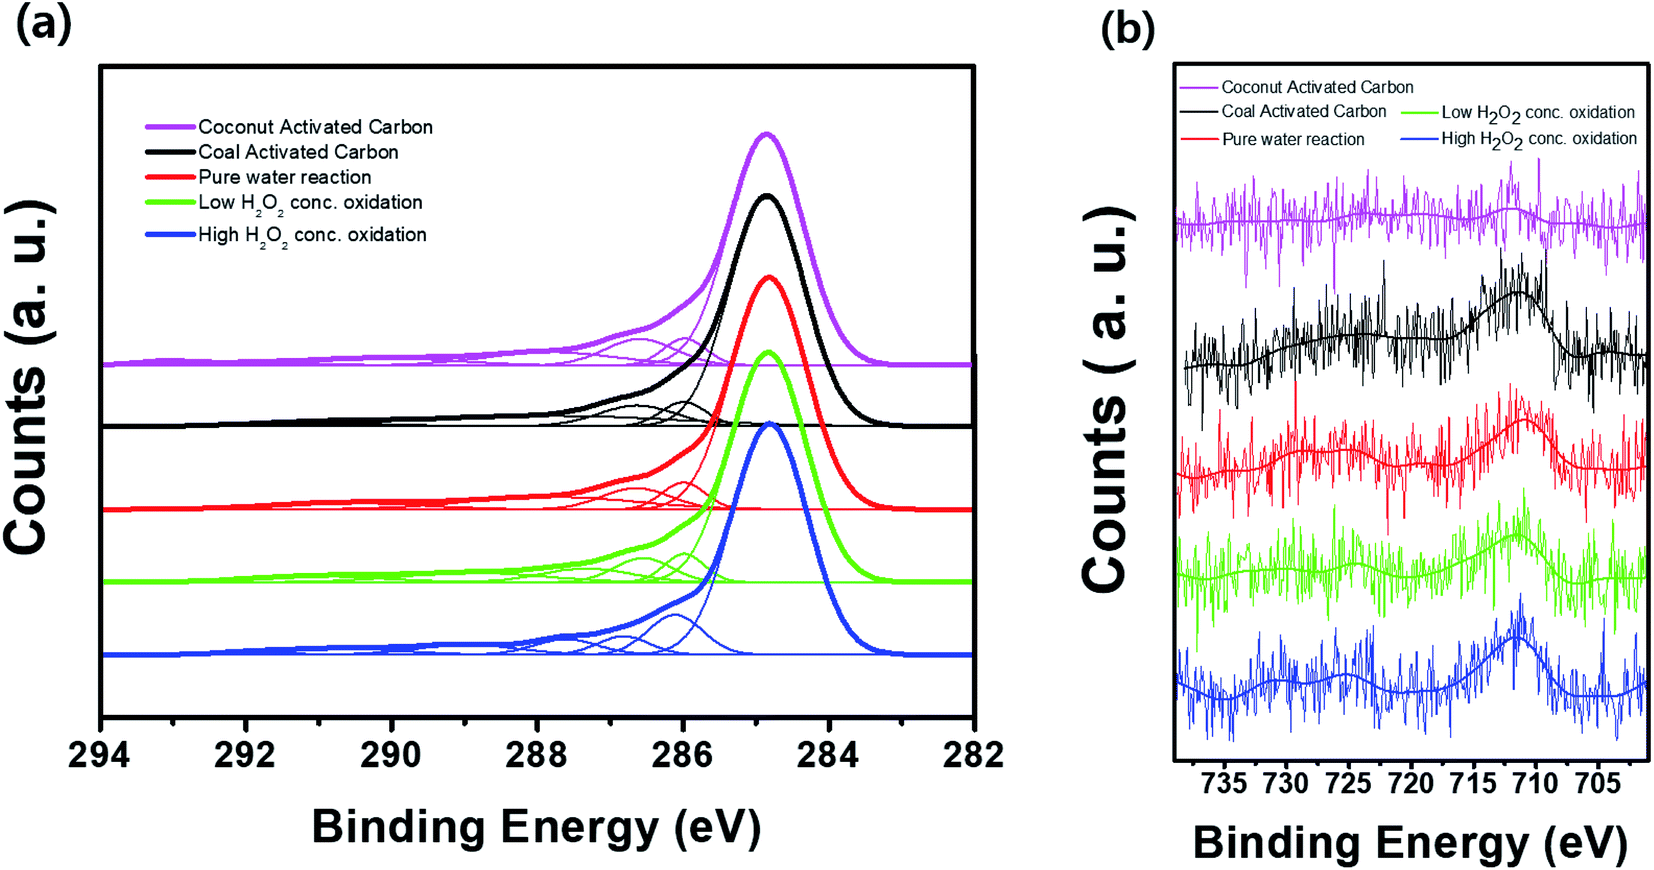
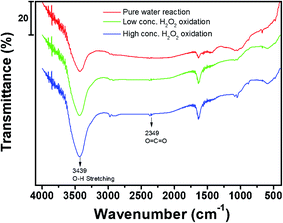
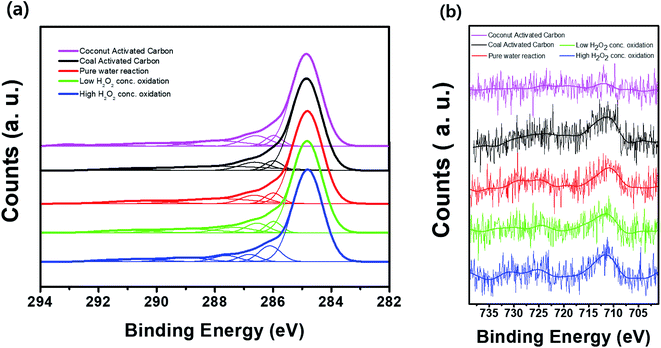
Fig. 8 shows the FT-IR spectra of the activated carbon samples treated with DI water and low- and high-concentration H2O2 solutions. The main characteristic peak at 3550–3200 cm−1 corresponds to the hydroxyl (O–H) stretching group, which may be related to the hydrogen bonding from adsorbed water molecules, alcohol, or phenol compounds.15,20,21 In particular, the FT-IR profiles of the samples treated with the H2O2 solutions showed the characteristic peak corresponding to the O![[double bond, length as m-dash]](https://www.rsc.org/images/entities/char_e001.gif) CO group at ∼2349 cm.22–24 Compared to the sample treated with the low-concentration H2O2 solution, the characteristic peak at 3550–3200 cm−1 in the profile of the activated carbon sample treated with the high-concentration H2O2 solution indicates relatively increased hydrophilicity of the activated carbon because of the hydroxyl (O–H) group.25–27 Even though the activated carbon sample treated with the high-concentration H2O2 solution has higher surface area than low-concentration H2O2 solution, the benzene adsorption capacity of the activated carbon sample treated with high-concentration H2O2 was reduced because of the increased hydrophilicity of catalyst.20,21,27 Fig. 9 shows the XPS C 1s and Fe 2p spectra of the activated carbon samples before and after treatment with DI water and H2O2 solutions. Especially, the chemical state and the existence of Fe in the activated carbon samples prepared with coal as a carbon source was compared with the activated carbon prepared with coconut as a carbon source. In the C 1s spectra, all the sample exhibited the XPS characteristic peaks at 282.8, 286.0, and 286.6 eV corresponding to graphitic carbon (C–C), hydrocarbon (C–H), and hydroxyl group (C–OH), respectively.28,29 However, in contrast to the activated carbon prepared with coconut, the activated carbon samples prepared with coal contained the chemical states of Fe2+ (∼708.4 eV) and Fe3+ (∼711.3 eV) mainly resulting from Fe3O4 and Fe3O4/Fe2O3, respectively, which may contribute to the Fenton reaction during treatment with the H2O2 solution.30
CO group at ∼2349 cm.22–24 Compared to the sample treated with the low-concentration H2O2 solution, the characteristic peak at 3550–3200 cm−1 in the profile of the activated carbon sample treated with the high-concentration H2O2 solution indicates relatively increased hydrophilicity of the activated carbon because of the hydroxyl (O–H) group.25–27 Even though the activated carbon sample treated with the high-concentration H2O2 solution has higher surface area than low-concentration H2O2 solution, the benzene adsorption capacity of the activated carbon sample treated with high-concentration H2O2 was reduced because of the increased hydrophilicity of catalyst.20,21,27 Fig. 9 shows the XPS C 1s and Fe 2p spectra of the activated carbon samples before and after treatment with DI water and H2O2 solutions. Especially, the chemical state and the existence of Fe in the activated carbon samples prepared with coal as a carbon source was compared with the activated carbon prepared with coconut as a carbon source. In the C 1s spectra, all the sample exhibited the XPS characteristic peaks at 282.8, 286.0, and 286.6 eV corresponding to graphitic carbon (C–C), hydrocarbon (C–H), and hydroxyl group (C–OH), respectively.28,29 However, in contrast to the activated carbon prepared with coconut, the activated carbon samples prepared with coal contained the chemical states of Fe2+ (∼708.4 eV) and Fe3+ (∼711.3 eV) mainly resulting from Fe3O4 and Fe3O4/Fe2O3, respectively, which may contribute to the Fenton reaction during treatment with the H2O2 solution.30
 |
| | Fig. 8 FT-IR spectra of activated carbon samples after treatment with DI water and H2O2 solutions during cycling. | |
 |
| | Fig. 9 XPS (a) C 1s and (b) Fe 2p spectra of the activated carbon samples before and after treatment with DI water and H2O2 solutions during cycling. | |
3.3. Benzene decomposition
In the Fenton reaction, the Fe-related phases and H2O2 could produce two oxygen-radical species via the disproportionation of H2O2.31 Thus, during treatment with the H2O2 solution, benzene adsorbed on the naturally Fe-containing activated carbon samples can be hydroxylated or oxidized to phenol or other oxidation products.18,19 It was reported that H2O2 on activated carbon could be decomposed into hydroxyl groups based on the Haber–Weiss mechanism and that the formation rate of hydroxy radicals at pH > 8.0 might be low.32–34| | |
Activated carbon + H2O2 → activated carbon+ + OH− + ˙OH
| (4) |
| | |
Activated carbon+ + H2O2 → activated carbon + ˙OOH + H+
| (5) |
The intermediates adsorbed on the activated carbon samples treated with DI water (pH = 7.0) and low- (pH = 6.5) and high (pH = 2.5)-concentration H2O2 solutions were characterized using GC-MS (Table 2).
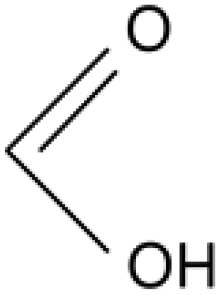
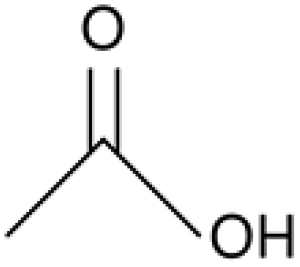
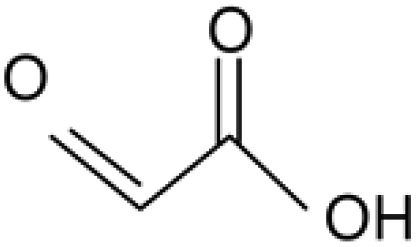
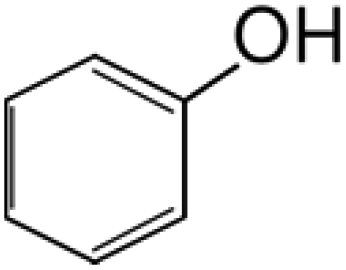
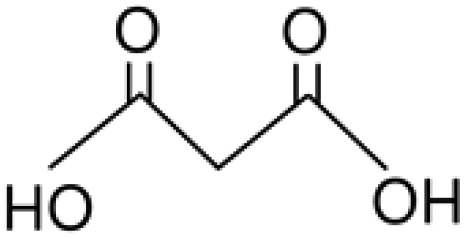
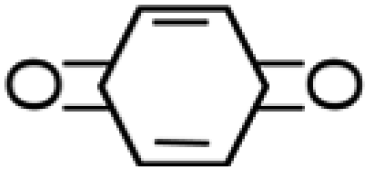
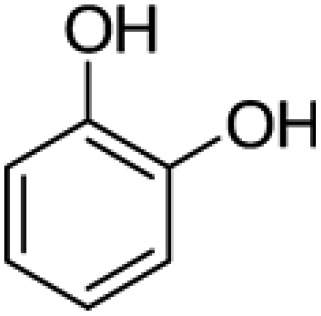
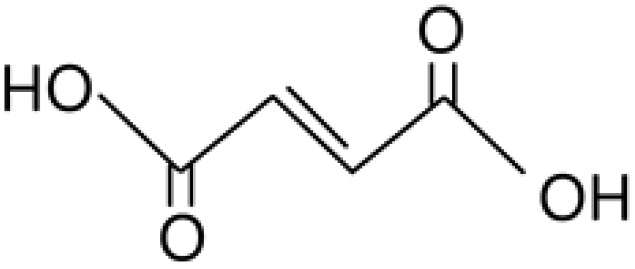
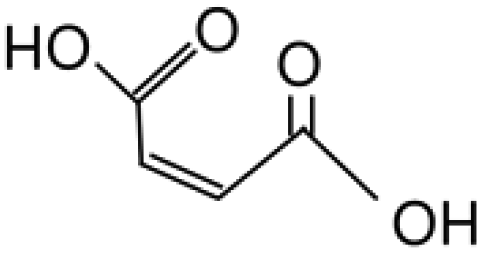
Table 2 Comparison of intermediates adsorbed on the activated carbon samples treated with DI water and H2O2 solution
| Results |
Reference |
| Reaction |
Pure water |
Low H2O2 |
High H2O2 |
Structure |
| Division |
Molecular weight |
Intermediates |
Molecular weight |
Intermediates |
Molecular weight |
Intermediates |
| 1 |
— |
— |
46.03 |
Formic acid |
 |
Liu et al., 2017 (ref. 19); Hara, 2017 (ref. 18) |
| 2 |
— |
— |
60.05 |
Acetic acid |
 |
Liu et al., 2017 (ref. 19); Hara, 2017 (ref. 18) |
| 3 |
74.04 |
Glyoxylic acid |
74.04 |
Glyoxylic acid |
74.04 |
Glyoxylic acid |
 |
Hara, 2017 (ref. 18) |
| 4 |
90.03 |
Oxalic acid |
90.03 |
Oxalic acid |
— |
 |
Liu et al., 2017 (ref. 19); Hara, 2017 (ref. 18) |
| 5 |
— |
94.11 |
Phenol |
— |
 |
Liu et al., 2017 (ref. 19); Hara, 2017 (ref. 18) |
| 6 |
104.06 |
Malonic acid |
104.06 |
Malonic acid |
— |
 |
Hara, 2017 (ref. 18) |
| 7 |
108.10 |
P-Benzoquinone |
— |
— |
 |
Liu et al., 2017 (ref. 19) |
| 8 |
— |
110.01 |
Pyrocatechol |
— |
 |
Liu et al., 2017 (ref. 19) |
| 9 |
116.07 |
Fumaric acid |
— |
— |
 |
Hara, 2017 (ref. 18) |
| 10 |
116.07 |
Maleic acid |
— |
— |
 |
Hara, 2017 (ref. 18) |
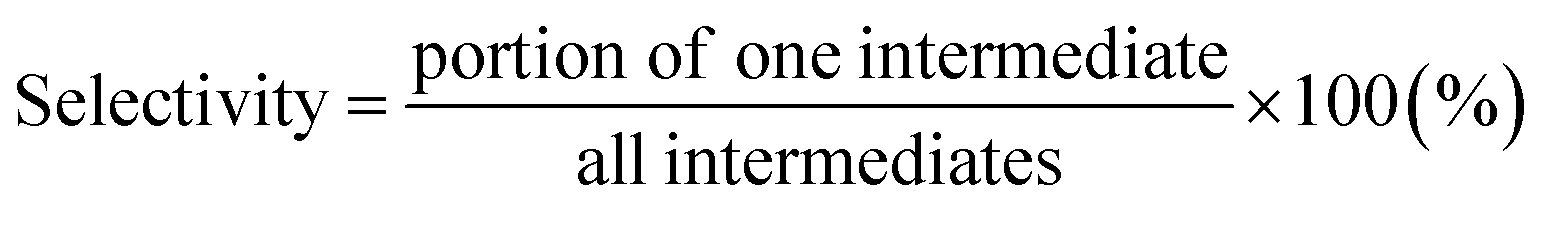
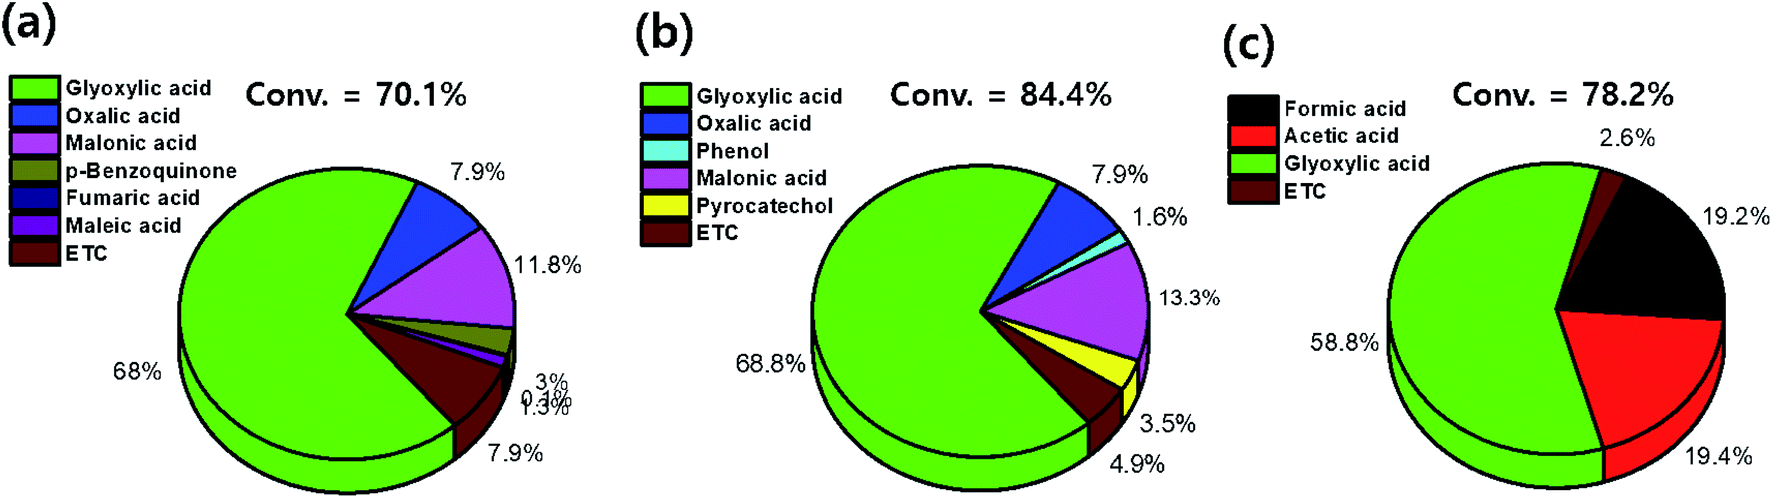
Furthermore, the conversion of benzene and selectivity of intermediates after treatments were determined from the GC-FID data as follows:
| |
 | (6) |
| |
 | (7) |
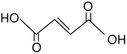
The conversion values of benzene after treatments with DI water and low- and high-concentration H2O2 solutions were 70.1%, 84.4%, and 78.2%, respectively. After treatment with the low-concentration H2O2 solution, intermediates such as glyoxylic acid (68.8%), oxalic acid (7.9%), phenol (1.6%), malonic acid (13.3%), and pyrocatechol (3.5%) were observed (Fig. 10). Furthermore, after treatment with the high-concentration H2O2 solution, intermediates such as formic acid (19.2%) and acetic acid (19.4%) were dominantly detected. With increasing H2O2 concentration, the number and the molecular weight of the intermediates, formed by the oxidative degradation of benzene, simultaneously decreased. In general, organic compounds and aromatic compounds can be effectively oxidized by the hydroxy groups formed in the H2O2 solution upon treatment with Fe or UV radiation.8,35 However, it is interesting that even after the oxidative degradation of benzene via treatment with DI water, various resulting intermediates such as glyoxylic acid, oxalic acid, malonic acid, p-benzoquinone, fumaric acid, and maleic acid were observed. This demonstrates that benzene can be decomposed into various intermediates by heat generated from the reaction of activated carbon with DI water or H2O2 solution.19,36–39 Thus, the paths for decomposition of benzene involve benzene ring excitation or pyrolysis.40,41 However, herein, in the first step (in DI water), benzene was decomposed into maleic acid and fumaric acid (Table 2). The decomposition intermediates were then decomposed into glyoxylic acid, malonic acid, and oxalic acid through the 2nd step (in low-concentration H2O2 solution). Finally, the intermediates were decomposed into acetic acid and/or formic acid through high-concentration H2O2 solution. Consequently, in this study, the Fenton reaction in the presence of the naturally Fe-containing activated carbon and H2O2 could lead to more efficient decomposition of benzene due to the hydroxyl radicals produced during the Fenton reaction.
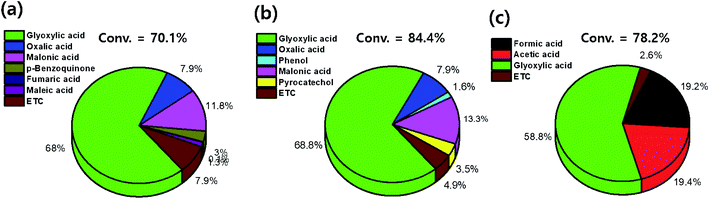 |
| | Fig. 10 Conversion of benzene and selectivity of the intermediates on activated carbon treated with (a) pure water, (b) low-conc. H2O2, and (c) high-conc. H2O2 solutions. | |
4. Conclusions
In summary, gaseous benzene adsorbed on naturally Fe-containing activated carbon was decomposed using de-ionized water and low- and high-concentration H2O2 solutions. Compared to the activated carbon sample treated with DI water, the benzene adsorption capacity of the activated carbon samples treated with the H2O2 solutions was improved due to an increase in the specific surface area. In addition, with increasing H2O2 concentration, the number and molecular weight of the intermediates, formed by the oxidative degradation of benzene simultaneously decreased. Consequently, the Fenton reaction in the presence of the naturally Fe-containing activated carbon and H2O2 could lead to the more efficient decomposition of benzene due to the hydroxyl radicals produced during the reaction.
Conflicts of interest
There are no conflicts to declare.
Acknowledgements
This research was supported by the National Research Foundation of Korea (NRF) (2017M1A2A2086648 and 2020R1A6A1A03044977).
References
- R. Atkinson, Atmos. Environ., 2000, 34, 2063–2101 CrossRef CAS.
- I. Jhun, B. A. Coull, A. Zanobetti and P. Koutrakis, Air Qual., Atmos. Health, 2015, 8, 283–292 CrossRef CAS.
- R. G. Derwent, M. E. Jenkin and S. M. Saunders, Atmos. Environ., 1996, 30, 181–199 CrossRef CAS.
- M. E. Jenkin, R. G. Derwent and T. J. Wallington, Atmos. Environ., 2017, 163, 128–137 CrossRef CAS.
- H. Huang, H. Huang, L. Zhang, P. Hu, X. Ye and D. Y. C. Leung, Chem. Eng. J., 2015, 259, 534–541 CrossRef CAS.
- F. Haber and J. Weiss, Naturwissenschaften, 1932, 20, 948–950 CrossRef CAS.
- H. J. H. Fenton, J. Chem. Soc., Trans., 1894, 65, 899–910 RSC.
- A. Aziz and K. S. Kim, J. Hazard. Mater., 2017, 340, 351–359 CrossRef CAS.
- M. Takeuchi, M. Hidaka and M. Anpo, J. Hazard. Mater., 2012, 237–238, 133–139 CrossRef CAS.
- A. Rey, M. Faraldos, J. A. Casas, J. A. Zazo, A. Bahamonde and J. J. Rodríguez, Appl. Catal., B, 2009, 86, 69–77 CrossRef CAS.
- Y. Yang, Y. Yan, H. Zhang and X. Wu, Sep. Purif. Technol., 2020, 237, 116452 CrossRef CAS.
- F. Ahnert, H. A. Arafat and N. G. Pinto, Adsorption, 2003, 9, 311–319 CrossRef CAS.
- C. Wang, S. Leng, H. Guo, L. Cao and J. Huang, Appl. Surf. Sci., 2019, 478, 319–326 CrossRef CAS.
- I. Piñeiro-Prado, D. Salinas-Torres, R. Ruiz-Rosas, E. Morallón and D. Cazorla-Amorós, Front. Mater., 2016, 3, 1–12 Search PubMed.
- Y. H. Kim and S. J. Park, Appl. Chem. Eng., 2010, 21, 183–187 CAS.
- K. J. Kim, C. S. Kang, Y. J. You, M. C. Chung, M. W. Woo, W. J. Jeong, N. C. Park and H. G. Ahn, Catal. Today, 2006, 111, 223–228 CrossRef CAS.
- M. A. Lillo-Ródenas, D. Cazorla-Amorós and A. Linares-Solano, Carbon, 2005, 43, 1758–1767 CrossRef.
- J. Hara, Chemosphere, 2017, 189, 382–389 CrossRef CAS.
- G. Liu, H. Huang, R. Xie, Q. Feng, R. Fang, Y. Shu, Y. Zhan, X. Ye and C. Zhong, RSC Adv., 2017, 7, 71–76 RSC.
- J. Coates, Encycl. Anal. Chem., 2006, vol. 1–23 Search PubMed.
- J. Yuan, Y. Huang, Z. Nie and R. Hofmann, Water Res., 2020, 183, 116065 CrossRef CAS.
- L. Li, S. Liu and J. Liu, J. Hazard. Mater., 2011, 192, 683–690 CrossRef CAS.
- A. Danon, P. C. Stair and E. Weitz, J. Phys. Chem. C, 2011, 115, 11540–11549 CrossRef CAS.
- K. L. Kauffman, J. T. Culp, A. Goodman and C. Matranga, J. Phys. Chem. C, 2011, 115, 1857–1866 CrossRef CAS.
- V. M. Rakić, R. V. Hercigonja and V. T. Dondur, Microporous Mesoporous Mater., 1999, 27, 27–39 CrossRef.
- I. A. W. Tan, M. O. Abdullah, L. L. P. Lim and T. H. C. Yeo, J. Appl. Sci. Process Eng., 2017, 4, 186–194 CrossRef CAS.
- S. M. Yakout and G. Sharaf El-Deen, Arabian J. Chem., 2016, 9, S1155–S1162 CrossRef CAS.
- U. Tocoglu, M. Alaf, O. Cevher, M. O. Guler and H. Akbulut, J. Nanosci. Nanotechnol., 2012, 12, 9169–9174 CrossRef CAS.
- G. M. Burke, D. E. Wurster, M. J. Berg, P. Veng-Pedersen and D. D. Schottelius, Pharmaceut. Res., 1992, 9, 126–130 CrossRef CAS.
- Y. C. Chiang, Y. J. Chen and C. Y. Wu, Materials, 2017, 10, 1296 CrossRef.
- C. S. Castro, M. C. Guerreiro, L. C. A. Oliveira, M. Gonçalves, A. S. Anastácio and M. Nazzarro, Appl. Catal., A, 2009, 367, 53–58 CrossRef CAS.
- A. Fischbacher, C. von Sonntag and T. C. Schmidt, Chemosphere, 2017, 182, 738–744 CrossRef CAS.
- A. Georgi and F. D. Kopinke, Appl. Catal., B, 2005, 58, 9–18 CrossRef CAS.
- A. Rey, J. A. Zazo, J. A. Casas, A. Bahamonde and J. J. Rodriguez, Appl. Catal., A, 2011, 402, 146–155 CrossRef CAS.
- L. B. Khalil, B. S. Girgis and T. A. M. Tawfik, J. Chem. Technol. Biotechnol., 2001, 76, 1132–1140 CrossRef CAS.
- E. E. Ebrahiem, M. N. Al-Maghrabi and A. R. Mobarki, Arabian J. Chem., 2017, 10, S1674–S1679 CrossRef CAS.
- P. Le Cloirec and C. Faur, Interface Sci. Technol., 2006, 7, 375–419 Search PubMed.
- K. C. Hou and H. B. Palmer, J. Phys. Chem., 1965, 69, 858–862 CrossRef CAS.
- W. K. Pui, R. Yusoff and M. K. Aroua, Rev. Chem. Eng., 2019, 35, 649–668 CAS.
- M. R. Hoffmann, S. T. Martin, W. Choi and D. W. Bahnemann, Chem. Rev., 1995, 95, 69–96 CrossRef CAS.
- Y. Luo and D. F. Ollis, J. Catal., 1996, 163, 1–11 CrossRef CAS.
|
| This journal is © The Royal Society of Chemistry 2020 |
Click here to see how this site uses Cookies. View our privacy policy here. 
 Open Access Article
 This Open Access Article is licensed under a Creative Commons Attribution-Non Commercial 3.0 Unported Licence
 *b
*b