 Open Access Article
Rib shaped carbon catalyst derived from Zea mays L. cob for ketalization of glycerol†
Jaspreet Kaur a,
Anil Kumar Sarma
 *b,
Mithilesh Kumar Jhaa and
Poonam Gerab
aDepartment of Chemical Engineering, Dr B R Ambedkar NIT Jalandhar, Punjab, India
bSardar Swaran Singh National Institute of Bio Energy Kapurthala, Punjab, India. E-mail: anil.sarma16@gov.in; Tel: +911822507414
First published on 7th December 2020
Abstract
In the present work, the activated carbon was prepared from agricultural waste by an activation method using sodium hydroxide as an activating agent. The prepared AC-CC has been characterized by N2 adsorption–desorption isotherms, thermogravimetric analysis (TGA-DTA), Fourier transform infrared spectroscopy (FTIR), scanning electron microscopy (SEM), X-ray diffraction (XRD), X-ray photoelectron spectroscopy (XPS), and temperature-programmed desorption (TPD). The porous carbon was thus obtained with a specific surface area of 13.901 m2 g−1 and a total pore volume of 0.011 cm3 g−1. The catalytic activity of the activated carbon has been studied for the ketalization of glycerol and provides maximum glycerol conversion of 72.12% under optimum conditions. The activity of the AC-CC also did not change appreciably for three consecutive batch reaction sequences. The spent catalyst was further analysed for elemental composition using XPS and surface morphology was studied using SEM. There was little deformation in the structure although the percentage of carbon remains almost same (∼72%) as that of the original catalyst, which contributes to the reduction of conversion efficiency of glycerol to solketal by 5% in the 3rd consecutive reaction. Thus, AC-CC obtained from Zea mays L. cob could be a very promising renewable catalyst for glycerol conversion into solketal as a fuel-additive.
Introduction
Increasing unreliability of liquid fuel production and supply, detrimental environmental issues, high petroleum prices, and increased consumption necessitate the search for an alternative liquid fuel rather than diesel.1 Biodiesel is one such potential biofuel derived from renewable triglycerides.2 Biodiesel is a technically advantageous fuel as compared to the conventional diesel fuel as it is safer to use, gives better performance, is non-toxic, and lowers the negative impact on the environment due to its renewable and biodegradable nature. Commercially, biodiesel is produced from the transesterification reaction between triglyceride and an alcohol, generally methanol, sometimes ethanol, in the presence of acidic or basic catalysts, which gives biodiesel and glycerol as co-product.3Glycerol is the main by-product obtained from the biodiesel industry, though it can be produced from saponification and hydrolysis. As the growth of the biodiesel industry increases with the increasing demand for transportation fuels, so the amount of glycerol increases rapidly.4 The global production of glycerol is expected to reach 5.2 million tons by 2020.5 Thus, this abundance of glycerol needs to be treated in order to improve the economic viability of the biodiesel industry. Hence, today researchers focus is on developing techniques for converting glycerol into numerous useful products to deal with the oversupply of glycerol. Although various techniques have been effectively developed for glycerol transformation, still research is ongoing for the development of new innovative processes or pathways for the conversion of glycerol to value-added products. Various processes for the transformation of glycerol into valuable products reported to date are reforming, cyclization, dehydration, esterification, etherification, oligomerization, hydrogenolysis, biochemical conversion etc.6 These processes for the conversion of glycerol involve various catalysts which may be alkaline, acidic, or enzymatic. The conversion of glycerol depends upon the availability of the raw material for the preparation, cost-effectiveness, and activity of the catalyst.7 The choice in the selection of the catalyst for a process to convert glycerol is of great importance as it affects the conversion of glycerol and selectivity of product.8 The progress of each process depends upon the nature of the catalyst, i.e. whether it is acidic/basic or homogeneous/heterogeneous. Heterogeneous catalysts have been proved to have good catalytic activity and their separation is cost-effective and easy. Agricultural waste-derived catalysts seem to be a promising option for research and developing new catalytic conversion routes. These are more effective as compared to other catalysts because of their surface area, pore-volume, and acid density.1
Zea mays L. (corn or maize) an annual grass of the Maydeae family of the genesis Gramineae, is a common agro-waste produced in Punjab, India. In Punjab, the total production of corn is 450![[thin space (1/6-em)]](https://www.rsc.org/images/entities/char_2009.gif) 000 tonnes (3835 kg per hectare) in 116, 000 hectare area till 2017. This production reaches to 3697 kg per hectare in 165
000 tonnes (3835 kg per hectare) in 116, 000 hectare area till 2017. This production reaches to 3697 kg per hectare in 165![[thin space (1/6-em)]](https://www.rsc.org/images/entities/char_2009.gif) 000 hectares by 2018. About 0.15–0.18 kg of cob is produced as waste from per kg of corn. This implies that 554–665 kg per hectare of (Zea mays L. cob) corn cob was produced as waste in Punjab till 2018. The worldwide potential of Zea mays L cob (corncob) is ∼150MMT per annum is huge although very insignificant contribution as a direct fuel source.9,10 Thus, preparing a renewable catalyst from corn cob provides a green opportunity for researchers in the research field. The ketalisation reaction is a reversible reaction and exothermic in nature.11 Water is also produced during the reaction process, which is a hinderance to the glycerol conversion. Removing water from the reaction mixture is a tedious and expensive process, and hence the main focused was on the development of hydrophobic acid catalysts such as zirconium organophosphonate12 or porous activated carbon.
000 hectares by 2018. About 0.15–0.18 kg of cob is produced as waste from per kg of corn. This implies that 554–665 kg per hectare of (Zea mays L. cob) corn cob was produced as waste in Punjab till 2018. The worldwide potential of Zea mays L cob (corncob) is ∼150MMT per annum is huge although very insignificant contribution as a direct fuel source.9,10 Thus, preparing a renewable catalyst from corn cob provides a green opportunity for researchers in the research field. The ketalisation reaction is a reversible reaction and exothermic in nature.11 Water is also produced during the reaction process, which is a hinderance to the glycerol conversion. Removing water from the reaction mixture is a tedious and expensive process, and hence the main focused was on the development of hydrophobic acid catalysts such as zirconium organophosphonate12 or porous activated carbon.
In the present study, the main focus is on the development of a catalyst using corn cob for effective biomass utilization and providing a cleaner pathway for the production of solketal from glycerol via ketalization reaction. The ketalization is the reaction of the glycerol with acetone in the presence of acid agents as catalysts for the formation of two ketal species, a five-membered ring and another six-membered ring,5 both these are extensively used as cetane improver and diesel additives.13 This is the first-ever report of complete structural characterization of a corncob based activated carbon and to study its effectiveness for solketal production.
Materials and methods
The catalyst
Catalyst is prepared using agro-waste, i.e. corn cob. The corn cob used for the preparation of the catalyst was collected from the local mandi of the Kapurthala, Punjab, India. The final product is stored in an airtight bottle which is our required activated carbon catalyst prepared using corn cob for the glycerol conversion and is labelled as AC-CC. Details crucible used for preparation of AC-CC and process have been elucidated in ESI Experimental Section-Ia.†The reaction
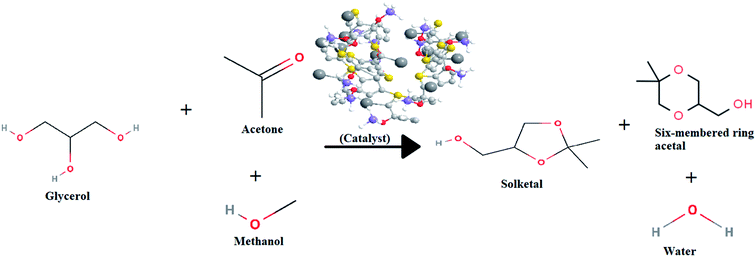
Glycerol (Sigma Aldrich – 99% purity), Methanol (Sigma aldirch – 99.5% purity), Acetone (Sigma Aldrich – 99.5% purity) is used as available commercially procured from the Merck Specialists Limited, Mumbai in the chemical conversion division of Sardar Swaran Singh National Institute of Bio-energy, Kapurthala, India. The schematic representation of the glycerol conversion reaction is shown in the Fig. 1.The reaction procedure in detail has been presented in the ESI Experimental Section Ib.†
Catalyst characterisation
To know about the structural properties of the AC-CC, it was characterized using various techniques such as Fourier Transform Infrared Spectroscopy (FTIR), thermogravimetric analysis (TGA), X-ray diffraction (XRD), surface area analysis (BET), X-ray photoelectron spectroscopy (XPS), field emission scanning electron microscope (FESEM), temperature programmed desorption (TPD).FTIR experiments were conducted to know about the presence of functional groups. They were interpreted using a PE IR SUBTECH SPECTRUM ASCII PEDS 4.00 infrared spectrometer with a resolution of 1 cm−1. The materials were mixed with KBr powder and scanned in a range from 4000 cm−1 to 400 cm−1 in the form of the pellet.
The Thermal analysis of the carbonisation behavior of the AC-CC was performed by a simultaneous TG/DTA i.e. DTA with the proven capabilities of the TG measurement capabilities, providing thermal property information for a variety of samples. This was done using a SII 6300 EXSTAR thermal analyzer. Samples were heated in the temperature range from 35 °C to 900 °C at a heating rate of 5 °C per minute in the air.
Nitrogen adsorption–desorption measurement was carried out using a BET surface area analyzer by St 2 on the NOVA touch 2LX instrument. The samples were degassed for 3 hours at 180 °C on the degassing port. The linear part of the BET equation was used for determination of the specific surface area.
The wide-angle X-ray diffraction pattern of the AC-CC was observed on Bruker XRD diffractometer using Cu-Kα radiation with wavelength of 1.54 and F as a filter. The scanning angle (2θ) range was kept from 10° to 80°.
Scanning electron micrographs (SEM) and elemental analysis of the activated carbon was performed using Nova Nano FE-SEM 450 (FEI) coupled with EDX analyzer provides an ultra high resolution characterization with an accelerating voltage of 15.0 kV.
Transmission Electron Microscopy (HRTEM) study was done with a TEM TECNAI G2 20 S-TWIN (FEI) electron microscope. A drop of the powdered sample is dispersed into ethanol and then dropped onto carbon-coated copper grid. The high resolution of the analyzer is provided with voltage of 200 kV.
The presence of surface groups such as Carbon, Sulphur, Oxygen, Silicon, Sodium were identified and confirmed by X-ray photoelectron spectroscopy (XPS) using PHI 5000 VersaProbe III model.
The acidity of the catalyst surfaces was studied using Temperature program desorption (TPD) and performed using BEL's new fully-automated catalyst analyzer (BELCAT II) with NH3 as investigating molecule and He as a carrier gas. The desorption of NH3 was performed after flushing using carrier gas up to temperature 450 °C at a heating rate of 10 °C min−1.
Results and discussions
The probable structure of the catalyst unit has been drawn using the ChemDraw software from the composition obtained from SEM-EDX analysis. The Unit structure is shown in Fig. 2(a) while the agglomerated structure of the catalyst is shown in Fig. 2(b).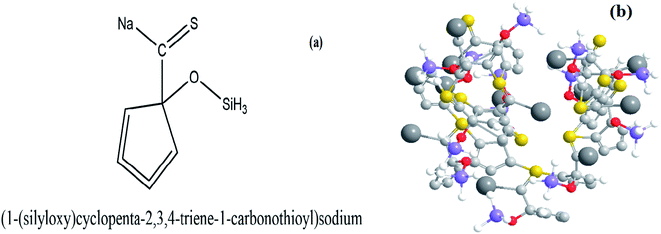 | ||
| Fig. 2 (a) Probable structure of a single molecule of the AC-CC produced and (b) 3-D view of the agglomerated structure of AC-CC. | ||
Features of the catalyst
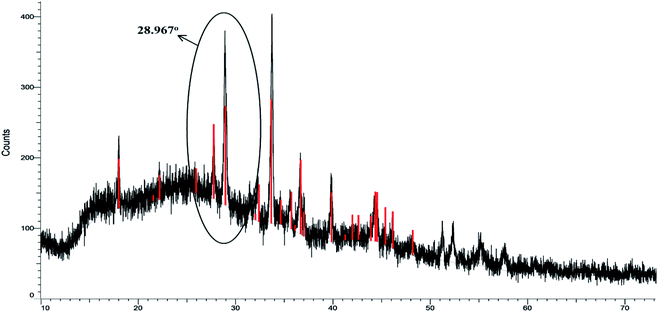
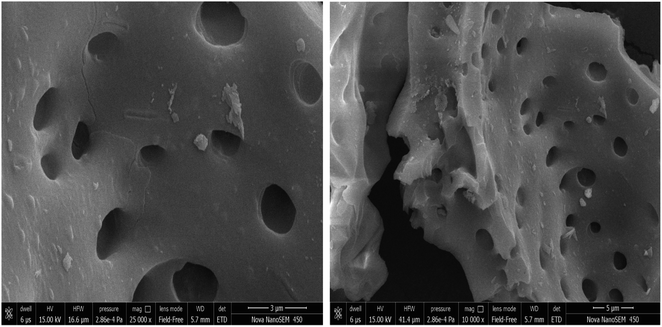
The surface groups in the AC-CC produced were characterized and identified using different techniques before using it for the ketalization reaction. The XRD patterns of the AC-CC demonstrate the mixed nature of the activated carbon as shown in Fig. 3. The sample showed the broad bands (2θ) between 20–30° and 40–50° corresponding to mixed nature carbon (amorphous and crystalline), which is useful for catalytic reaction.14 The peak (2θ) at 28.9° shows the amorphous nature of the AC-CC.The Scanning electron micrographs of the AC-CC derived from corn cob are as shown in Fig. 4. It can be observed from the pictures that a rib shaped structure of the activated carbon is developed having a smooth surface, random pore size distribution, and a highly porous surface. Microstructural evaluation and elemental composition were analysed using scanning electron microscopy and energy-dispersive analysis (SEM-EDX). Elemental analysis of the sample showed the presence of carbon, oxygen, sodium, sulfur, and silicon. Carbon is present in the highest amount displaying carbonization of the sample15 (Table 1). The presence of sodium is due to the activation of the carbonized material with NaOH.
| Elemental analysis of the activated carbon | ||||
|---|---|---|---|---|
| Wt% of the elements | ||||
| C | O | Na | S | Si |
| 78.51 | 15.01 | 5.80 | 0.44 | 0.24 |
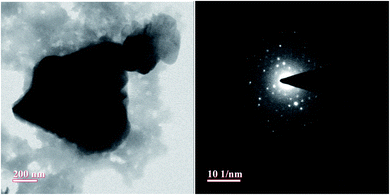
TEM analysis was also performed and TEM micrographs are as shown in Fig. 5. The images revealed a complete porous carbon structure even at higher magnification. The existence of the pores structure of the catalyst is assigned to the NaOH activation adopted during the synthesis of the AC-CC catalyst.16,17 The sizes and uniformity envisage that the glycerol molecule with a size of 0.5–0.6 nm, that can easily fit and escape from these pores which facilitates the group transfer and cyclization reactions.
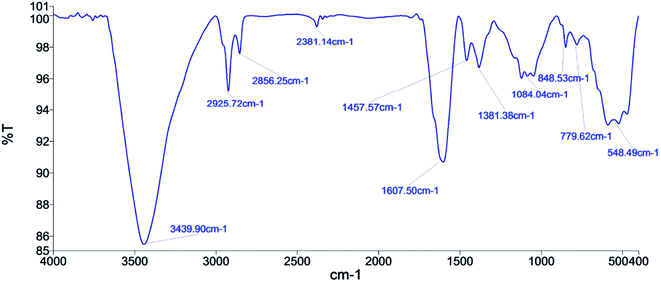
FT-IR experiments were conducted on the activated carbon that shows a broad peak at 3439.90 cm−1 for stretching of –OH bond of alcohol18 (Fig. 6). The 2925.72 cm−1 peak shows the aliphatic C–H stretching vibration.19 The peak at 2856.25 cm−1 shows the vibration of the –OH group attached to ring carbon. There is a broad peak at 1607.50 cm−1, which shows the stretching of the C![[double bond, length as m-dash]](https://www.rsc.org/images/entities/char_e001.gif) C due to the influenced functionalities. The peaks at 1457.57 cm−1, 1381.38 cm−1, and 1084.04 cm−1 shows the C–C stretching vibration of the chain hydrocarbon parts due to different structural influences, C–H stretching vibration in alkanes or an alkyl group and C–S group, respectively. The peak at 779.62 cm−1 shows the absorption of the SiO2. 548 cm−1 peak shows the C–H stretching of aromatic compounds.20 The functional groups represent the chemically active components of the catalyst that accelerates the rate of the reaction.
C due to the influenced functionalities. The peaks at 1457.57 cm−1, 1381.38 cm−1, and 1084.04 cm−1 shows the C–C stretching vibration of the chain hydrocarbon parts due to different structural influences, C–H stretching vibration in alkanes or an alkyl group and C–S group, respectively. The peak at 779.62 cm−1 shows the absorption of the SiO2. 548 cm−1 peak shows the C–H stretching of aromatic compounds.20 The functional groups represent the chemically active components of the catalyst that accelerates the rate of the reaction.
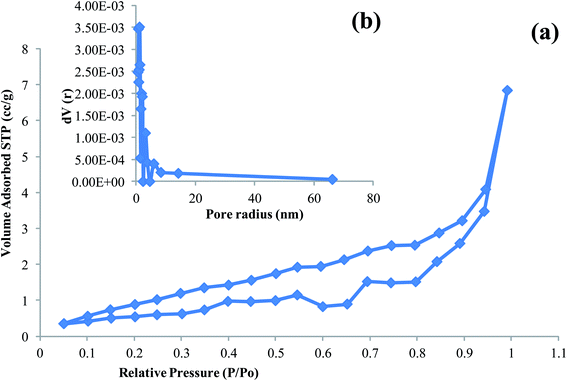
The values of specific surface area calculated using the BET equation are presented in Table 2 together with the values of the total pore volume, Vp, taken at P/Po = 0.9916, and average pore radius pore size distribution curves for AC-CC as have been obtained from BJH calculation method.21 The adsorption–desorption isotherms of the AC-CC derived from corn cob can be classified as type IV according to IUPAC classification (Fig. 7). The isotherms exhibit hysteresis loop of Type I, reveals that the initial loop indicating the monolayer adsorption and the second loop shows the desorption. The isotherm shows the transition of micropores to mesopores after the activation of the carbon.
| Activated carbon source | Specific surface area – ABET (m2 g−1) | Pore volume – Vp (cm3 g−1) | Pore radius – r (nm) |
|---|---|---|---|
| Corn cob | 13.901 | 0.011 | 1.223 |
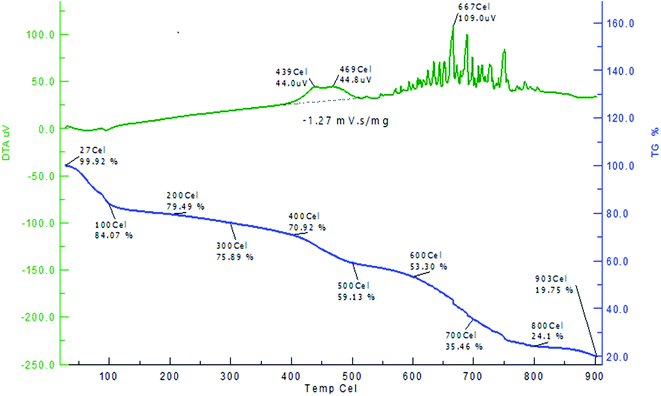
The thermal behaviour of the AC-CC (TG and DTA) was observed in the temperature range of 35 °C to 900 °C. TG and DTA curves show the weight loss from 27–930 °C as shown in Fig. 8. The weight loss at the initial stage up to 100 °C shows the removal of moisture. Volatilization occurs at about 150 °C. The produced carbon is stable between 200 to 600 °C which is also known as the carbonization zone. The weight loss at 600–700 °C shows the decomposition of the produced carbon and the weight loss at 800–900 °C shows the decomposition of the organic components present in the AC-CC. After 600 °C, the fusion of the carbon occurs till 800 °C and 800–900 °C is the ash fusion temperature.
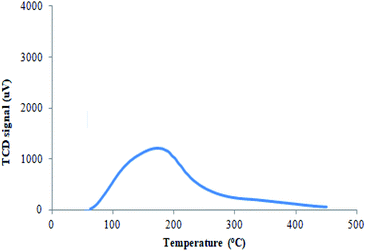
In the present work, acidic sites of the catalyst were determined by NH3-TPD as these are the active sites responsible for the conversion of glycerol to solketal at modest temperature.22 The NH3-TPD was carried out in the temperature range of 50–450 °C. The catalyst has acidic sites of weak strength with a desorption peak of NH3 at 171.5 °C. The total acidic amount of 0.442 mmol g−1 was observed for the acidic site of the prepared catalyst (Fig. 9).
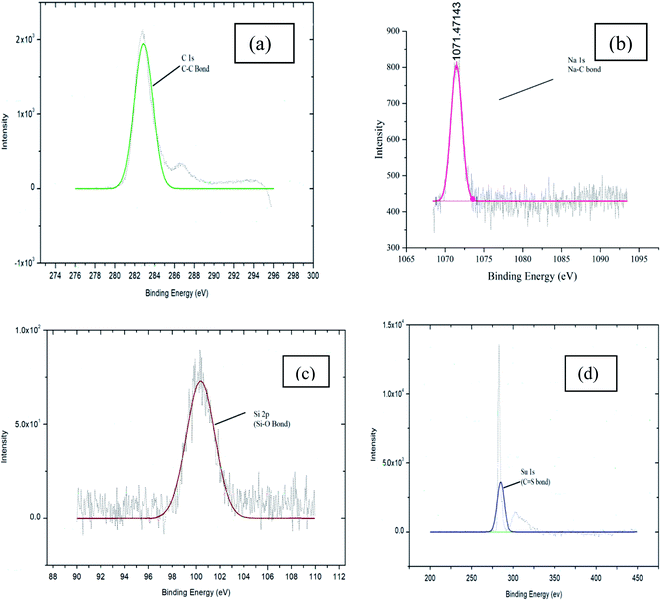
The surface chemistry has been studied by using XPS and concluded the presence of groups attached in the catalyst structure23 i.e. sulfur, sodium, silicon, carbon, and oxygen (Fig. 10). The XPS results are also in agreement with the FTIR data and the structure of the AC-CC is confirmed (Table 3).
| Group | Carbon (C) | Oxygen (O) | Sodium (Na) | Silicon (Si) | Sulphur (S) |
|---|---|---|---|---|---|
| Weight (%) | 72.11 | 23.40 | 4.23 | 2.26 | 0.03 |
Activity and reusability of the catalyst
The catalytic activity was studied for the ketalisation reaction i.e. conversion of glycerol to solketal using AC-CC obtained from corn cob. Under optimum conditions i.e. molar ratio of 1![[thin space (1/6-em)]](https://www.rsc.org/images/entities/char_2009.gif) :
:![[thin space (1/6-em)]](https://www.rsc.org/images/entities/char_2009.gif) 8
8![[thin space (1/6-em)]](https://www.rsc.org/images/entities/char_2009.gif) :
:![[thin space (1/6-em)]](https://www.rsc.org/images/entities/char_2009.gif) 8 (glycerol
8 (glycerol![[thin space (1/6-em)]](https://www.rsc.org/images/entities/char_2009.gif) :
:![[thin space (1/6-em)]](https://www.rsc.org/images/entities/char_2009.gif) acetone
acetone![[thin space (1/6-em)]](https://www.rsc.org/images/entities/char_2009.gif) :
:![[thin space (1/6-em)]](https://www.rsc.org/images/entities/char_2009.gif) methanol), time – 1 hour, temperature – 50 °C, catalyst amount – 5 wt% (w.r.t. glycerol), the reaction catalyzed by the AC-CC resulted in maximum glycerol conversion of 72.12% (ESI Section-2†). Glycerol and acetone are the reactants for the reaction while methanol is used as a solvent. Methanol is used in excess so as to enhance the conversion of glycerol into solketal because using methanol does not have any significant effect on the reaction kinetics.24
methanol), time – 1 hour, temperature – 50 °C, catalyst amount – 5 wt% (w.r.t. glycerol), the reaction catalyzed by the AC-CC resulted in maximum glycerol conversion of 72.12% (ESI Section-2†). Glycerol and acetone are the reactants for the reaction while methanol is used as a solvent. Methanol is used in excess so as to enhance the conversion of glycerol into solketal because using methanol does not have any significant effect on the reaction kinetics.24
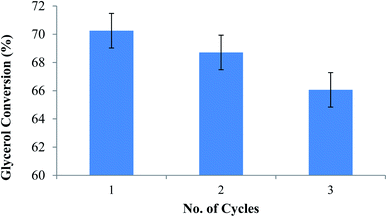
In order to check the stability of the catalyst and effectiveness of the active sites of the catalyst, a reusability study was carried out. The catalyst was separated from the reaction mixture after the completion of the reaction by filtering the reaction mixture using filter paper. It was then washed with ethanol 3–4 times and then dried in an oven at a temperature of 90 °C. The study showed that the catalyst can be reused up to 3 times without much loss of the activity (<5%) (Fig. 11).
The spent catalyst was further studied for surface morphology and surface chemistry after the 3rd consecutive batch reaction to spell out the reasons for the deactivation of the catalyst.
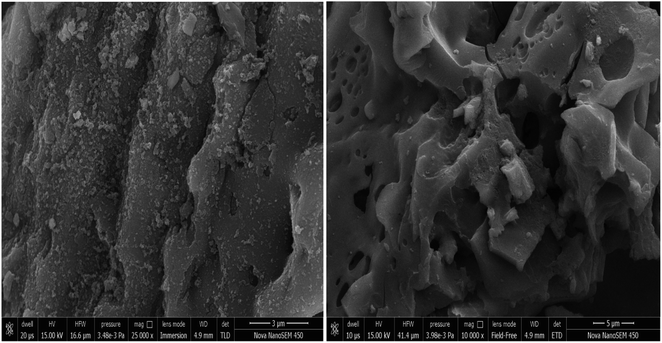
The SEM images of the spent catalyst are shown in Fig. 12. It can be observed from the pictures that some pores get clogged which is not due to the any reactant or product deposition. The structures of the spent catalyst were partially deformed due to the mechanical effects of stirring of the reaction mixture during the course of reaction. Thus, the activity of the spent catalyst gets reduced by a maximum of 5% only. Microstructural evaluation and elemental composition were also analysed using SEM and SEM-EDX. Elemental analysis of the sample showed the presence of carbon, oxygen, sodium identical to the original sample.
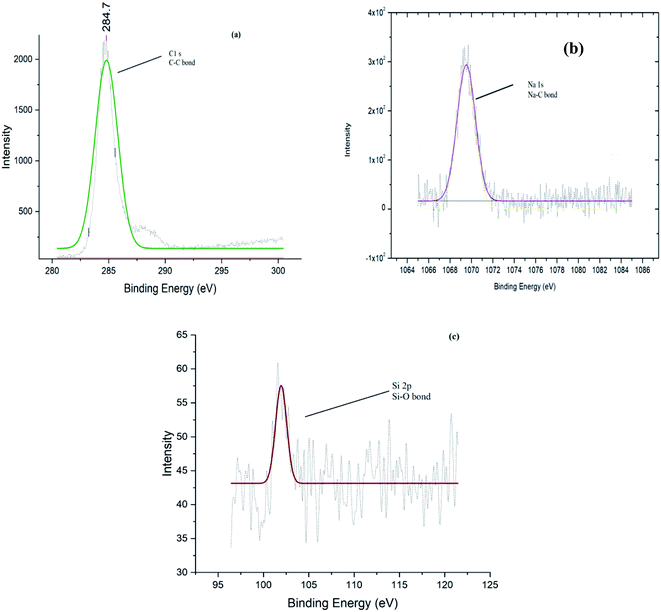
The XPS was performed to identify the surface chemistry of the groups attached in the structure of the spent catalyst. The peaks observed from the XPS showed the presence of carbon, sodium, silicon and oxygen in the catalyst. Carbon content is almost similar amount to the fresh catalyst showing peaks of same intensity, hence there is not much difference between the activity of fresh and spent catalyst. The presence of sodium, silicon and oxygen in lesser amount are as shown in Table 4 with reduced intensity of the peaks as shown in the Fig. 13(a, b and c). This may be due to the deactivation of few of the active sites in the spent catalyst and deformation effect of stirring.
| Group | Carbon (C) | Oxygen (O) | Sodium (Na) | Silicon (Si) | Sulphur (S) |
|---|---|---|---|---|---|
| Weight (%) | 72.83 | 22.32 | 2.20 | 0.52 | 0.10 |
Conclusions
Value-added activated carbon can be produced from Zea mays L. cob by activation method using NaOH as an activating agent. The catalytic activity is promising as ∼72% conversion with reusability without substantial loss of the activity for three subsequent reactions that vitalizes the rib-shaped corn cob-based AC-CC for its uniqueness. After completion of the process optimization, we are hopeful to deliver a cost-effective product and process for ketalization of crude glycerol obtained from the biodiesel Industry.Conflicts of interest
There are no conflicts of interest to declare.Acknowledgements
The research was supported by the National Institute of Technology, Jalandhar funded by MHRD (Ministry of Human Resource Development), India. The first author acknowledges SSS-NIBE, Kapurthala for their infrastructural and analytical support for carrying out this work.References
- C. Carraretto, A. Macor, A. Mirandola, A. Stoppato and S. Tonon, Energy, 2004, 29, 2195–2211 CrossRef CAS.
- E. M. Sánchez Faba, G. O. Ferrero, J. M. Dias and G. A. Eimer, Catalysts, 2019, 9, 1–14 CrossRef.
- J. Kaur, A. K. Sarma, M. K. Jha and P. Gera, Biotechnology Reports, 2020, 27, e00487 CrossRef.
- C. A. G. Quispe, C. J. R. Coronado and J. A. Carvalho, Renewable Sustainable Energy Rev., 2013, 27, 475–493 CrossRef CAS.
- M. N. Moreira, R. P. V. Faria, A. M. Ribeiro and A. E. Rodrigues, Ind. Eng. Chem. Res., 2019, 58, 17746–17759 CrossRef CAS.
- C. Len and R. Luque, Sustainable Chem. Processes, 2014, 2, 1–10 CrossRef.
- O. Muraza, Front. Chem., 2019, 7, 1–11 CrossRef.
- M. K. Aroua and P. Cognet, Front. Chem., 2020, 8, 1–2 CrossRef.
- Y. Zhang, A. E. Ghaly and B. Li, Am. J. Biochem. Biotechnol., 2012, 8, 10 Search PubMed.
- M. Kapoor, D. Panwar and G. S. Kaira, Bioprocesses for Enzyme Production Using Agro-Industrial Wastes: Technical Challenges and Commercialization Potential, Elsevier Inc., 2016 Search PubMed.
- X. Li, Y. Jiang, R. Zhou and Z. Hou, Appl. Clay Sci., 2019, 174, 120–126 CrossRef CAS.
- X. Li, Y. Jiang, R. Zhou and Z. Hou, Appl. Clay Sci., 2020, 189, 105555 CrossRef CAS.
- D. Royon, S. Locatelli and E. E. Gonzo, J. Supercrit. Fluids, 2011, 58, 88–92 CrossRef CAS.
- R. A. Arancon, H. R. Barros, A. M. Balu, C. Vargas and R. Luque, Green Chem., 2011, 13, 3162–3167 RSC.
- O. Solomon, B. Emmanuel, S. Owojuyigbe, M. Abiodun, B. Folasayo and E. Folaranmi, Appl. Water Sci., 2017, 7, 3561–3571 CrossRef.
- D. Momodu, M. Madito, F. Barzegar, A. Bello, A. Khaleed, O. Olaniyan, J. Dangbegnon and N. Manyala, J. Solid State Electrochem., 2017, 21, 859–872 CrossRef CAS.
- P. Kumar, M. Aslam, N. Singh, S. Mittal, A. Bansal, M. K. Jha and A. K. Sarma, RSC Adv., 2015, 5, 9946–9954 RSC.
- Z. Liu, Y. Sun, X. Xu, X. Meng, J. Qu, Z. Wang, C. Liu and B. Qu, Bioresour. Technol., 2020, 306, 123154 CrossRef CAS.
- A. I. Anukam, B. P. Goso, O. O. Okoh and S. N. Mamphweli, J. Chem., 2017, 6478389 Search PubMed.
- W. T. Tsai, C. Y. Chang, S. Y. Wang and C. F. Chang, Resour., Conserv. Recycl., 2001, 32, 43–53 CrossRef.
- J. Bedia, M. Peñas-Garzón, A. Gómez-Avilés, J. Rodriguez and C. Belver, Carbon, 2018, 4, 63 CAS.
- M. Zbair, S. Ojala, H. Khallok, K. Ainassaari, Z. El Assal, Z. Hatim, R. L. Keiski, M. Bensitel and R. Brahmi, Environ. Sci. Pollut. Res., 2019, 26, 32589–32599 CrossRef CAS.
- R. Ruiz-Rosas, F. J. García-Mateos, M. del C. Gutiérrez, J. Rodríguez-Mirasol and T. Cordero, Front. Mater., 2019, 6, 1–14 CrossRef.
- M. N. Moreira, R. P. V. Faria, A. M. Ribeiro and A. E. Rodrigues, Ind. Eng. Chem. Res., 2019, 58, 17746–17759 CrossRef CAS.
Footnote |
| † Electronic supplementary information (ESI) available. See DOI: 10.1039/d0ra08203a |
| This journal is © The Royal Society of Chemistry 2020 |

