
 Open Access Article
 This Open Access Article is licensed under a Creative Commons Attribution-Non Commercial 3.0 Unported Licence
The effects of osmolytes on in vitro kinesin-microtubule motility assays†
Virginia VanDelinder,
Ian Sickafoose,
Zachary I. Imam,
Randy Ko and
George D. Bachand *
*
Center for Integrated Nanotechnologies, Sandia National Laboratories, Albuquerque, NM, USA. E-mail: gdbacha@sandia.gov
First published on 24th November 2020
Abstract
The gliding motility of microtubule filaments has been used to study the biophysical properties of kinesin motors, as well as being used in a variety of nanotechnological applications. While microtubules are generally stabilized in vitro with paclitaxel (Taxol®), osmolytes such as polyethylene glycol (PEG) and trimethylamine N-oxide (TMAO) are also able to inhibit depolymerization over extended periods of time. High concentrations of TMAO have also been reported to reversibly inhibit kinesin motility of paclitaxel-stabilized microtubules. Here, we examined the effects of the osmolytes PEG, TMAO, and glycerol on stabilizing microtubules during gliding motility on kinesin-coated substrates. As previously observed, microtubule depolymerization was inhibited in a concentration dependent manner by the addition of the different osmolytes. Kinesin-driven motility also exhibited concentration dependent effects with the addition of the osmolytes, specifically reducing the velocity, increasing rates of pinning, and altering trajectories of the microtubules. These data suggest that there is a delicate balance between the ability of osmolytes to stabilize microtubules without inhibiting motility. Overall, these findings provide a more comprehensive understanding of how osmolytes affect the dynamics of microtubules and kinesin motors, and their interactions in crowded environments.
Introduction
Microtubules are one of the three classes of cytoskeletal filaments in eukaryotic cells that play a critical role in metabolic processes and have been implicated in pathologies of cancer and neurodegenerative diseases.1,2 The dynamics (i.e., assembly and disassembly) of microtubules are strongly affected by the local environment around the filaments, such as the physiochemical nature of the solvent.3 For example, studies in yeast have shown that the addition of sorbitol has a striking effect on the dynamic instability of microtubules.4 Specifically, the depolymerization of the microtubules ceased upon addition of sorbitol and attributed to an increase in molecular crowding inside the cell following osmotic shrinkage. Normal microtubule dynamics were observed when sorbitol was washed out and cells returned to their original size. Crowding due to high concentrations of large macromolecules (e.g., polyethylene glycol (PEG), bovine serum albumin (BSA), trimethylamine N-oxide (TMAO), and Ficoll) have been also shown to increase the rate of tubulin polymerization.5–7 Similarly, the addition of macromolecules has been observed to induce bundling of both actin and microtubules filaments in vitro based on osmotic forces caused by the macromolecular crowding.8–11Macromolecular osmolytes has been shown to stabilize solutions of proteins by inhibiting unfolding and denaturation.12,13 We recently reported that the stabilization effect of macromolecular osmolytes extends to the stabilization of supramolecular biomacromolecules, specifically inhibiting the depolymerization microtubule filaments.14 Here, the addition of PEG or trimethylamine N-oxide (TMAO), in absence of other known stabilizers, inhibited the disassociation of tubulin dimers from the larger microtubule lattice, stabilizing microtubules for up to one month. This effect also included PEG stabilization of microtubules against both temperature- and calcium-induced depolymerization.14 In contrast, similar concentrations of glycerol displayed an intermediate stabilization effect on the order of several hours, with most microtubules completely depolymerized within 24 hours. The stabilization of the microtubules by PEG and TMAO was hypothesized to be related to changes in the hydration of the protein surface caused by the osmolytes and enhancement of the hydrogen bonding network (i.e., kosmotropic) in the surrounding water.14
In addition to providing structure and shape to cells, microtubules function as transportation highways on which associated motor proteins, kinesin and dynein, transport intracellular cargoes (e.g., organelles).15 These motors “walk” unidirectionally along microtubules, transporting cargo throughout the cell through the conversion of ATP into mechanical work. In vitro reconstitution of the kinesin-1 (KIF5B) and microtubule system has enabled study of the biophysical properties of motor-protein transport, as well as established a foundation platform for nanotechnology applications including energy-driven assembly, bioanalytical assays, and biocomputation.16–19 Microtubules in these systems are typically stabilized against spontaneous depolymerization using the anti-cancer drug paclitaxel (Taxol®), which consequently increases the stiffness of the filament and leads to straighter transport trajectories in gliding motility assays. While enhanced stability is desired for most in vitro experiments and applications, the rapid and efficient removal of stabilizing agents is necessary for experiments requiring native microtubule dynamics. This need further extends to approaches to regulate microtubule instability under conditions that more closely mimic the properties of the cytosol (i.e., highly crowded environment), as opposed to the addition and removal of paclitaxel to control dynamics.
Recently, Munmun et al. demonstrated that osmolytes can modulate the velocity of microtubule transport and regulate the interactions between microtubules and motors over a range of temperatures.20,21 In the case of TMAO, high concentrations of the osmolyte can serve as a motility switch, reversibly suppressing motility over multiple cycles.20 The microtubules used in these studies were stabilized with Taxol, and thus the changes in motility were not considered with respect to enhanced stabilization effect afforded by the osmolytes. To address this question, the goal of the present work was to investigate the coincident effects of osmolytes on the stabilization of microtubule dynamics and kinesin-driven transport of microtubules in the gliding motility system. Here, we show that, while increasing concentrations of osmolytes enhance microtubule stability, they also negatively impact the transport velocity as well as interactions with kinesin motors observed through changes in tip trajectories. Overall, these findings are consistent with those of Munmun et al.,20,21 but provide a more comprehensive understanding of how osmolytes affect the dynamics of microtubules, kinesin motors, and their interactions in crowded environments.
Results and discussion
In these experiments, all microtubules were polymerized and initially stabilized with paclitaxel (details in Experimental section). The microtubules were then introduced into kinesin-coated glass flow cells and allowed to adhere to the surface-bound kinesin. The flow cells were then washed with solution containing the different concentrations of osmolytes but no paclitaxel. This process flow allowed optimal diffusion (e.g., equivalent viscosities) and binding of microtubules to the surface before addition of osmolytes. The range of osmolyte concentrations selected was based on our previous experiments with using osmolytes to stabilize microtubules.14 We focused on three osmolytes, PEG (600 MW), glycerol, and TMAO and evaluated effects at concentration of 5, 10, 15, 20 and 25% (w/v). To ensure that the effects presented in this work were related to the osmolytes and not residual paclitaxel, control experiments with no paclitaxel and no osmolyte in the buffer were performed and are presented in the text and figures as “0%” osmolyte data points.The properties of kinesin-driven inverted motility of osmolyte-stabilized microtubules was characterized to assess whether the addition of osmolytes would affect the transport function of the motors. In these assays, microtubules were polymerized, stabilized with paclitaxel, and introduced into a kinesin-coated flow cell. The flow cell was then washed four-times with a motility buffer that included the different concentrations of osmolytes but did not contain paclitaxel. As such, motility of microtubules in the assays continued with the different osmolytes replacing paclitaxel as the stabilizing agent. Representative images of gliding microtubules in the presence of glycerol, PEG, and TMAO are shown in Fig. 1.
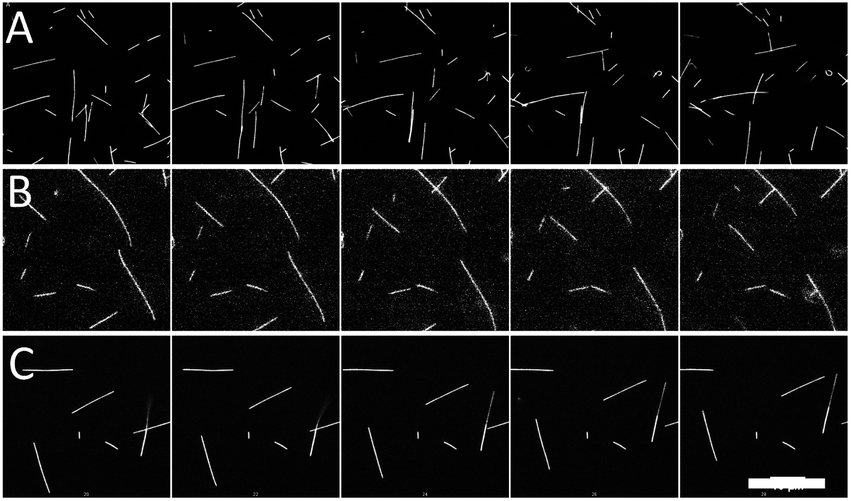 | ||
| Fig. 1 Representative images of microtubules moving in gliding motility assays with 20% (A) glycerol, (B) PEG, and (C) TMAO. Time between frames is 10 s. Scale bar is 20 μm. | ||
The depolymerization rates of the gliding microtubules were measured under varying osmolyte concentrations and are displayed in Fig. 2. Because the microtubules were actively moving, it was not possible to accurately measure the rates for the plus and minus ends in the presence of osmolytes. Therefore, depolymerization was measured by the change in total length of a microtubule over the observation time. The addition of osmolytes significantly reduced the depolymerization rate of microtubules in the absence other stabilizers such as paclitaxel (P < 0.001, ANOVA). Further, the decrease in depolymerization displayed an inverse, non-linear correlation with the concentration of added osmolyte (Fig. 2, ρ = −0.826, P < 0.001), consistent with our prior work.14 The depolymerization rates with the addition of PEG (Fig. 2) were also consistent with prior results in which microtubules were never exposed to paclitaxel.14 For example, the rate of depolymerization of gliding microtubules in the presence of 5 and 15% PEG in the present study was 22 and 1.6 nm s−1, respectively. In comparison, in our prior work,14 depolymerization rates of 12 and 1.3 nm s−1 were observed for immobilized microtubules in the presence of 5 and 15% PEG, respectively. These data support the conclusion that the stabilization effect was due to presence of the osmolytes and not residual paclitaxel. Overall, TMAO provided the best level of stabilization against depolymerization, effectively slowing shrinkage even at concentrations as low 5%. In contrast, equivalent stabilization with PEG was not observed until 15% concentration, and not observed until 25% glycerol.
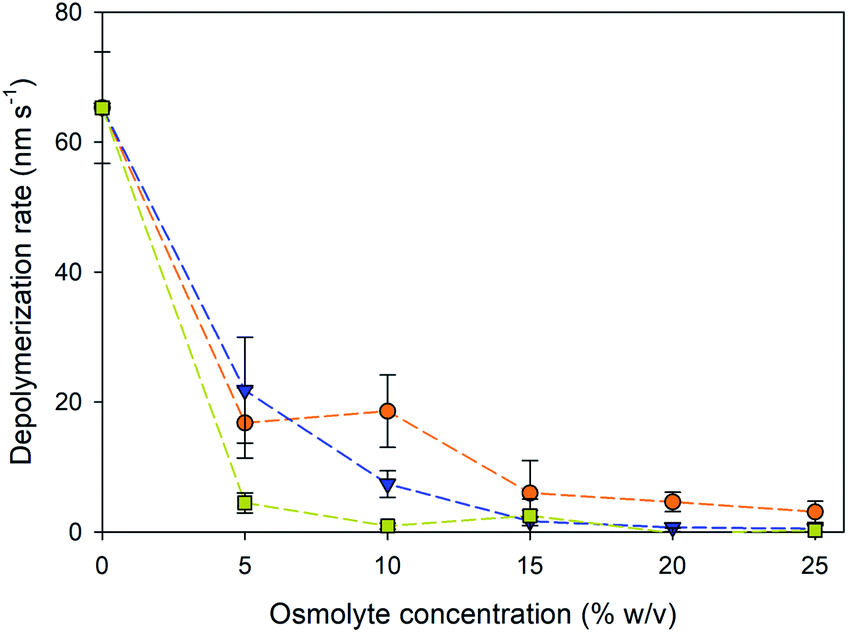 | ||
Fig. 2 Microtubule depolymerization rates in the presence at varying concentrations of glycerol ( ), PEG ( ), PEG ( ), and TMAO ( ), and TMAO ( ). Change in microtubule length over time, combining the change at both the + and − end of the microtubule. The average depolymerization of microtubules in the absence of osmolytes (grey line) was 65 ± 8 nm s−1. Error bars are standard deviation; N = 9–11 microtubules at each point. ). Change in microtubule length over time, combining the change at both the + and − end of the microtubule. The average depolymerization of microtubules in the absence of osmolytes (grey line) was 65 ± 8 nm s−1. Error bars are standard deviation; N = 9–11 microtubules at each point. | ||
The fraction of microtubules in the assays that were “pinned” (i.e., non-motile) depended on the osmolyte and concentration. Even in typical motility assays with paclitaxel-stabilized microtubules, a small fraction of microtubules is commonly pinned presumably due to inactive motors,22 consistent with observations in the current experiment. However, as evident in Fig. 3A, the fraction of pinned microtubules increased dramatically at higher osmolyte concentrations, particularly above 20%. For TMAO, these data correspond well with the reduced fraction of motile microtubules in the presence of 3 M TMAO (∼22.5% w/v) reported by Munmun et al.20 TMAO has been shown to activate some enzymes while inhibiting others.23 Thus, while TMAO promotes microtubule polymerization7 and inhibits depolymerization,14 our data here suggest that it may inhibit the function of the motor.
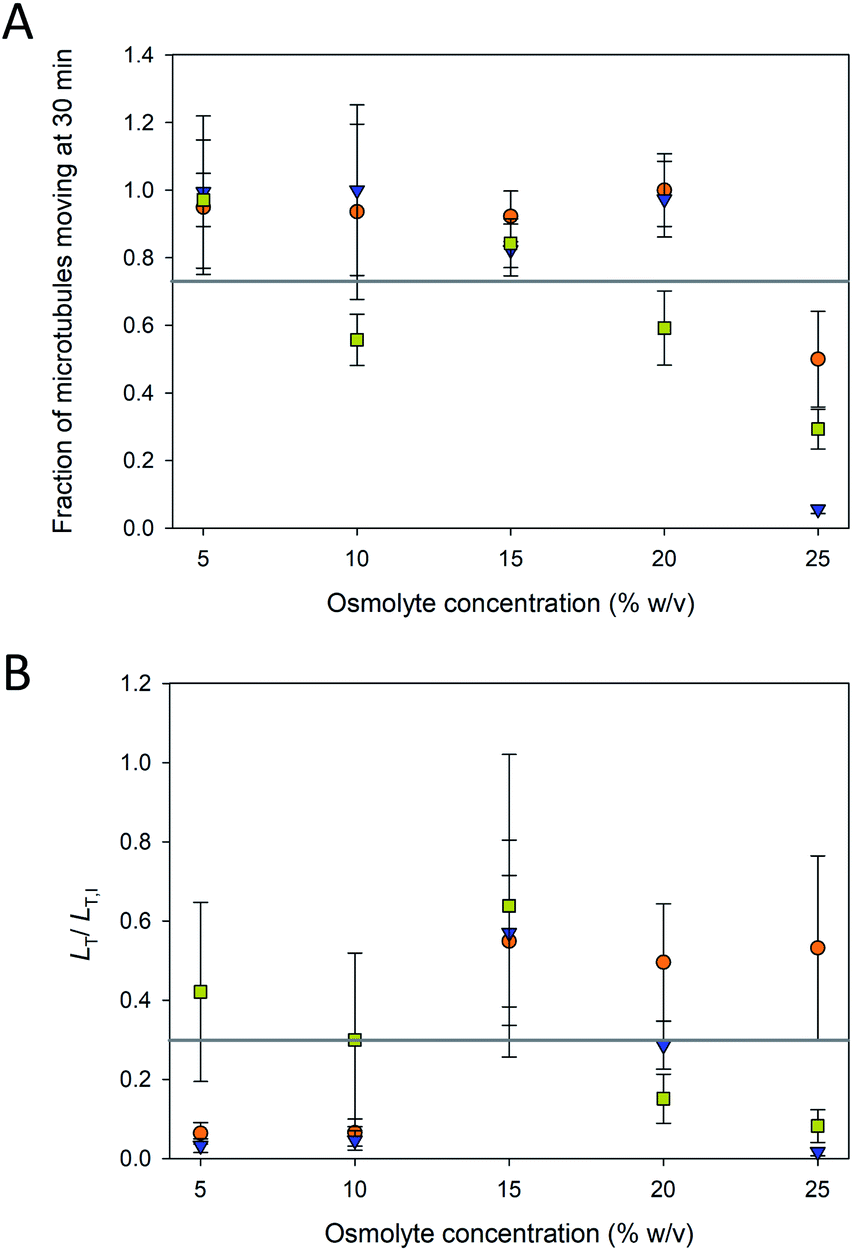 | ||
Fig. 3 (A) Fraction microtubules moving at various concentrations of glycerol ( ), PEG ( ), PEG ( ), and TMAO ( ), and TMAO ( ). The average fraction of microtubule moving across all conditions (grey line) was 0.76 ± 0.29. Error bars are standard deviations. (B) Length of microtubules/area moving (LT) after 30 min of motility normalized to the initial length (LT,I) for various osmolyte concentrations. The average LT/LT,I across all conditions (grey line) was 0.28 ± 0.23. Error bars are propagated errors. Note that values at 0% osmolytes are not shown in these plots as the microtubules in these assays had completely depolymerized after 30 min. ). The average fraction of microtubule moving across all conditions (grey line) was 0.76 ± 0.29. Error bars are standard deviations. (B) Length of microtubules/area moving (LT) after 30 min of motility normalized to the initial length (LT,I) for various osmolyte concentrations. The average LT/LT,I across all conditions (grey line) was 0.28 ± 0.23. Error bars are propagated errors. Note that values at 0% osmolytes are not shown in these plots as the microtubules in these assays had completely depolymerized after 30 min. | ||
To further assess the efficacy of the osmolyte-stabilization in motility assays, we examined the total length of microtubules, LT, per field of view, A, that were moving over time. Because the exact number and length distribution of microtubules varies among assays, the total length per field of view (LT/A) provided a more accurate measure of the functional parameters of the assay. LT was normalized to the initial total length, LT,I of microtubules present in each assay, such that the results of assays that had different lengths of microtubules present could be compared more expeditiously. LT/LT,I is shown in Fig. 3B for the three osmolytes at the various concentrations at 30 min. At low osmolytes concentrations (i.e., 5 and 10%), PEG and glycerol allowed for generally unaffected motility (Fig. 3A) did not provide sufficient stabilization and the microtubule lengths shorten and disintegrate over the course of the 30 min experiments (Fig. 2). At higher osmolyte concentrations, the microtubules were stabilized against depolymerization (Fig. 2), but LT/LT,I remained low (<60%; Fig. 3B) as the fraction of immobilized (pinned) microtubules increased substantially (Fig. 3A). In addition, the LT/LT,I at high osmolyte concentration also reflects increased detachment as previously noted by Munmun et al.21
Higher osmolyte concentrations also resulted in significant changes in gliding motility as observed in velocity (Fig. 4A) and trajectory analyses (Fig. 4B). Pinned microtubules were excluded from these analyses as they were accounted for in the prior analyses (Fig. 3A). The velocity of the control (i.e., no osmolyte present) was 0.34 ± 0.07 μm s−1. Addition of all three of the osmolytes caused significant decreases in the microtubule velocity (P < 0.001, ANOVA), and, in general, proportionally to the concentration of the osmolyte (Fig. 4A). Based on the velocities, neither PEG nor TMAO represent viable microtubule-stabilizing agents for in vitro assays at 25%. Decreased velocity coupled with the increased pinning at this concentration significantly limited gliding motility. This effect (i.e., inhibited motility) with TMAO, however, was shown to be fully reversible, serving as a means of starting and stopping motion in microtubule assays.20 Of the osmolytes studied here, glycerol had the least effect on the velocity, but also the least stabilizing effect against microtubule depolymerization (Fig. 2). Previous work has shown inhibition of microtubule depolymerization in the presences of 25–50% concentrations glycerol.14,24 Similarly, reductions in the heterogeneity and average velocity of kinesin motors was observed at 30–40% concentrations over glycerol,25,26 which is consistent with our observations. Collectively, the data suggest that there is significant trade-off between microtubule stability and gliding motility with respect to the various osmolytes. Specifically, the stabilizing effect of higher concentrations of PEG and TMAO is achievable at the expense of strongly inhibited motility. The decreased velocity at high osmolyte concentrations suggests that the osmolytes interferes with kinesin's mechanochemical cycle, which involves both the hydrolysis of ATP and associated conformational changes involved in motility.27 In work by Sozanski et al.,28 decreases in kinesin velocity were observed to correlate with increasing viscocity associated with the presence of molecular crowders. The observed changes were attributed to inhibited diffusive motion of the tethered motor domain, leading to a disruption in the normal mechanochemical cycle.28 This mechanism, however, likely does not apply to our observations as the osmolytes used are low molecular weight and have hydrodynamic radii (i.e., <1 nm) small enough that depletion and viscosity scaling effects become negligible.28
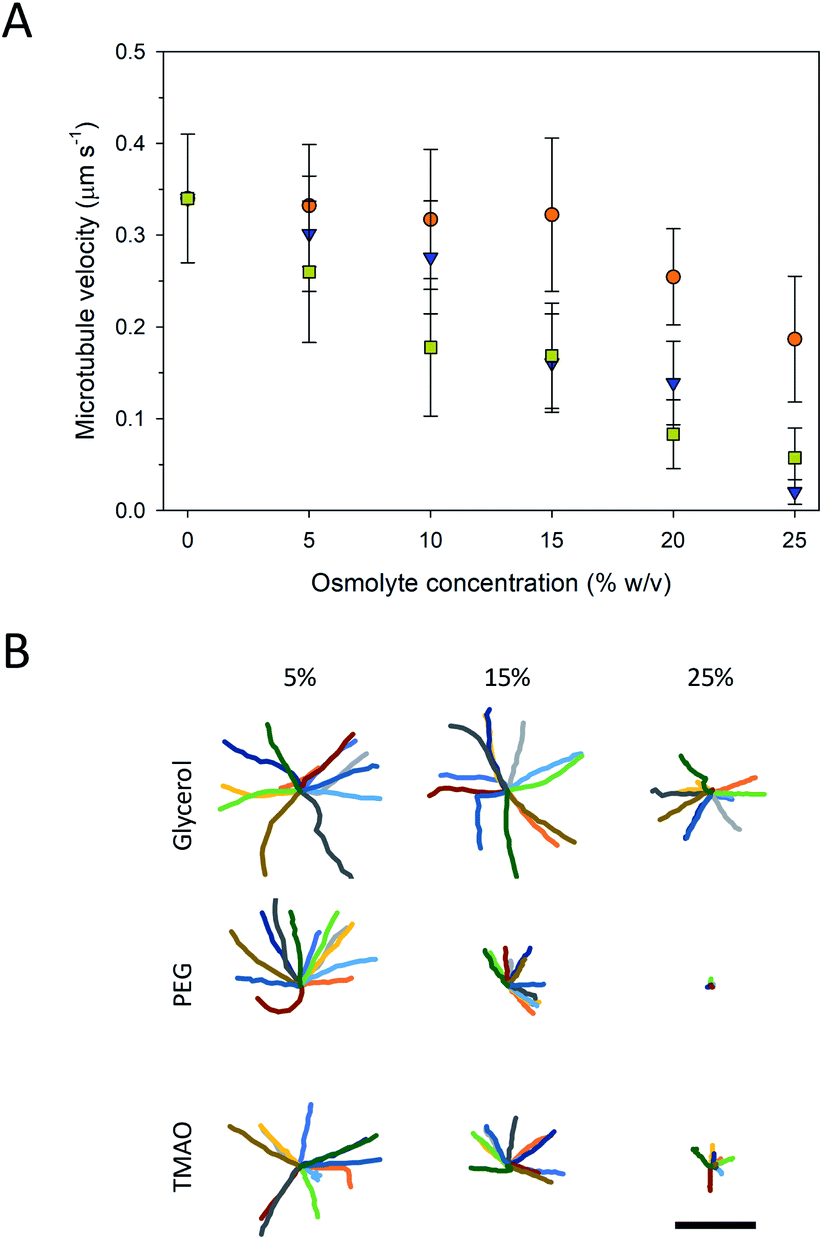 | ||
Fig. 4 (A) Average velocities of moving microtubule at various concentrations of glycerol ( ), PEG ( ), PEG ( ), and TMAO ( ), and TMAO ( ). Error bars are standard deviation. (B) Representative trajectories of microtubules. Each trajectory is 150 s long. Scale bar is 500 μm. ). Error bars are standard deviation. (B) Representative trajectories of microtubules. Each trajectory is 150 s long. Scale bar is 500 μm. | ||
The trajectories of the microtubule motility at high concentrations of PEG and TMAO displayed shorter and somewhat rougher paths, compared to the longer, smoother trajectories at lower concentrations (Fig. 4B). The rough trajectories are attributable to an increase in the fluctuation of the leading tip of the microtubule. We quantified this effect by determining at the angle of the leading tip along its overall trajectory. Here, the location of the microtubule tip was tracked between frames, and the angle of the tip between successive frames was calculated from the dot product of the tip trajectory (Fig. S1A†). As is shown in Fig. 5 and S1B–D,† the average angle is greater at higher concentrations of PEG and TMAO. To confirm that this behaviour is not a measurement artefact related to increased error at low velocities, the average angle was plotted as a function of the average velocity. The angle changes non-linearly with the velocity (Fig. 5B). This correlated behaviour may be explained by the osmolytes interfering with the binding between kinesin motors and the microtubule, in effect causing the microtubule to display motion reminiscent of microtubules moving on surfaces with a low kinesin surface density. Overall, these findings are consistent with the recent observations that TMAO affects the interactions between kinesin and microtubules in a concentration dependent manner.20,21 Our data, however, suggest that this modulation extends to other osmolytes including glycerol and PEG. Further work is needed to develop a more comprehensive understanding as to how molecular crowding, osmotic pressure, and kosmotropes regulate the interaction and motility of kinesin motors on microtubule filaments.
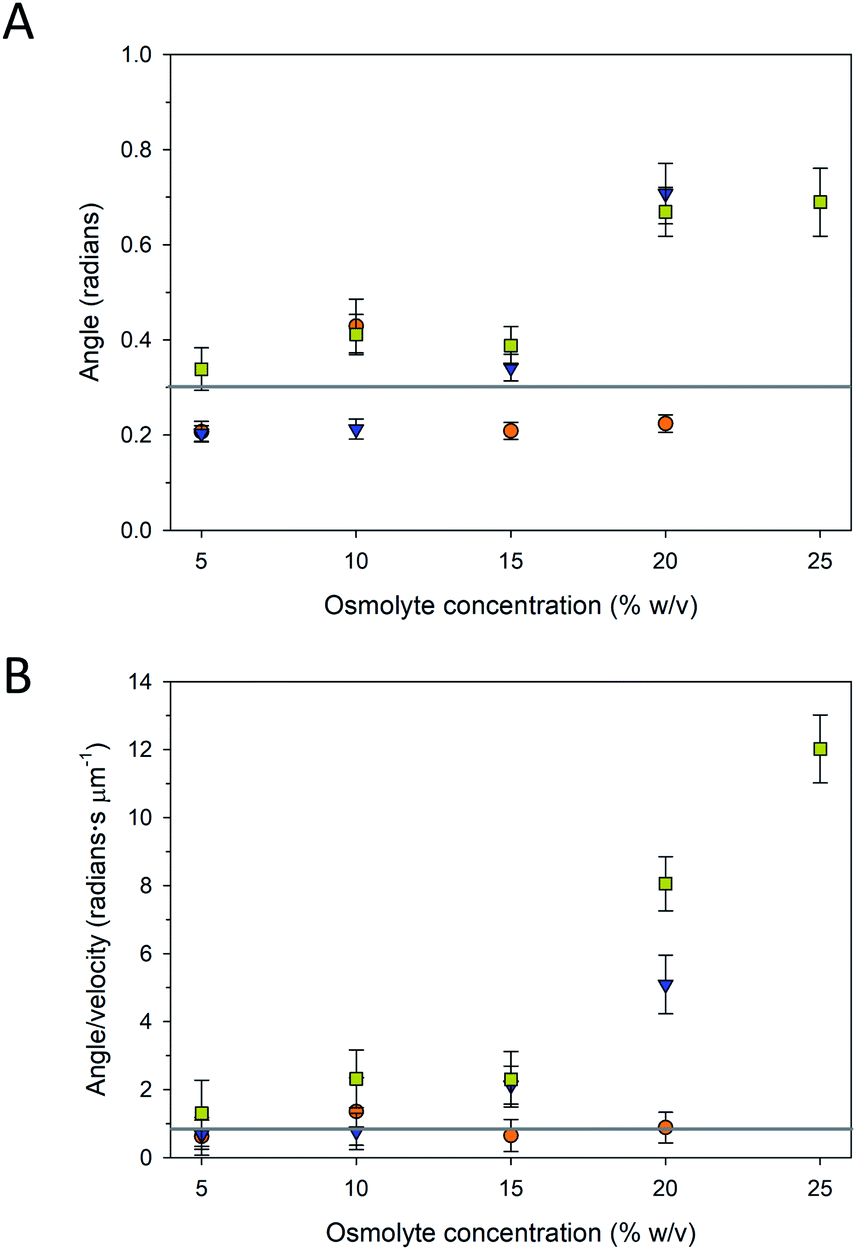 | ||
Fig. 5 (A) Average angle of microtubule tip between frames and (B) average angle/velocity as a function of varying concentrations of glycerol ( ), PEG ( ), PEG ( ), and TMAO ( ), and TMAO ( ). Solid grey lines are average angle (0.3 ± 0.1 radians) and average angle/velocity (0.9 ± 0.4 radians s μm−1) with 0% osmolyte, respectively. Error bars are standard error of the mean. ). Solid grey lines are average angle (0.3 ± 0.1 radians) and average angle/velocity (0.9 ± 0.4 radians s μm−1) with 0% osmolyte, respectively. Error bars are standard error of the mean. | ||
Conclusions
Our prior work demonstrated that certain osmolytes are capable of inhibiting spontaneous depolymerization of microtubules, as well as temperature- and calcium-induced depolymerization. The question addressed in the present work examined the ability of osmolytes to stabilize microtubules in kinesin gliding motility assays. Although it is possible to use osmolytes in place of paclitaxel, our data demonstrate that there is a trade-off in terms of altered motility properties including decreased microtubule velocity and increased pinning of microtubules. The balance between microtubule stability and gliding motility was observed with TMAO in the 10–15% range. In contrast, the addition of glycerol had a relatively small impact on microtubule velocity, but concomitantly had the least microtubule stabilization effect at low concentrations. The optimum concentration of glycerol for microtubule stabilization and motility was 20%. High PEG concentrations had a strongly deleterious effect on velocity, rendering a concentration of 15% as a good compromise with respect to microtubule stabilization and kinesin-driven motility.Experimental
Chemicals, buffers, and supplies
Unless otherwise noted, all chemicals were obtained from Sigma-Aldrich. The flow cell was constructed using a glass slide, a No. 1.5 glass coverslip, and two pieces of double-sided tape. The flow cell had a volume of ∼5 mm3. BRB80 buffer consisted of 80 mM PIPES, 1 mM EGTA, and 1 mM MgCl2, pH 6.9. Osmolyte solutions were composed of BRB80 buffer with additional 5, 10, 15, 20, or 25% (w/v) added PEG, TMAO, or glycerol. The BRB80CA buffer consisted of BRB80 buffer with 1 mM ATP and 0.2 mg mL−1 casein. For imaging, glucose oxidase and catalase buffer (GODCA) consisted of BRB80CA supplemented with 20 μg mL−1 glucose oxidase, 8 μg mL−1 catalase, 20 mM D-glucose, and 600 μM DTT (BioRad). BRB80CA and GODCA solutions were made both plain and with the desired concentration of osmolyte. GPEM buffer consisted of 80 mM PIPES, 2 mM MgCl2, 0.5 mM EGTA, and 1 mM GTP, pH 6.9.Microtubule and kinesin preparation
Microtubules were made by combining TRITC labelled to unlabeled tubulin (5 mg mL−1, Cytoskeleton) in a 1![[thin space (1/6-em)]](https://www.rsc.org/images/entities/char_2009.gif) :4 ratio in GPEM buffer, heating at 37 °C for 30 minutes, and then stabilizing with BRB80 with 10 μM paclitaxel (Taxol®). KIF5B was purified from Drosophila kinesin following previously published protocols.29,30 The kinesin concentration was measured with a UV-vis spectrophotometer (Beckman-Coulter DU640) using ε280 = 42500 M cm−1.
:4 ratio in GPEM buffer, heating at 37 °C for 30 minutes, and then stabilizing with BRB80 with 10 μM paclitaxel (Taxol®). KIF5B was purified from Drosophila kinesin following previously published protocols.29,30 The kinesin concentration was measured with a UV-vis spectrophotometer (Beckman-Coulter DU640) using ε280 = 42500 M cm−1.
Fluorescence imaging
The protocol for osmolyte experiments was as follows: first, the flow cell was filled with a solution of kinesin in BRB80CA and allowed to incubate for 5 min. Next, the flow cell was washed with a solution of microtubules diluted 1:5 in BRB80CA with 10 μm paclitaxel and allowed to incubate for 5 minutes. The microtubules in the flow cell were imaged. Then the flow cell was washed four times with 20 μl of The GODCA solution with the desired osmolyte concentration. Finally, the flow cell was sealed with valap sealant. The flow cells were imaged every 10 s from 0 to 5 min, 15–20 min, and 30–35 minutes on an Olympus IX-81 microscope with a 60× 1.4 NA objective and a Flash 4.0 SCMOS camera. Images were analyzed using ImageJ.31 The ridge detection algorithm32 was used to measure the number and length of the microtubules in the images.
Conflicts of interest
There are no conflicts to declare.Acknowledgements
This work was supported by the U.S. Department of Energy, Office of Basic Energy Sciences, Division of Materials Sciences and Engineering (BES-MSE), Biomolecular Materials Program. Kinesin production and fluorescence microscopy of microtubule depolymerization and motility were performed at the Center for Integrated Nanotechnologies, an Office of Science User Facility operated for the U.S. Department of Energy (DOE) Office of Science. Sandia National Laboratories is a multimission laboratory managed and operated by National Technology & Engineering Solutions of Sandia, LLC., a wholly owned subsidiary of Honeywell International, Inc., for the U.S. Department of Energy's National Nuclear Security Administration under contract DE-NA0003525. This paper describes objective technical results and analysis. Any subjective views or opinions that might be expressed in the paper do not necessarily represent the views of the U.S. Department of Energy or the United States Government.Notes and references
- M. Lasser, J. Tiber and L. A. Lowery, Front. Cell. Neurosci., 2018, 12, 165 CrossRef.
- A. L. Parker, M. Kavallaris and J. A. McCarroll, Front. Oncol., 2014, 4, 153 CrossRef.
- G. J. Brouhard and L. M. Rice, Nat. Rev. Mol. Cell Biol., 2018, 19, 451–463 CrossRef CAS.
- A. M. Robertson and I. M. Hagan, J. Cell Sci., 2008, 121, 4055–4068 CrossRef CAS.
- P. H. Schummel, M. Gao and R. Winter, ChemPhysChem, 2017, 18, 174 CrossRef CAS.
- M. Wieczorek, S. Chaaban and G. J. Brouhard, Cell. Mol. Bioeng., 2013, 6, 383–392 CrossRef.
- D. L. Sackett, Am. J. Physiol., 1997, 273, R669–R676 CAS.
- Y. X. Guo, Y. F. Liu, R. Oldenbourg, J. X. Tang and J. M. Valles, Phys. Rev. E: Stat., Nonlinear, Soft Matter Phys., 2008, 78, 041910 CrossRef.
- D. T. Kulp and J. Herzfeld, Biophys. Chem., 1995, 57, 93–102 CrossRef CAS.
- D. J. Needleman, J. B. Jones, U. Raviv, M. a. Ojeda-Lopez, H. P. Miller, Y. Li, L. Wilson and C. R. Safinya, J. Phys.: Condens. Matter, 2005, 17, S3225–S3230 CrossRef CAS.
- D. J. Needleman, M. A. Ojeda-Lopez, U. Raviv, K. Ewert, J. B. Jones, H. P. Miller, L. Wilson and C. R. Safinya, Phys. Rev. Lett., 2004, 93, 198104 CrossRef.
- T. Arakawa and S. N. Timasheff, Biophys. J., 1985, 47, 411–414 CrossRef CAS.
- S. Ghosh, S. Shahid, N. Raina, F. Ahmad, M. I. Hassan and A. Islam, Int. J. Biol. Macromol., 2020, 150, 1238–1248 CrossRef CAS.
- G. D. Bachand, R. Jain, R. Ko, N. F. Bouxsein and V. VanDelinder, Biomacromolecules, 2018, 19, 2401–2408 CrossRef CAS.
- J. P. Caviston and E. L. F. Holzbaur, Trends Cell Biol., 2006, 16, 530–537 CrossRef CAS.
- G. Saper and H. Hess, Chem. Rev., 2020, 120, 288–309 CrossRef CAS.
- H. Hess and G. Saper, Acc. Chem. Res., 2018, 51, 3015–3022 CrossRef CAS.
- H. Hess and J. L. Ross, Chem. Soc. Rev., 2017, 46, 5570–5587 RSC.
- G. D. Bachand, N. F. Bouxsein, V. VanDelinder and M. Bachand, Wiley Interdiscip. Rev.: Nanomed. Nanobiotechnol., 2014, 6, 163–177 CAS.
- T. Munmun, A. M. R. Kabir, K. Sada and A. Kakugo, Sens. Actuators, B, 2020, 304, 127231 CrossRef CAS.
- T. Munmun, A. M. R. Kabir, Y. Katsumoto, K. Sada and A. Kakugo, Chem. Commun., 2020, 56, 1187–1190 RSC.
- V. Vandelinder and G. D. Bachand, Anal. Chem., 2014, 86, 721–728 CrossRef CAS.
- T. Mashino and I. Fridovich, Arch. Biochem. Biophys., 1987, 258, 356–360 CrossRef CAS.
- L. A. Lopez, L. S. Mayorga and F. Bertini, J. Cell. Biochem., 1990, 43, 281–291 CrossRef CAS.
- T. Kaneko, S. Ando, K. Furuta, K. Oiwa, H. Shintaku, H. Kotera and R. Yokokawa, Nanoscale, 2019, 11, 9879–9887 RSC.
- B. J. N. Reddy, S. Tripathy, M. Vershinin, M. E. Tanenbaum, J. Xu, M. Mattson-Hoss, K. Arabi, D. Chapman, T. Doolin, C. Hyeon and S. P. Gross, Traffic, 2017, 18, 658–671 CrossRef CAS.
- A. Goulet, J. Major, Y. Jun, S. P. Gross, S. S. Rosenfeld and C. A. Moores, Proc. Natl. Acad. Sci. U. S. A., 2014, 111, 1837–1842 CrossRef CAS.
- K. Sozanski, F. Ruhnow, A. Wisniewska, M. Tabaka, S. Diez and R. Holyst, Phys. Rev. Lett., 2015, 115, 218102 CrossRef.
- G. D. Bachand, S. B. Rivera, A. K. Boal, J. Gaudioso, J. Liu and B. C. Bunker, Nano Lett., 2004, 4, 817–821 CrossRef CAS.
- D. L. Coy, M. Wagenbach and J. Howard, J. Biol. Chem., 1999, 274, 3667–3671 CrossRef CAS.
- M. D. Abramoff, P. J. Magelhaes and S. J. Ram, Biophot. Int., 2004, 11, 36–42 Search PubMed.
- C. Steger, IEEE Trans. Pattern Anal. Mach. Intell., 1998, 20, 113–125 CrossRef.
Footnote |
| † Electronic supplementary information (ESI) available. See DOI: 10.1039/d0ra08148e |
| This journal is © The Royal Society of Chemistry 2020 |