 Open Access Article
Creative Commons Attribution 3.0 Unported Licence
Identification, isolation, structural characterization, in silico toxicity prediction and in vitro cytotoxicity assay of simeprevir acidic and oxidative degradation products†
Rasha M. Ahmeda,
Marwa A. A. Fayed b,
Mohammed F. El-Behairy
 c and
Inas A. Abdallah
 *d
*d
aDepartment of Pharmaceutical Chemistry, Faculty of Pharmacy, Misr International University, Cairo 11341, Egypt
bDepartment of Pharmacognosy, Faculty of Pharmacy, University of Sadat City, Sadat City 32897, Egypt
cDepartment of Organic and Medicinal Chemistry, Faculty of Pharmacy, University of Sadat City, Sadat City 32897, Egypt
dDepartment of Analytical Chemistry, Faculty of Pharmacy, University of Sadat City, Sadat City 32897, Egypt. E-mail: inas.abdallah@fop.usc.edu.eg
First published on 24th November 2020
Abstract
Simeprevir is a new direct-acting antiviral drug used for the treatment of chronic hepatitis C. In this work, a simple, fast and economical chromatographic method was developed for the determination of simeprevir in the presence of its acidic and oxidative degradation products. The stress studies performed herein showed that simeprevir degraded under acidic and oxidative conditions but was stable under thermal and alkaline conditions. Chromatographic separation was achieved on a reversed-phase Eclipse XDB C18 column (4.6 × 150 mm, 5 μm). The mobile phase consisted of methanol-0.05 M ammonium acetate (pH 4) (90![[thin space (1/6-em)]](https://www.rsc.org/images/entities/char_2009.gif) :
:![[thin space (1/6-em)]](https://www.rsc.org/images/entities/char_2009.gif) 10, v/v) and was used at a flow rate of 1 mL min−1. The column effluent was monitored at 237 nm. The calibration curve was linear over the concentration range of 0.1–20 μg mL−1. The relative standard deviations for the intra-day and inter-day precision were less than 2%, and good percentage recoveries that met the acceptance criteria of the International Conference on Harmonization (ICH) guidelines were obtained. The robustness was assessed using the Plackett–Burman design. The simeprevir degradation products were isolated by flash chromatography and confirmed by 1H NMR and LC-MS/MS techniques. The fully validated chromatographic method can be applied as a stability-indicating method for simeprevir and for routine analysis during quality control. Additionally, in silico toxicity prediction of the degradation products demonstrated a hepatotoxicity alert for DP 1, DP 2, DP 4 and DP 5 and a carcinogenicity alert for DP 3. In view of safety aspects, an in vitro cytotoxicity assay was carried out for simeprevir degradation products. They were found to be non-toxic in vitro at the tested concentrations.
10, v/v) and was used at a flow rate of 1 mL min−1. The column effluent was monitored at 237 nm. The calibration curve was linear over the concentration range of 0.1–20 μg mL−1. The relative standard deviations for the intra-day and inter-day precision were less than 2%, and good percentage recoveries that met the acceptance criteria of the International Conference on Harmonization (ICH) guidelines were obtained. The robustness was assessed using the Plackett–Burman design. The simeprevir degradation products were isolated by flash chromatography and confirmed by 1H NMR and LC-MS/MS techniques. The fully validated chromatographic method can be applied as a stability-indicating method for simeprevir and for routine analysis during quality control. Additionally, in silico toxicity prediction of the degradation products demonstrated a hepatotoxicity alert for DP 1, DP 2, DP 4 and DP 5 and a carcinogenicity alert for DP 3. In view of safety aspects, an in vitro cytotoxicity assay was carried out for simeprevir degradation products. They were found to be non-toxic in vitro at the tested concentrations.
1. Introduction
Hepatitis C is a liver disease caused by a small, positive stranded ribonucleic acid virus.1 This infectious disease affects approximately 150 million people, and those infected eventually suffer from complications, such as ascites, fibrosis and carcinoma.2–4 The emergence of hepatitis C drug treatment has led to a reduction in the number of patients who reach end-stage liver disease and suffer from its complications.Simeprevir, a second-generation NS3-4A protease inhibitor, is one of the most recent direct-acting antiviral drugs used for the treatment of genotype I hepatitis C.5 It is administered in combination with interferon and ribavirin. The mode of cleavage of encoded polyproteins into individual viral proteins.6–9
Simeprevir is rapidly absorbed after oral administration and is then metabolized by oxidation by cytochrome P450 in the liver and reaches its maximum plasma concentration between 4 to 6 hours after administration.10,11
Quality testing of active pharmaceutical ingredients or pharmaceutical products during their storage and shelf life is crucial.12 According to the ICH guidelines, stress studies should be carried out by testing the substance under different conditions, such as acidic, alkaline, oxidative and thermal conditions. Such studies are performed to determine the behaviour of the drug molecule and predict the changes that will occur during storage.13,14
A literature survey revealed that different analytical methods for the determination of Simeprevir alone in plasma, including HPLC-DAD15 and LC-MS/MS,16 or from dosage forms in combination with sofosbuvir by HPLC-DAD,17 have been reported. Three stability-indicating methods have been reported for the quantification of simeprevir in the presence of its degradation products, and these methods used HPLC-DAD,18 spectrophotometry19 and spectrofluorometry.20
Although there are several reported analytical methods for the determination of simeprevir, there have been no detailed studies on its degradation products, especially because simeprevir is a non-pharmacopeial drug, and its stability and the identities of its degradation products require further study.
The objective of the present study is to develop an HPLC stability-indicating method to study the degradation behaviour of simeprevir under a variety of degradation conditions, including acidic and oxidative conditions, with high resolution and selectivity. The degradation products of simeprevir will be isolated and characterized then in silico toxicity prediction and in vitro SRB cytotoxicity assay of all degradation products will be investigated.
2. Experimental
2.1. Chemicals and reagents
Simeprevir sodium salt was obtained from Hikma Pharmaceutical Industries (Cairo, Egypt). Methanol (HPLC-grade), acetonitrile (HPLC-grade), hydrochloric acid (HCl) and sodium hydroxide (NaOH), deuterated chloroform (CDCl3) and deuterated DMSO (DMSO-d6) were purchased from Sigma Aldrich (St. Louis, MO, USA). Ammonium acetate, acetic acid and hydrogen peroxide (30% w/v) were purchased from J.T. Baker Chemical Co. (Phillipsburg, NJ, USA). Penicillin–streptomycin (×100), 0.25% trypsin–EDTA, phosphate buffered saline (PBS) and fetal bovine serum (phenol red free) were purchased from Lonza Group Ltd. (Basel, Switzerland). Sulforhodamine-B (SRB), dimethyl sulfoxide (DMSO) and Dulbecco's Modified Eagle Medium (DMEM) were purchased from Sigma-Aldrich (St. Louis, MO, USA). Distilled water was purified by a MilliQ® plus water system (Millipore; Billerica, MA, USA).2.2. Cell culture
Human Skin Fibroblast cell line was obtained from Nawah Scientific Inc., (Mokatam, Cairo, Egypt). Cells were maintained in DMEM media supplemented with 100 mg mL−1 of streptomycin, 100 units per mL of penicillin and 10% of heat-inactivated fetal bovine serum in humidified, 5% (v/v) CO2 atmosphere at 37 °C.2.3. Instrumentation
Chromatographic separations were carried out on an Agilent 1100 separation system (Agilent Technologies, USA). The high-performance liquid chromatography (HPLC) system was equipped with an online degasser, an isocratic pump and a UV detector.Isolation of acidic and oxidative degradation products of simeprevir was carried out on Flash chromatography apparatus (puriFlash XS 520 Plus) (Interchim, France).
The HPLC system was controlled by Agilent LC Chemstation 1100 software. The degradation products were structurally characterized using an AB Sciex series LC system (Applied Biosystems Sciex, Ontario, Canada) separation module connected to an API 4500 triple quadrupole mass spectrometer (Applied Biosystems Sciex, Ontario, Canada) coupled with an ion source (Turbo ion spray) that was operated in the positive electrospray ionization (ESI) mode.
The mass spectrometric data were acquired using Analyst 1.6.3 software. The typical operating source conditions for MS scans for detecting simeprevir and its degradation products were optimized to the following: curtain gas (CUR): 20 psi, ion spray voltage (IS): 5500 V, temperature (TEM): 500 °C, declustering potential (DP): 30 V, ion source gas 1 (GS 1): 20 psi, ion source gas 2 (GS 2): 20 psi. Air was used as the nebulizer gas, while nitrogen was used as the auxiliary gas.
The 1H experiments were performed on a 400 MHz NMR (ADVANCE III HD-500, Bruker, Fällanden, Switzerland) spectrometer using DMSO-d6 and CDCl3 as solvent. The chemical shift values are reported on the δ scale in ppm relative to TMS (δ = 0.00 ppm) as the internal standard.
Absorbance was measured in the cytotoxicity assay at 540 nm on a BMG LABTECH®-FLUOstar Omega microplate reader (Ortenberg, Germany).
2.4. Chromatographic conditions
Chromatographic separations were achieved on a Zorbax Eclipse XDB C18 column (150 × 4.6 mm, 5 μm) (Agilent Technologies, USA). The mobile phase composition was (A): methanol and (B): 0.01 M ammonium acetate buffer (pH = 4) (A: 90, B: 10, v/v) used at a flow rate of 1 mL min−1.A detection wavelength of 237 nm and an injection volume of 20 μL were selected for the determination of Simeprevir and its degradation products. All chromatograms were acquired at room temperature.
2.5. Forced degradation study
The forced degradation studies were carried out on 1 mg mL−1 in methanol. Acidic hydrolysis was performed by treating the drug with 0.5 M hydrochloric acid for 5 hours, while the basic hydrolysis conditions were 1 M sodium hydroxide for 5 hours. In both cases, the reaction was immersed in a boiling water bath maintained at 100 °C.Oxidative degradation was performed by treating the drug with 3% hydrogen peroxide for 5 hours and the reaction was immersed in a boiling water bath maintained at 100 °C. In the thermal degradation, simeprevir was subjected to high temperature by placing the drug in a thermostatic oven at 100 °C.
2.6. Isolation of degradation products by flash chromatography
A Flash chromatography apparatus (puriFlash XS 520 Plus) was used for purification of simeprevir acidic and oxidative degradation products using normal phase silica gel column (12 g × 30 μm) and hexane/methylene chloride mobile phase.The acidic degradation products mixture consists of the drug and three degradation products according to the recorded HPLC chromatogram was subjected to flash chromatography with an isocratic mobile phase composed of hexane and methylene chloride (1![[thin space (1/6-em)]](https://www.rsc.org/images/entities/char_2009.gif) :
:![[thin space (1/6-em)]](https://www.rsc.org/images/entities/char_2009.gif) 1 v/v). The flow rate was set at 15 mL min−1, where the first acidic degradation product (DP 1) was isolated in pure form. The other two acidic degradation products in addition to the drug that were eluted in several fractions in the form of a mixture which were monitored using thin layer chromatography (TLC) and similar fractions were gathered and combined depending on the number and color of the spots under UV light. Then the mixture was concentrated and reloaded on silica gel column using flash chromatography under the same previous conditions and with a gradient of hexane/methylene chloride used as the mobile phase, starting with 100% hexane and increasing polarity till 100% methylene chloride where the two acidic degradation products (DP 3, DP 2) were isolated single and pure.
1 v/v). The flow rate was set at 15 mL min−1, where the first acidic degradation product (DP 1) was isolated in pure form. The other two acidic degradation products in addition to the drug that were eluted in several fractions in the form of a mixture which were monitored using thin layer chromatography (TLC) and similar fractions were gathered and combined depending on the number and color of the spots under UV light. Then the mixture was concentrated and reloaded on silica gel column using flash chromatography under the same previous conditions and with a gradient of hexane/methylene chloride used as the mobile phase, starting with 100% hexane and increasing polarity till 100% methylene chloride where the two acidic degradation products (DP 3, DP 2) were isolated single and pure.
Purification of the oxidative degradation products mixture, which consists of the drug with two degradation products (DP 5, DP 4) according to the recorded HPLC chromatogram, was carried out under the same conditions of flash chromatography and hexane/methylene chloride gradient as mobile phase starting with hexane (100%) then increasing the polarity till (100%) methylene chloride where both were isolated in pure form.
Both acidic degradation products (DP 1, DP 2 and DP 3) and oxidative degradation products (DP 4 and DP 5) were obtained as pure solids after concentration and removal of the mobile phase.
2.7. Preparation of the samples for chromatographic analyses
The samples from the acidic and basic hydrolysis stress tests were neutralized and diluted with methanol to achieve final assay concentrations of 100 μg mL−1. The final sample solutions were filtered through a 0.45 μm membrane before HPLC analysis. All sample solutions were stored at 4 °C in a refrigerator to avoid degradation.2.8. Method validation
The proposed chromatographic method was validated with respect to selectivity, limit of detection (LOD), limit of quantification (LOQ), linearity, accuracy, precision and robustness as described by the ICH guidelines Q2 (R1).212.9. Application of the developed HPLC method
The developed stability-indicating assay was applied to the analysis of simeprevir in a commercial formulation. A standard addition technique was used to assess the developed and validated HPLC method.2.10. In silico toxicity studies
The ADMET descriptors and toxicity parameters of the tested compounds were calculated using Discovery studio 4.0. At first, the CHARMM force field was applied then the compounds were prepared and minimized according to the preparation of small molecule protocol. Then different parameters were calculated from toxicity prediction (extensible) protocol. Also, the ADMET descriptors protocol was applied to carry out these studies.22,232D structures of the tested compounds were sketched using ChemBioDraw Ultra 14.0 and saved in MDL-SD file format. SD file was opened, 3D structures are protonated and energy minimized by applying CHARMM force fields for charge, and MMFF94 force field for partial charge. Then, the tested compounds were prepared using prepare ligand option. In which, we used rule based option for ionization mode. At the same time, the tautomer generation, isomer generation, and fixation of bad valences were adjusted to be false. Next, the prepared compounds were subjected to toxicity calculation process using toxicity prediction (extensible) option. In which, the models panel was feed by different model names. In addition, the similarity search was adjusted to be true. The force field based scoring functions (CHARMM force fields for charge, and MMFF94 force field for partial charge) were used in this study.24
2.11. Cytotoxicity assay
Cell viability was assessed by SRB assay.25 Aliquots of 100 μL cell suspension (5 × 10³ cells) were in 96-well plates and incubated in complete media for 24 h. Cells were treated with another aliquot of 100 μL media containing (DP 1, DP 2, DP 3, DP 4, DP 5 and Doxorubicin as positive control) at various concentrations ranging from (0.01, 0.1, 1, 10, 100 μm). After 72 h of drug exposure, cells were fixed by replacing media with 150 μL of 10% TCA and incubated at 4 °C for 1 h. The TCA solution was removed, and the cells were washed 5 times with distilled water. Aliquots of 70 μL SRB solution (0.4% w/v) were added and incubated in a dark place at room temperature for 10 min. Plates were washed 3 times with 1% acetic acid and allowed to air-dry overnight. Then, 150 μL of Tris (10 mM) was added to dissolve protein-bound SRB stain; the absorbance was measured at 540 nm using microplate reader. The percentage of cell viability was calculated by using the following formula:263. Results and discussion
3.1. HPLC method development and optimization
The chromatographic method was developed by selecting a mobile phase and stationary phase suitable for the separation of simeprevir from its degradation products. Preliminary studies were performed using a C18 column (150 × 4.6 mm, 5 μm) and trying different mobile phases with different polarities to identify chromatographic conditions well suited to the structural features of simeprevir. A mobile phase with a high percentage of an organic modifier was selected and using water as the aqueous phase was not suitable because the peak shape and symmetry were poor. Subsequently, ammonium acetate buffers at different concentrations (0.01–0.05 M) and different pH values (3–5) were screened to improve the shape and symmetry of the peaks. Peak tailing was observed upon using highly concentrated acetate buffers, while the pH 4 buffer worked well because the pH was well away from the pKa of simeprevir (pKa = 5.9). Detection of simeprevir was performed at 237 nm which was observed as wavelength of maximum absorbance (λmax) after UV scanning of drug solution as shown in Fig. S1.†Desirable resolution between Simeprevir and its degradation products and acceptable peak shapes were observed using isocratic elution as described under chromatographic conditions, and the chromatograms shown in Fig. 1 were acquired using the optimized conditions for the separation of simeprevir from its acidic and oxidative degradation products. Results of system suitability parameters for simeprevir in presence of its degradation products are shown in Table 1.
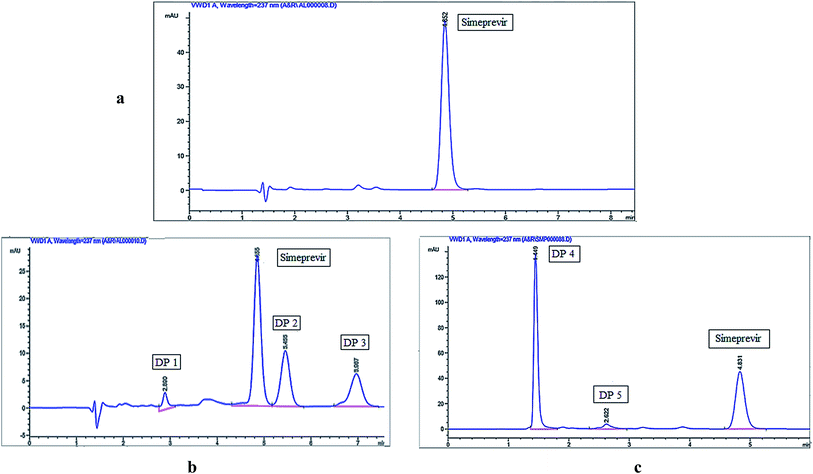 | ||
| Fig. 1 HPLC chromatograms of (a) simeprevir (10 μg mL−1), (b) acidic degradation and (c) oxidative degradation. | ||
| Parameter | Acidic DPs | Oxidative DPs |
|---|---|---|
| Resolution | 1.75 | 9.0 |
| Selectivity | 1.14 | 3.0 |
| No. of theoretical plates | 5066 | 5080 |
| Capacity factor | 2.2 | 2.2 |
| Symmetry | 0.82 | 0.81 |
3.2. Forced degradation study
The degradation behaviour of simeprevir was studied according to the ICH guidelines, and the drug was found to be unstable to acidic and oxidative conditions and stable under alkaline and thermal degradation conditions, as shown in Table 2. Although, previous reports by Attia et al.18 and Mohammed et al.27 uses different basic hydrolysis conditions; 0.1 N NaOH for 3 hours at room temperature and 1 M NaOH for 2 hours at 60 °C; respectively. Both results were found to be similar where one degradation product was observed with almost same degradation percentage (35.55% and 39.80%). In our report, no peak was observed after HPLC injection of the alkaline degradation samples which is confirmed using TLC and Flash Chromatography; in which only drug peak was detected.| Degradation study | Exposure conditions | Time | DPs formed & Rt (min) | % Degradation |
|---|---|---|---|---|
| a DPs: degradation products, Rt: retention time. | ||||
| Acidic degradation | 0.5 M HCl at 100 °C | 5 hours | DP 1 (Rt = 2.890) | 26.63 |
| DP 2 (Rt = 5.455) | ||||
| DP 3 (Rt = 6.987) | ||||
| Alkaline degradation | 1 M NaOH at 100 °C | 5 hours | No DPs formed | No degradation |
| Oxidative degradation | 3% w/v H2O2 at 100 °C | 5 hours | DP 4 (Rt = 1.449) | 21.87 |
| DP 5 (Rt = 2.622) | ||||
| Thermal degradation | Oven at 100 °C | 10 hours | No DPs formed | No degradation |
All degradation samples were either neutralized as in case of acidic or alkaline hydrolysis or left for residual hydrogen peroxide to be bubbled out. Then all sample were diluted with mobile phase before HPLC injections. All these steps confirms that the degradation products, which were separated on the HPLC chromatograms, were actual degradants and not residual reagents peaks. In addition, the Flash Chromatography step followed by TLC in which we separated degradation products as single compounds confirmed their presence in the sample.
Three degradation products (DP 1, DP 2, and DP 3) were observed using HPLC-UV when simeprevir was subjected to acidic hydrolysis, while two degradation products (DP 4 & DP 5) were obtained under oxidative degradation. Simeprevir was more susceptible to acidic degradation than to oxidative degradation, as 26.63% degradation was observed under acidic conditions compared to 21.87% under oxidative conditions.
3.3. Characterization of degradation products
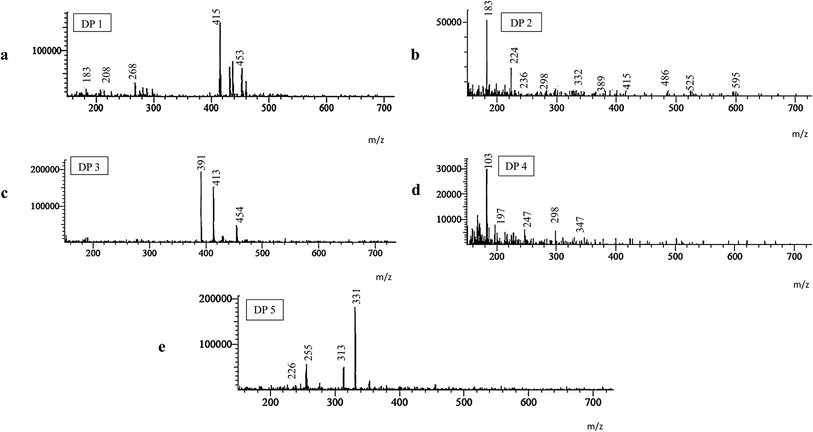
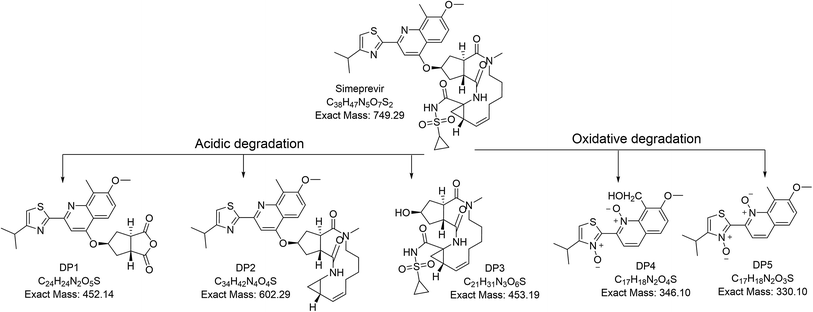
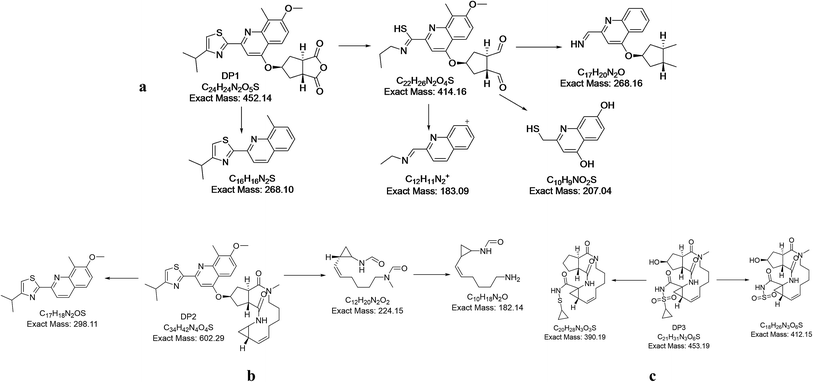
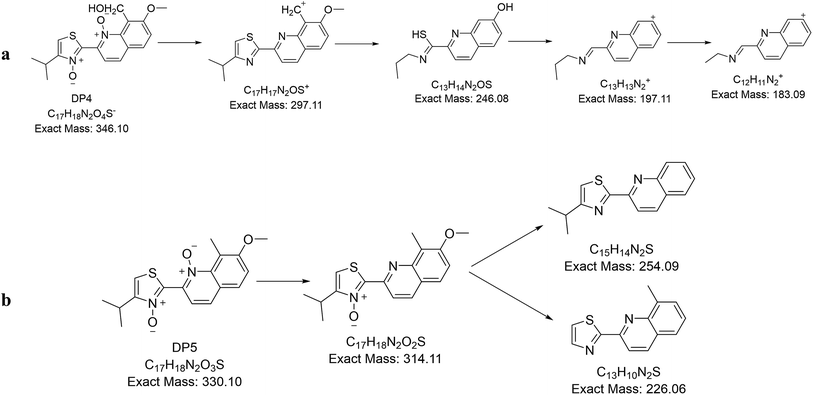
All degradation products and their fragmentation pattern has been depicted in Fig. 3–5.As per (Fig. S2†), the 1H-NMR of intact Simeprevir drug has shown the characteristic 4 aromatic protons, one proton at δ 8.03 ppm (1H) of thiazole rings plus three at δ 7.52–7.39 ppm (3H) of quinoline ring. Also, amide protons were recognized as 2 singlet signals at δ 7.26 ppm (1H) and 5.33 ppm (1H). The alkene protons in the macrocycle were detected at δ 5.45 ppm (2H). The most de-shielded proton of cyclopentane ring attached to oxygen at position 4 of quinoline ring was spotted at δ 4.34–4.20 ppm (1H) as multiplet signal due to coupling with adjacent protons of the cyclopentane ring. The singlet signal corresponding to methoxy group at 7 position of quinoline ring was at δ 3.96 ppm (s, 3H) while the singlet signal corresponding to N-methyl group was at δ 3.09 ppm (s, 3H). The methyl group at position 8 of quinoline ring was noticed as singlet signal at δ 2.58 ppm (s, 3H). Further aliphatic protons of isopropyl group (6H) on thiazole and cyclopropyl group (4H) attached to sulfur was detected at δ 1.34 ppm (6H), δ 0.78 ppm (2H), and 0.62 ppm (2H) respectively.
3.4. Method validation
| Parameter | Simeprevir |
|---|---|
| a RSD: relative standard deviation.b Expressed mean of three replicates. | |
| Linearity | |
| Regression equation | Y = 54.75X + 15.28 |
| Range (μg mL−1) | 0.1–20 |
| Correlation coefficient (r) | 0.9997 |
| Slope | 54.75 |
| Intercept | 15.28 |
| LOD (μg mL−1) | 0.10 |
| LOQ (μg mL−1) | 0.34 |
![[thin space (1/6-em)]](https://www.rsc.org/images/entities/char_2009.gif) |
|
| Precision | |
| Repeatability (intra-day) (% RSD)a | |
| QCL (0.5 μg mL−1) | 1.80% |
| QCM (7 μg mL−1) | 1.03% |
| QCH (15 μg mL−1) | 0.71% |
| Intermediate precision (inter-day) (% RSD)a | |
| QCL (0.5 μg mL−1) | 0.70% |
| QCM (7 μg mL−1) | 0.44% |
| QCH (15 μg mL−1) | 0.57% |
![[thin space (1/6-em)]](https://www.rsc.org/images/entities/char_2009.gif) |
|
| Accuracy | |
| (Mean ± S.D)b | |
| QCL (0.5 μg mL−1) | 100.80 ± 1.54 |
| QCM (7 μg mL−1) | 99.43 ± 1.34 |
| QCH (15 μg mL−1) | 100.67 ± 0.63 |
| Exp. no. | pH | Methanol | Wavelength | Flow rate |
|---|---|---|---|---|
| 1 | 4.2 | 88 | 235 | 1.2 |
| 2 | 4.2 | 92 | 235 | 0.8 |
| 3 | 4.2 | 92 | 239 | 0.8 |
| 4 | 3.8 | 92 | 239 | 1.2 |
| 5 | 4.2 | 88 | 239 | 1.2 |
| 6 | 3.8 | 92 | 235 | 1.2 |
| 7 | 3.8 | 88 | 239 | 0.8 |
| 8 | 3.8 | 88 | 235 | 0.8 |
| 9 | 4 | 90 | 237 | 1 |
| 10 | 4 | 90 | 237 | 1 |
| 11 | 4 | 90 | 237 | 1 |
3.5. Application to pharmaceutical dosage form
The validated method was successfully applied for the determination of simeprevir in its dosage form, and satisfactory results were obtained with a good recovery (101.34%). A standard addition technique was used (Table 5) to verify the method, and the study revealed no interference from the excipients.| Claimed taken (μg mL−1) | Found (%) | Pure added (μg mL−1) | Recovery% | |
|---|---|---|---|---|
| Merospevir® hard gelatin capsules (B.N. 160117) | 7 | 101.34 ± 1.66 | 3 | 101.71 ± 0.93 |
| 7 | 101.56 ± 0.13 | |||
| 8 | 100.85 ± 0.46 |
3.6. In silico toxicity studies
Toxicity prediction was carried out for our degradation products based on the validated and constructed models in Discovery studio software.31,32 The toxicity of the tested compounds against central nervous system and liver have been determined in ADMET study.ADMET – Blood Brain Barrier (BBB) penetration studies predicted that BBB penetration levels of DP 2 and DP 3 are very low. While DP 4 exhibited low level and DP 1 and DP 5 showed medium BBB penetration levels. Accordingly, all compounds were expected to be safe to CNS. The hepatotoxicity model predicts potential organ toxicity for a wide range of structurally diverse compounds.33 All examined compounds were demonstrated to have some a sort of hepatotoxicity except DP 3. Further in vitro and in vivo are required to validate this primary in silico results.
The measurement of carcinogenic potency for degradation products is an essential factor to understand its risk assessment.34 Consequently, three different in silico studies have been proceeded as follow; (i) TOPKAT_mouse_male_FDA_none_vs_carcinogen model that is one of FDA rodent carcinogenicity models. The chosen model computes the probability of a submitted chemical structure being a carcinogen or not.35 (ii) Carcinogenic potency (TD50) which predicts the median tumorigenic dose (the dose required to produce a tumorigenic effect in 50% of rats) of a chemical in a chronic exposure toxicity test.35 TD50 has been used historically as a metric to determine carcinogenic potency and was included in the Carcinogenic Potency Data Base (CPDB)36 and (iii) developmental toxicity potential which predicts whether a chemical compound is likely to be toxic in a developmental toxicity potential assessment. The developmental toxicity is any functional or structural change, either reversible or irreversible, that interferes and alter homeostasis, normal growth, differentiation, development or behaviour.37,38
On the other hand, to reveal the acute and chronic toxicity of the examined compounds, three other in silico experiments were done (i) rat maximum tolerated dose (MTD) which predicts the highest dose of a chemical that expected to produce the desired effect without causing unacceptable side effects.39,40 (ii) Rat oral LD50 which predicts the rat oral acute median lethal dose (LD50) in the toxicity test of a chemical41 and (iii) rat chronic (LOAEL) which predicts the rat chronic lowest observed adverse effect level (LOAEL) value of a chemical.42
As shown in Table 6, most compounds showed in silico very low adverse effect and toxicity against the tested models. For FDA Rodent Carcinogenicity model, all compounds were appeared to be non-carcinogen except DP 3. For carcinogenic potency TD50 mouse model, compounds DP 1 and DP 2 showed low TD50 values, while DP 2, DP 4, and DP 5 showed high TD50 values. Regarding rat maximum tolerated dose model, the examined compounds showed maximum tolerated dose with a range of 0.006 to 0.020 g kg−1 body weight. Additionally, all compounds were non-toxic against developmental toxicity potential model. For rat oral LD50 model, all compounds showed low oral LD50 values ranging from 0.080 to 0.352 mg per kg body weight per day. For rat chronic LOAEL model, the compounds showed LOAEL with a range of 0.005 to 0.023 g kg−1 body weight.
| DP 1 | DP 2 | DP 3 | DP 4 | DP 5 | |
|---|---|---|---|---|---|
| a Unit: mg per kg body weight per day.b Unit: g kg−1 body weight.c BBB level, blood brain barrier level, 0 = very high, 1 = high, 2 = medium, 3 = low, 4 = very low.d Hepatotoxicity probability, TRUE means toxic, FALSE means non-toxic. | |||||
| TOPKAT_mouse_male_FDA_none_vs_carcinogen model | Non-carcinogen | Non-carcinogen | Carcinogen | Non-carcinogen | Non-carcinogen |
| Carcinogenic potency TD50 mousea | 11.613 | 3.910 | 33.345 | 47.454 | 73.882 |
| Developmental toxicity potential | Toxic | Non-toxic | Non-toxic | Non-toxic | Non-toxic |
| Rat maximum tolerated doseb | 0.018 | 0.006 | 0.012 | 0.020 | 0.013 |
| Rat oral LD50b | 0.300 | 0.352 | 0.290 | 0.115 | 0.080 |
| Rat chronic LOAELb | 0.011 | 0.005 | 0.005 | 0.019 | 0.023 |
| BBB levelc | 2 | 4 | 4 | 3 | 2 |
| Hepatotoxic predictiond | TRUE | TRUE | FALSE | TRUE | TRUE |
Assessment of real accelerated stability studies for simeprevir with in vivo toxicity prediction of these degradation products are of great importance and will be presented in the near future in a separate study by our research group.
3.7. Cytotoxicity assay
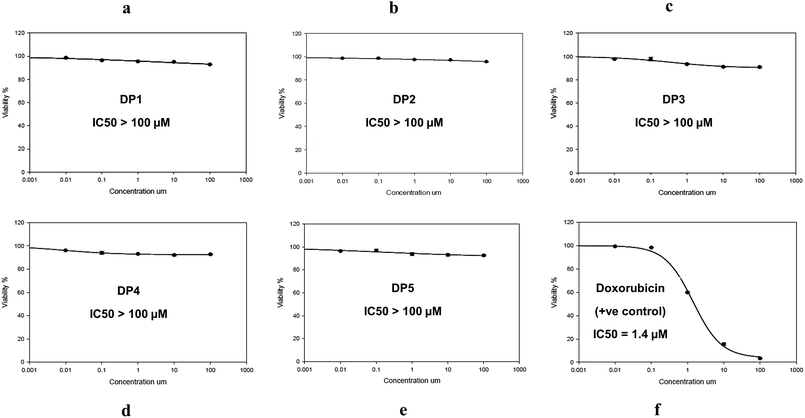
Cytotoxicity assay was carried out to confirm the in silico toxicity prediction study results. As an in vitro method to monitor the potential toxicity and/or safety of simeprevir and its degradation products (DP 1, DP 2, DP 3, DP 4 and DP 5), against Human Skin Fibroblast (HSF) cell line. SRB assay was used to assess the effect of these compounds on the viability and proliferation of HSF cell line (Table S1†), in addition to taking images using the optical microscope to register any change on the tested cells.The percentage of cell viability was measured at five different concentrations (0.01, 0.1, 1, 10 and 100 μM) in comparison with doxorubicin as a standard drug (positive control) which is monitored at the same concentration range after incubation for 72 h period.
The results of the SRB assay showed excellent correlation with the in silico results where no alterations on the cell viability were observed (100.58% ± 0.109) after incubation of the degradation products with HSF cell line as shown in Fig. 6 and Table S1.† As for DP 3, it showed slight cytotoxicity that reached 89.86% in one of the replicates at concentration 100 μM which was suggested as a carcinogenic agent in the in silico study. The cell viability range reached 97.91 ± 0.645 and 96.73 ± 0.420 at the same concentration for the other degradation products (DP 1, DP 2, DP 4 and DP 5).
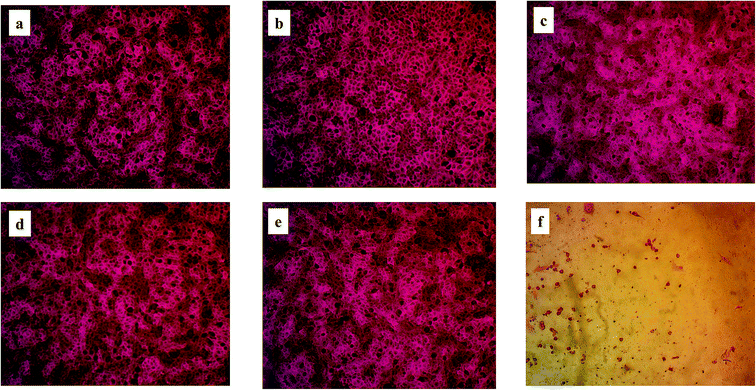
The optical microscope stained images were recorded as shown in Fig. 7 comparing the cytotoxic effect of the five degradation products with that of doxorubicin at a concentration of 100 μM. It shows clearly that no morphological changes occur in case of the degradation products with exception of slight changes in case of DP 3. This proves that simeprevir acidic and oxidative degradation products are non-toxic up to 100 μM (IC50 > 100 μM). Same cytotoxic effect comparison was performed between the degradation products and doxorubicin at a lower concentration (0.1 μM) as shown in Fig. S11† with no occurrence of morphological changes in both degradation products and doxorubicin.
4. Conclusion
A stability-indicating method for simeprevir was developed according to the ICH guidelines. Simeprevir was found to be susceptible to acidic and oxidative stress and stable under alkaline and thermal stress conditions. Three major degradation products (DP 1, DP 2 and DP 3) from the acidic conditions and two degradation products (DP 4 and DP 5) from the oxidative stress conditions were detected using HPLC-UV. The degradation products were successfully isolated and characterized using LC-MS MS and 1H NMR techniques. The proposed acidic and oxidative degradation pathways of simeprevir were outlined and explained. The chromatographic method was validated and found to be accurate, precise, and suitable for application in routine quality control. The in silico toxicity prediction revealed the carcinogenic potential of DP 3. All degradation products were found to hepatotoxic except for DP 3 based on high probability scores. In vitro cytotoxicity study for the isolated DPs were carried out on Human Skin Fibroblast cell line. All DPs exhibited no toxicity with an IC50 > 100 μM.Conflicts of interest
There are no conflicts to declare.References
- FDA, Guidance for Industry, Chronic Hepatitis C virus infection: Developing direct – Acting antiviral drugs for treatment, 2017 Search PubMed.
- T. Kanda, S. Nakamoto, S. Wu and O. Yokosuka, Ther. Clin. Risk Manage., 2014, 10, 387–394 CrossRef.
- A. Rosenquist, B. Samuelsson, P. Johansson, M. D. Cummings, O. Lenz, K. Simmen, S. Vendeville, H. de Kock, M. Nilsson, A. Horvath, R. Kalmeijer, G. de la Rosa and M. Beumont-Mauviel, J. Med. Chem., 2014, 57, 1673–1693 CrossRef CAS.
- J. Berenguer, J. lvarez-Pellicer, P. M. Martin, J. López-Aldeguer, M. A. Von-Wichmann, C. Quereda, J. Mallolas, J. Sanz, C. Tural, J. M. Bellón and J. González-García, Hepatology, 2009, 50, 407–413 CrossRef CAS.
- O. Lenz, T. Verbinnen, B. Fevery, L. Tambuyzer, L. Vijgen, M. Peeters, A. Buelens, H. Ceulemans, M. Beumont, G. Picchio and S. De Meyer, J. Hepatol., 2015, 62, 1008–1014 CrossRef CAS.
- A. Ahmed and D. J. Felmlee, Virsus, 2015, 7, 6716–6729 CrossRef CAS.
- D. M. You and P. J. Pockros, Expert Opin. Pharmacother., 2013, 14, 2581–2589 CrossRef CAS.
- T. Anantharamu, S. Sharma, A. K. Sharma, A. K. Gupta, N. Dahiya and D. B. Brashier, Int. J. Nutr., Pharmacol., Neurol. Dis., 2014, 4, 6–11 CrossRef.
- European Medicines Agency (EMA), Summary of Product Characteristics (Annex I), 2014 Search PubMed.
- S. Burgess, N. Partovi, E. M. Yoshida, S. R. Erb, V. M. Azalgara and T. Hussaini, Ann. Pharmacother., 2015, 49, 674–687 CrossRef CAS.
- J. Snoeys, M. Beumont, M. Monshouwer and S. Ouwerkerk-Mahadevan, Clin. Pharmacol. Ther., 2016, 99, 224–234 CrossRef CAS.
- FDA, Guidance for Industry, Q7 Good Manufacturing Practice Guidance for active pharmaceutical ingredients, 2016 Search PubMed.
- M. Bakshi and S. Singh, J. Pharm. Biomed. Anal., 2002, 28, 1011–1040 CrossRef CAS.
- ICH, Harmonized Tripartite Guidelines, Stability testing of new drug substances and products. Q1A (R2): International conference on harmonization, IFPMA, Geneva, 2003 Search PubMed.
- G. Nannetti, S. Pagni, S. G. Parisi, A. Alberti, A. Loregian and G. Palú, J. Pharm. Biomed. Anal., 2016, 121, 197–203 CrossRef CAS.
- I. Vanwelkenhuysen, R. de Vries, P. Timmerman and T. Verhaeghe, J. Chromatogr. B: Anal. Technol. Biomed. Life Sci., 2014, 958, 43–47 CrossRef CAS.
- B. R. Kumar and D. K. V. Subrahmanyam, Indo Am. J. Pharm. Res., 2016, 6, 4508–4520 CAS.
- K. A. M. Attia, N. M. El-Abasawi, A. El-Olemy and A. Serag, Anal. Chem. Lett., 2017, 7, 43–51 CrossRef CAS.
- K. A. M. Attia, N. M. El-Abasawi, A. El-Olemy and A. Serag, Spectrochim. Acta, Part A, 2018, 190, 1–9 CrossRef CAS.
- K. A. M. Attia, N. M. El-Abasawi, A. El-Olemy and A. Serag, Luminesence, 2018, 33, 382–390 CrossRef CAS.
- ICH, Harmonized Tripartite Guidelines, Validation of Analytical Procedures; Text and Methodology. Q2 (R1): International conference on harmonization, IFPMA, Geneva, 2005 Search PubMed.
- M. K. Ibrahim, I. H. Eissa, M. S. Alesawy, A. M. Metwaly, M. M. Radwan and M. A. ElSohly, Bioorg. Med. Chem., 2017, 25, 4723–4744 CrossRef CAS.
- M. A. El-Zahabi, E. R. Elbendary, F. H. Bamanie, M. F. Radwan, S. A. Ghareib and I. H. Eissa, Bioorg. Chem., 2019, 91, 103115 CrossRef CAS.
- F. Sapundzhi, K. Prodanova and M. Lazarova, AIP Conference Proceedings, AIP Publishing LLC, 2019, p. 100008 Search PubMed.
- P. Skehan, R. Storeng, D. Scudiero, A. Monks, J. McMahon, D. Vistica, J. T. Warren, H. Bokesch, S. Kenney and M. R. Boyd, J. Natl. Cancer Inst., 1990, 82, 1107 CrossRef CAS.
- R. M. Allam, A. M. Al-Abd, A. Khedr, O. A. Sharaf, S. M. Nofal, A. E. Khalifa, H. A. Mosli and A. B. Abdel-Naim, Toxicol. Lett., 2018, 291, 77 CrossRef CAS.
- B. S. Mohammed, A. E. Hamad and S. M. Derayea, RSC Adv., 2020, 10, 21100–21107 RSC.
- A. Greenberg and T. D. DuBois, J. Mol. Struct., 2001, 567, 303–317 CrossRef.
- P. C. Astles, S. V. Mortlock and E. J. Thomas, Heteroat. Manip., 1991 Search PubMed.
- W. B. Jennings, Chem. Rev., 1975, 75, 307–322 CrossRef CAS.
- X. Xiaoyang, G. M. Edward, G. Paul and R. David, J. Med. Chem., 2004, 47, 4463–4470 CrossRef.
- BIOVIA, QSAR, ADMET and Predictive Toxicology, May 2020, https://www.3dsbiovia.com/products/collaborative-science/biovia-discovery-studio/qsar-admet-and-predictive-toxicology.html Search PubMed.
- M. Hewitt and K. Przybylak, In Silico Methods for Predicting Drug Toxicity, Springer, 2016, pp. 201–236 Search PubMed.
- C. Heidelberger, Annu. Rev. Biochem., 1975, 44, 79–121 CrossRef CAS.
- R. Venkatapathy, C. Y. Wang, R. M. Bruce and C. Moudgal, Toxicol. Appl. Pharmacol., 2009, 234, 209–221 CrossRef CAS.
- A. Thresher, J. P. Gosling and R. Williams, Toxicol. Res., 2019, 8, 696–703 CrossRef CAS.
- J. Louisse, S. Bosgra, B. J. Blaauboer, I. M. Rietjens and M. Verwei, Arch. Toxicol., 2015, 89, 1135–1148 CrossRef CAS.
- EPA, Guidelines for Developmental Toxicity Risk Assessment, May 2020, https://www.epa.gov/sites/production/files/2014-11/documents/dev_tox.pdf Search PubMed.
- G. Goodrnan and R. Wilson, Risk Anal., 1992, 12, 525–533 CrossRef.
- N. R. Council, Correlation Between Carcinogenic Potency and the Maximum Tolerated Dose: Implications for Risk Assessment, in Issues in Risk Assessment, National Academies Press, US, 1993 Search PubMed.
- R. G. Diaza, S. Manganelli, A. Esposito, A. Roncaglioni, A. Manganaro and E. Benfenati, SAR QSAR Environ. Res., 2015, 26, 1–27 CrossRef CAS.
- R. Venkatapathy, C. J. Moudgal and R. M. Bruce, J. Chem. Inf. Comput. Sci., 2004, 44, 1623–1629 CrossRef CAS.
Footnote |
| † Electronic supplementary information (ESI) available. See DOI: 10.1039/d0ra09253c |
| This journal is © The Royal Society of Chemistry 2020 |


