 Open Access Article
Pre-oxidization-induced change of physicochemical characteristics and removal behaviours in conventional drinking water treatment processes for polyethylene microplastics†
Yu Shaoa,
Xinhong Zhoua,
Xiaowei Liu *ab and
Lili Wangc
aZhejiang Key Laboratory of Drinking Water Safety and Distribution Technology, College of Civil Engineering and Architecture, Zhejiang University, Hangzhou 310058, China. E-mail: liuxiaowei@zju.edu.cn
bInstitute of Coastal and Offshore Engineering, Zhejiang University, Zhoushan 316000, China
cDepartment of Biological and Environmental Engineering, Jiyang College of Zhejiang A&F University, Zhuji 311800, China. E-mail: liliwang@zafu.edu.cn
First published on 14th November 2020
Abstract
Microplastics (MPs), as emerging pollutants, have attracted worldwide attention due to their ecological and biological toxicity. As microplastics have been detected frequently in drinking water, it is essential to evaluate the physicochemical property change and removal behaviors of MPs in drinking water treatment processes. This study selected polyethylene microplastics (PE-MPs) as the representative, and investigated the variations in its physicochemical characteristics after oxidizing by several conventional pre-oxidants (potassium permanganate, sodium hypochlorite, and ozone). Furthermore, coagulation, sedimentation, and filtration experiments were conducted to verify whether pre-oxidization influenced the removal of microplastics. The results indicate that pre-oxidization indeed changed the hydrophobicity, specific surface area, and functional groups of PE-MPs surface exposing to water phase. These changes affected the adsorption of trace pollutants with different hydrophobicity (acesulfame, carbamazepine, and nitrobenzene). However, such changes showed a subtle effect on the removal of PE MPs by coagulation–sedimentation–filtration processes. Current findings suggest that pre-oxidization may increase the risk of pathogenic microorganisms due to the increasing oxidization-induced shelter ability of MPs towards microorganisms.
Introduction
In recent years, microplastics (MPs) have attracted widespread attention as one kind of emerging pollutant. MPs usually refers to plastic particles with a size of less than 5 mm.1 They often derive from personal care products, sandblasting media, abrasive particles, resin particles, exfoliants of synthetic fibers, and decomposition of large plastic products.2–4 The aquatic environment is one of the major reservoirs that MPs converge.5 So far, MPs have been detected in oceans,5,6 lakes,7,8 rivers,9 and even tap water and bottled water.10,11 MPs can exist in water for thousands of years due to their chemical stability.12 Environmental and health problems caused by MPs in the aquatic environment include: (1) due to their high surface area and strong hydrophobicity, MPs are excellent carriers for hazardous pollutants such as polycyclic aromatic hydrocarbons;13 (2) complexing with heavy metal ion/oxide through π–π interaction or absorbing heavy metal ion/oxide via electrostatic interaction;14–16 (3) impeding the propagation of light under water, which can be detrimental to the growth of aquatic organisms;17 (4) being ingested by aquatic organisms because of their small particle size, which results in mechanical damage to the body. What we should most care about is that MPs can be eventually passed to human bodies through the biological chain.18The detection of MPs in the finished water of drinking water treatment plants (DWTPs) and tap waters prompted researchers to evaluate the effectiveness and mechanism of MPs removal under existing processes in DWTPs. Ma et al. found that the traditional coagulation–settlement processes using aluminum salt as coagulants (less than 20 mg L−1 in terms of aluminum) showed an unsatisfactory removal efficiency on polyethylene (PE) MPs (d < 0.5 mm) (8.3 ± 1.1%).19 They presented a perspective that coagulation–settlement processes poorly removed MPs due to the inefficient capture of MPs (especially large-size MPs) by aluminum salt or iron salt flocs, which explained the insensitivity of MPs removal to changes in water quality conditions (e.g., ionic strength, turbidity, the concentration of natural organic matters (NOM)). Pivokonsky et al. researched on three different water treatment processes (coagulation-quartz sand filtration, coagulation–sedimentation–quartz sand filtration-activated carbon adsorption, coagulation–air flotation–quartz sand filtration-activated carbon adsorption) for MPs (d > 1 μm) removal.20 The average removal rate of MPs was found to be 70–83%, and the specific removal rate was significantly correlated with the shape of MPs. For example, compared to the overall higher average removal rate, the removal rate of fibrous MPs was about 25%. Obviously, the efficiency of MPs removal in water treatment plants relates to not only the treatment process, but also the MPs' physicochemical characteristics (surface characteristics, particle size, physical shape, etc.). As a pre-treatment technology for raw water, pre-oxidization technology is often used to oxidize and decompose pollutants in water, aiming to weaken the adverse effects of pollutants on conventional processes and enhance their purification efficiency.21,22 After MPs contact and react with the pre-oxidant in the pre-oxidization process, the surface physical and chemical characteristics of MPs (e.g. the ability to adsorb organic matter, pore structure, specific surface areas, functional groups) may change. Whether such change will influence the removal behaviours of MPs in the subsequent treatment processes of DWTPs is unclear and thus research is necessary.
PE MPs, which account for the largest proportion of all plastics in production and use, exhibit the most extensive distribution, and have the closest density to water,23,24 were selected as research objects in this work. Efforts were firstly put into examining the variations in physical and chemical characteristics of PE MPs' surface (surface morphology, specific surface area, hydrophobicity, and functional groups) after oxidization by several common pre-oxidant (permanganate (PM), hypochlorite (CL), ozone (O3)). Then, the removal behaviours of oxidized PE MPs in the conventional drinking water treatment processes (coagulation–sedimentation–filtration) were investigated.
Material and methods
Materials and reagents
PE plastic particles (50 mesh, 250–300 μm) were purchased from China United Plastics Co., Ltd. (Dongguan, China); acesulfame potassium (ACE) and carbamazepine (CBZ) were ordered from Sigma-Aldrich (Shanghai, China); sodium hypochlorite (NaClO) and corrosion acid were obtained from Aladdin Reagent Co., Ltd. (Shanghai, China); nitrobenzene (NB), potassium permanganate (KMnO4), kaolin, humic acid (HA), ammonium acetate, and phosphoric acid were provided by Sinopharm Chemical Reagent Co., Ltd. (Shanghai, China); O3 was prepared on-site by a Guolin ozone generator (Qingdao, China); the ultrapure water used in the experiment was prepared using a SMART-N pure water machine.Pre-treatment of microplastic samples
Before use, the commercial PE plastic particles were treated according to the method previously reported used.19 Raw PE plastic particles were soaked in deionized water for 24 h and then in 1 mM hydrochloric acid solution for 24 h to clean up the organic matter and other substances on the surface. Afterwards, they were washed with deionized water, alcohol, and deionized water in turn, and subjected to vacuum-drying at 60 °C for 24 h. These cleaned PE plastic particles were labelled as 1# series (PE1, Table 1). Since NOM is ubiquitous in natural waters with concentrations much higher than trace organic pollutants, preloading MPs with NOM can give more realistic insights on the sorption behaviour of MPs. Hence, the cleaned PE plastic particles (8 g) were impregnated in 250 mL solution with 8 mg L−1 humic acid (used as representative of NOM), 20 NTU turbidity, and 10 mM NaCl for 12 h with stirring (600 rpm). Then the NOM-loading particles were recovered from impregnating solution by vacuum filtration (0.45 μm membrane). When there was no water visible to the naked eye, the vacuum filtration continued to run for 10 min to minimize the water residual on the particle surface. Finally, vacuum-drying (60 °C, 12 h) was applied. 36.2% humic acid was confirmed to load onto MPs through determining the concentration change of total organic carbon in impregnating solution (Fig. 1S in ESI†). These PE plastic particles were labelled as 2# series (PE2, Table 1). The control groups of PE1 and PE2 were labelled as PE1,CB and PE2,CB respectively. Groups of PE1 and PE2, treated with pre-oxidant ([oxidant]0 = 2 mg L−1, reaction time 30 min) were defined as Table 1. The dose and contact time for pre-oxidant were set based on the values recommended by standard for water works of China (dose 0.5–2.5 mg L−1, contact time 5–30 min).25 All NOM-preloading PE plastic particles and pre-oxidized PE plastic particles were freshly prepared before use. Once pre-oxidization treatment was finished, the PE plastic particles were separated from oxidant solution by vacuum filtration and quickly transferred to beakers for coagulation–sedimentation experiments.| Control group (W/O oxidization) | PM oxidization | CL oxidization | O3 oxidization | |
|---|---|---|---|---|
| a Note: PM = KMnO4; CL = NaClO. | ||||
| PE1 | PE1,CB | PE1,PM | PE1,CL | PE1,O3 |
| PE2 | PE2,CB | PE2,PM | PE2,CL | PE2,O3 |
Adsorption experiments
This experiment prepared three groups of solutions for 1 mg L−1 of ACE, CBZ, NB (each for 40 mL), and adjusted the pH value to 7.0 ± 0.2 using HCl and NaOH, and then added 5 g L−1 of different types microplastic particles to each of the three groups of solutions. To measure the equilibrium adsorption capacity (qe) of PE1,CB and other microplastic particles in each solution of ACE, CBZ and NB, the mixed solution was then placed in a constant temperature shaker (25 °C, 175 rpm), and sampled regularly. Determination of qe was conducted in reference to our previous research work.26 The quantitation of ACE, CBZ, and NB referred to reported methods.27–29 Each experiment was repeated three times.Coagulation–sedimentation–filtration experiment
Simulated raw water (20 ± 2 °C, pH = 7.0 ± 0.2, 20 NTU) composed of natural organic matters (amino acid, salicylic acid and humic acid), kaolin, and sodium bicarbonate buffer was prepared firstly. Then 2.5 g PE particles were added to 500 mL simulation raw water and stirred for 12 hours. Subsequently, 15 mg polyaluminum chloride (PAC) was dosed for coagulation–sedimentation experiment. The specific coagulation and sedimentation conditions were as follow: rapid stirring at 300 rpm for 1 min, slow stirring at 100 rpm for 14 min and sedimentation for 30 min. Then the supernatant was pumped into a sand filter column with a filtration rate 9 m h−1 (corresponding to an empty bed contact time (EBCT) 5 min). The remaining MPs in the solution were separated using 0.45 μm filter membrane. Then, the residuals (i.e., flocs) on the surface of MPs were removed using 1 M HCl. The MPs on the membrane surface (0.45 μm) were carefully scraped off, followed by vacuum drying (60 °C, 12 h) and weighing. Namely, the mass reduction of MPs was the amount of removal.Analysis
The concentrations of probe compounds (ACE, CBZ, and NB) were determined by an Agilent 1200 high performance liquid chromatograph equipped with a Zorbax Eclipse XDB-C18 column (150 × 4.6 mm, 3.5 μm). The mobile phase used for ACE separation is 0.02 M ammonium acetate/methanol (90![[thin space (1/6-em)]](https://www.rsc.org/images/entities/char_2009.gif) :
:![[thin space (1/6-em)]](https://www.rsc.org/images/entities/char_2009.gif) 10, v/v). For CBZ, the mobile phase was 1‰ phosphoric acid/methanol (35
10, v/v). For CBZ, the mobile phase was 1‰ phosphoric acid/methanol (35![[thin space (1/6-em)]](https://www.rsc.org/images/entities/char_2009.gif) :
:![[thin space (1/6-em)]](https://www.rsc.org/images/entities/char_2009.gif) 65, v/v). For NB, the mobile phase was 1‰ phosphoric acid/methanol (10
65, v/v). For NB, the mobile phase was 1‰ phosphoric acid/methanol (10![[thin space (1/6-em)]](https://www.rsc.org/images/entities/char_2009.gif) :
:![[thin space (1/6-em)]](https://www.rsc.org/images/entities/char_2009.gif) 90, v/v). The flow rate was set at 1 mL min−1 for all three compounds. The detection wavelengths of ACE, CBZ, and NB were 230 nm, 254 nm, and 268 nm, respectively. The TOC of HA-impregnating solution was determined via a Shimadzu TOC analyzer.
90, v/v). The flow rate was set at 1 mL min−1 for all three compounds. The detection wavelengths of ACE, CBZ, and NB were 230 nm, 254 nm, and 268 nm, respectively. The TOC of HA-impregnating solution was determined via a Shimadzu TOC analyzer.
Characterization of PE MPs
The changes induced by pre-oxidization in surface morphology of PE MPs was analyzed by a Quanta FEG 650 field emission environmental scanning electron microscope (SEM) with varying magnifications. Operating conditions were: accelerating voltage 10–15 kV, probe current 80 μA, and working distance 10.0–15.0 mm. Brunauer–Emmett–Teller (BET) surface area variation was examined using a Micromeritics 3Flex specific surface and porosity analyzer (N2 adsorption, 75 K). To find out how the hydrophobicity changes after pre-oxidization, the contact angles of PE MPs were measured using a Powereach JC2000D1 contact angle measuring instrument. Raman spectroscopy (WITec Alpha300R, 532 nm laser, Raman shift 50–3500 cm−1) was applied to monitor the surface chemical structure of PE MPs before and after pre-oxidization. All samples were dried under vacuum (60 °C, 12 h) before characterization.Results and discussion
Influence of pre-oxidization on microplastic adsorption for trace organic matters
Three organic matters ACE (log![[thin space (1/6-em)]](https://www.rsc.org/images/entities/char_2009.gif) kow = −1.3
kow = −1.3![[thin space (1/6-em)]](https://www.rsc.org/images/entities/char_2009.gif) 30), NB (log
30), NB (log![[thin space (1/6-em)]](https://www.rsc.org/images/entities/char_2009.gif) kow = 1.9
kow = 1.9![[thin space (1/6-em)]](https://www.rsc.org/images/entities/char_2009.gif) 31) and CBZ (log
31) and CBZ (log![[thin space (1/6-em)]](https://www.rsc.org/images/entities/char_2009.gif) kow = 2.5
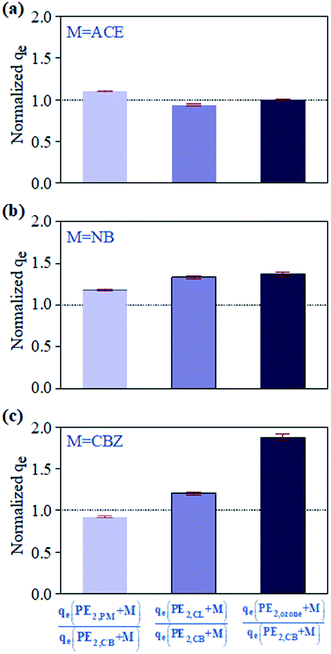
kow = 2.5![[thin space (1/6-em)]](https://www.rsc.org/images/entities/char_2009.gif) 32) with different polarities were used as probe compounds, and the influence of pre-oxidization on MP absorption performance for trace organic matters was investigated by testing the changes in qe of the three probe compounds before and after pre-oxidization treatment. PE1,CB and PE2,CB formed the control group. As shown in Fig. 1, the qes of the control group PE1,CB for ACE, NB, and CBZ were 0.8, 13.2, and 10.7 μg g−1, respectively, and the corresponding qes of the control group PE2,CB were 3.4, 11.9, and 4.8 μg g−1. Therefore, the influence of NOM adhered to the surface of PE plastic on probe compounds' adsorption could not be neglected. Adhering NOM generally facilitated the adsorption of polar organic matters (ACE) and repressed the adsorption of organic matters with medium or low polarity (NB or CBZ). The ratios of qe after treatments with different pre-treatment processes to the qe of the control group PE2,CB (normalized qe) are shown in Fig. 2. PM pre-oxidization, CL pre-oxidization, and O3 pre-oxidization inhibited the ACE adsorption by PE2,CB (normalized qe was 0.9–1.1), but the PE2,CB adsorption for NB (1.2–1.4) and CBZ (0.9–1.9) was enhanced. The promotion effect was positively correlated with the oxidizing ability of the oxidizer (E(PM) = 1.5 V, E(CL) = 1.6 V, E(O3) = 2.1 V). This phenomenon might be ascribed to oxidization-induced destroy of NOM coating on MP surface. The PE MP surface was hydrophobic, and its surface hydrophobicity was changed due to the adsorption of natural organic matters on the surface. This finding was proven by the higher adsorption rate of PE2,CB for ACE than PE1,CB, as shown in Fig. 1. More hydrophobic surfaces were exposed due to oxidization (namely, the hydrophobicity was strengthened). Hence, the adsorption of organic matters with weak polarity or medium polarity is increased. This indicated that, besides VDW force,33,34 hydrophobic action was involved in the process of probe compound adsorption on PE MP surface. That is, the stronger the oxidization power of oxidant is, the greater the damage of organic coating is and the more evident facilitating effect on the adsorption of organic matters with weak or medium polarity (Fig. 2b and c).
32) with different polarities were used as probe compounds, and the influence of pre-oxidization on MP absorption performance for trace organic matters was investigated by testing the changes in qe of the three probe compounds before and after pre-oxidization treatment. PE1,CB and PE2,CB formed the control group. As shown in Fig. 1, the qes of the control group PE1,CB for ACE, NB, and CBZ were 0.8, 13.2, and 10.7 μg g−1, respectively, and the corresponding qes of the control group PE2,CB were 3.4, 11.9, and 4.8 μg g−1. Therefore, the influence of NOM adhered to the surface of PE plastic on probe compounds' adsorption could not be neglected. Adhering NOM generally facilitated the adsorption of polar organic matters (ACE) and repressed the adsorption of organic matters with medium or low polarity (NB or CBZ). The ratios of qe after treatments with different pre-treatment processes to the qe of the control group PE2,CB (normalized qe) are shown in Fig. 2. PM pre-oxidization, CL pre-oxidization, and O3 pre-oxidization inhibited the ACE adsorption by PE2,CB (normalized qe was 0.9–1.1), but the PE2,CB adsorption for NB (1.2–1.4) and CBZ (0.9–1.9) was enhanced. The promotion effect was positively correlated with the oxidizing ability of the oxidizer (E(PM) = 1.5 V, E(CL) = 1.6 V, E(O3) = 2.1 V). This phenomenon might be ascribed to oxidization-induced destroy of NOM coating on MP surface. The PE MP surface was hydrophobic, and its surface hydrophobicity was changed due to the adsorption of natural organic matters on the surface. This finding was proven by the higher adsorption rate of PE2,CB for ACE than PE1,CB, as shown in Fig. 1. More hydrophobic surfaces were exposed due to oxidization (namely, the hydrophobicity was strengthened). Hence, the adsorption of organic matters with weak polarity or medium polarity is increased. This indicated that, besides VDW force,33,34 hydrophobic action was involved in the process of probe compound adsorption on PE MP surface. That is, the stronger the oxidization power of oxidant is, the greater the damage of organic coating is and the more evident facilitating effect on the adsorption of organic matters with weak or medium polarity (Fig. 2b and c).
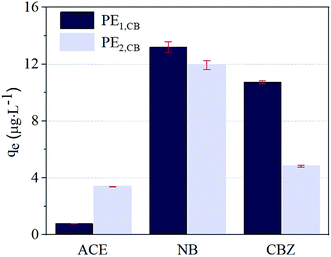 | ||
| Fig. 1 Equilibrium adsorption capacity (qe) of PE1,CB and PE2,CB towards ACE, NB, and CBZ. Experimental conditions: PE MP dosage 5 g L−1, pH = 7.0, 25 °C. | ||
To further verify the influence of pre-oxidization treatment on surface hydrophobicity of PE plastic, the contact angles of PE1,CB and that of PE2,CB after the pre-oxidization treatment were determined (Table 2). The results showed that the contact angle of PE1,CB was reduced from 132.1° to 125.8° after adsorbing NOM (corresponding to PE2,CB), namely, the hydrophobicity was weakened. The contact angles of PE2,CB presented a declining trend (<125.0°) after reacting with PM, CL, and O3 (PE2,PM, PE2,CL, and PE2,O3), and they were sorted in a descending order as PE2,PM < PE2,CL < PE2,O3. This finding verified that oxidization did change the hydrophobicity of PE2,CB. However, the weakening hydrophobicity after oxidization contradicted with the adsorption capacity for organic matters with weak polarity or medium polarity. Therefore, the change in MP adsorbing capacity for trace organic matters after pre-oxidization was not only related to the change in surface hydrophobicity.
| Sample | BET (m2 g−1) | Contact angle |
|---|---|---|
| PE2,CB | 0.014 ± 0.005 | 125.8 ± 0.8 |
| PE2,PM | 0.935 ± 0.5 | 106.9 ± 1.0 |
| PE2,CL | 0.732 ± 0.4 | 121.4 ± 4.8 |
| PE2,O3 | 1.099 ± 0.4 | 124.9 ± 1.6 |
Influence of pre-oxidization on surface microstructure of PE MPs
Table 2 lists the specific surface area data of the control group (PE2,CB) and that after the oxidization treatment. The specific surface area of PE2,CB was increased from 0.014 m2 g−1 to >0.7 m2 g−1 due to oxidization. The enlargement of specific surface area caused by the oxidization of the three oxidants followed an order of O3 > PM > CL. Interestingly, the redox potential of PM is the weakest, but PM oxidization received a more evident enlargement than CL oxidization. The change of the surface morphology of PE2,CB before and after oxidization was directly observed through scanning electron microscopy. As shown in Fig. 3, rough fibrous texture appeared on the original smooth surface of PE2,CB after the pre-oxidization treatment. The phenomenon was more evident after oxidization with PM and O3. In other words, oxidization led to increasing surface roughness and thus elevating specific surface area, which responded to increasing adsorbing capacity.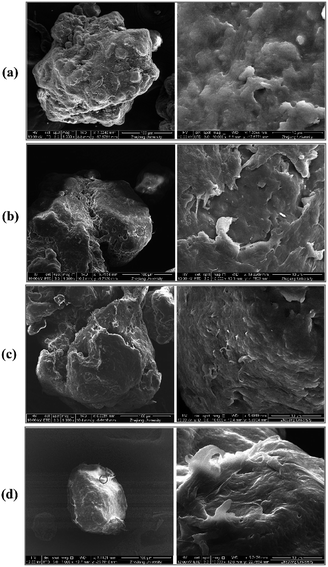 | ||
Fig. 3 SEM images of PE MPs (500 X and 10![[thin space (1/6-em)]](https://www.rsc.org/images/entities/char_2009.gif) 000 X): (a) PE2,CB particles; (b) PE2,CL particles; (c) PE2,PM particles; (d) PE2,O3 particles. 000 X): (a) PE2,CB particles; (b) PE2,CL particles; (c) PE2,PM particles; (d) PE2,O3 particles. | ||
Influence of pre-oxidization on functional groups on the microplastic surface
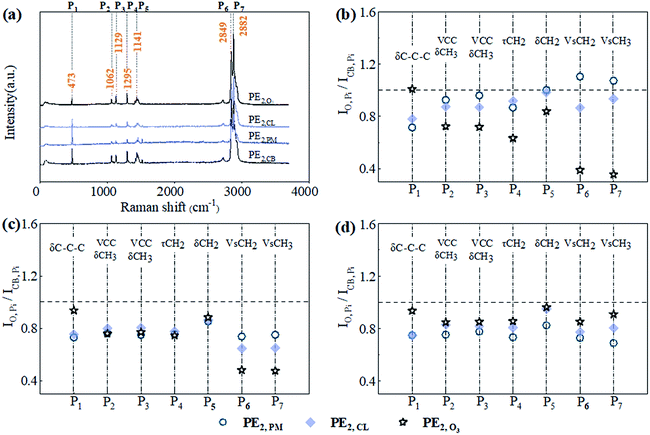
As to the surface roughening caused by oxidization, change in interfacial functional groups is believed to occur. This change was directly characterized by Raman spectrum. As shown in Fig. 4a, seven main vibration peaks appeared in the Raman spectrum of PE2,CB, namely, at 473 (P1), 1062 (P2), 1129 (P3), 1295 (P4), 1441 (P5), 2849 (P6), and 2882 cm−1 (P7). P1 was mainly caused by the symmetrical stretching vibration of C–C–C bond, P2 and P3 by C–C symmetrical vibration or C–H symmetrical stretching vibration, P4 by C–H in-plane torsion swinging, P5 by C–H asymmetrical bending deformation vibration, and P6 and P7 by different C–H symmetrical stretching vibrations.35 To better display the changes in the characteristic peaks, the peak intensity of PE2,CB absorbing different probe compound after oxidization treatment (IO,Pi, i = 1–7) was normalized with corresponding characteristic peaks intensity of PE2,CB without oxidization (ICB,Pi, i = 1–7) (Fig. 4b–d). After pre-oxidization, the intensities of nearly all characteristic peaks were weakened to different degrees (normalized intensity <1). P6 and P7, which were associated with C–H bond, were the most affected. Among the three pre-oxidization processes, O3 pre-oxidization exhibited the most evident weakening effect on seven characteristic peaks. This phenomenon was related to the indirect reactions of O3 pre-oxidization process (hydroxyl radical-involving reactions, Fig. 2S in ESI†), which were specified as addition to double bonds, H-abstraction reactions, and electron transfer reactions. Thus, the O3-induced most serious etching on the MP surface can be reasonably explained. The weakening effect of PM oxidization was equivalent to that of CL oxidization. The reaction mechanisms of CL with organic matters included oxidization, addition, and electrophilic substitution, where the last reaction pathway usually played a dominant role.36 PM reacted with organic matters by a similar mechanism to that of hydroxyl radical. The dehydrogenation reaction between the three oxidizers and MP samples could be the reason for the significant intensity changes of P6 and P7, and the differences among the three oxidizers were ascribed to their different hydrogenation activities.Influence of pre-oxidization on the PE MP removal by coagulation–sedimentation–filtration processes
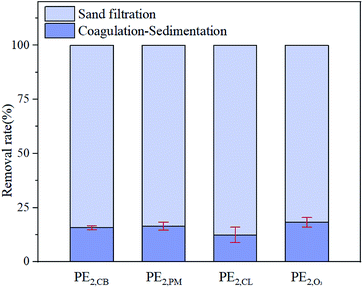
The results discussed above indicate that the pre-oxidization treatment indeed impacted the physiochemical properties of MP surface. Whether this impact would influence the MP removal in the subsequent treatment processes remained unknown and therefore was tested. The experimental results are shown in Fig. 5. The removal rates of 30 mg L−1 PAC for four microplastic particles, PE2,CB, PE2,PM, PE2,CL, and PE2,O3, were 15.8 ± 0.9%, 16.4 ± 1.9%, 12.5 ± 3.5% and 18.2 ± 2.2%, respectively. Further treatment with sand filter resulted in 100% removal. Therefore, the pre-oxidization treatment almost had no influence on MP removal through coagulation–sedimentation–filtration processes. The result was consistent with that obtained by Ma et al., who believed that the main factors influencing the MP removal efficiency by coagulation–sedimentation processes were MP shape and floc characteristics.19 Net sweeping was the main removal mechanism, and the effects of compressive double electrode layers and adsorption-charge neutralization were not apparent. Given the weak adsorption of PE MPs (data was not shown), pore sieving action was considered to contribute the removal of PE MPs by sand filtration.Conclusions
This study revealed how the pre-oxidization by hypochlorite, permanganate, and ozone as a pre-treatment step before conventional drinking water treatment (coagulation–sedimentation–filtration) changed the physiochemical properties of NOM-preloading PE MPs and their removal behaviour. The results showed that pre-oxidization altered PE MPs' adsorbing capacity for trace organic matters, surface contact angle (hydrophobicity), micromorphology, and interfacial functional groups. However, these changes did not influence the removal of PE MPs by conventional drinking water treatment processes. On the one hand, the pre-oxidization-induced damage to NOM coating of PE MPs caused the increase of hydrophobicity. The hydrophobic action is one of forces driving the adsorption of trace organic matters. On the other hand, the enlarged specific surface area deriving from micromorphology adjustment favored the adsorption of trace organic matters. It was the essential embodiment of micromorphology change that interfacial functional groups were oxidized. Because the changes of physicochemical characteristics for PE MPs did not affect the net-sweeping effect of flocs in the coagulation process and pore sieving effect of sand media in the filtration process, removal of PE MPs by conventional drinking water treatment processes was observed to be unsensitive to these changes.Considering the variety of MPs in material and size, further study involving more kinds of material and wider size range should be conducted. In addition, given that the filtration process contributed the most among the conventional drinking water treatment processes, efforts should be also directed towards how to optimize or strengthen the filtration process, to make the interception of MPs more efficient.
Conflicts of interest
There are no conflicts to declare.Acknowledgements
This research is funded by the National Science and Technology Major Projects for Water Pollution Control and Treatment (No. 2017ZX07201-003), the Science and Technology Program of Zhejiang Province (No. LQ19E080023), and the Zhejiang Public Welfare Technology Research Program (No. LGG21E080021).Notes and references
- A. J. Kokalj, P. Horvat, T. Skalar and A. Krzan, Sci. Total Environ., 2018, 615, 761–766 CrossRef.
- V. Zitko and M. Hanlon, Mar. Pollut. Bull., 1991, 22, 41–42 CrossRef.
- L. S. Fendall and M. A. Sewell, Mar. Pollut. Bull., 2009, 58, 1225–1228 CrossRef CAS.
- J. Y. Li, H. H. Liu and J. P. Chen, Water Res., 2018, 137, 362–374 CrossRef CAS.
- A. L. Lusher, A. Burke, I. O'Connor and R. Officer, Mar. Pollut. Bull., 2014, 88, 325–333 CrossRef CAS.
- J.-P. W. Desforges, M. Galbraith, N. Dangerfield and P. S. Ross, Mar. Pollut. Bull., 2014, 79, 94–99 CrossRef CAS.
- M. Eriksen, S. Mason, S. Wilson, C. Box, A. Zellers, W. Edwards, H. Farley and S. Amato, Mar. Pollut. Bull., 2013, 77, 177–182 CrossRef CAS.
- C. M. Free, O. P. Jensen, S. A. Mason, M. Eriksen, N. J. Williamson and B. Boldgiv, Mar. Pollut. Bull., 2014, 85, 156–163 CrossRef CAS.
- D. Morritt, P. V. Stefanoudis, D. Pearce, O. A. Crimmen and P. F. Clark, Mar. Pollut. Bull., 2014, 78, 196–200 CrossRef CAS.
- S. M. Mintenig, M. G. J. Loeder, S. Primpke and G. Gerdts, Sci. Total Environ., 2019, 648, 631–635 CrossRef CAS.
- D. Schymanski, C. Goldbeck, H. U. Humpf and P. Fuerst, Water Res., 2018, 129, 154–162 CrossRef CAS.
- A. Cozar, F. Echevarria, J. Ignacio Gonzalez-Gordillo, X. Irigoien, B. Ubeda, S. Hernandez-Leon, A. T. Palma, S. Navarro, J. Garcia-de-Lomas, A. Ruiz, M. L. Fernandez-de-Puelles and C. M. Duarte, Proc. Natl. Acad. Sci. U. S. A., 2014, 111, 10239–10244 CrossRef CAS.
- K. Mizukawa, H. Takada, M. Ito, Y. B. Geok, J. Hosoda, R. Yamashita, M. Saha, S. Suzuki, C. Miguez, J. Frias, J. C. Antunes, P. Sobral, I. Santos, C. Micaelo and A. M. Ferreira, Mar. Pollut. Bull., 2013, 70, 296–302 CrossRef CAS.
- K. Ashton, L. Holmes and A. Turner, Mar. Pollut. Bull., 2010, 60, 2050–2055 CrossRef CAS.
- E. Fries, J. H. Dekiff, J. Willmeyer, M.-T. Nuelle, M. Ebert and D. Remy, Environ. Sci.: Processes Impacts, 2013, 15, 1949–1956 RSC.
- Y. Zhou, Y. Yang, G. Liu, G. He and W. Liu, Water Res., 2020, 184, 116209 CrossRef CAS.
- J. Li, H. Liu and J. P. Chen, Water Res., 2018, 137, 362–374 CrossRef CAS.
- A. G. Anderson, J. Grose, S. Pahl, R. C. Thompson and K. J. Wyles, Mar. Pollut. Bull., 2016, 113, 454–460 CrossRef CAS.
- B. Ma, W. Xue, C. Hu, H. Liu, J. Qu and L. Li, Chem. Eng. J., 2019, 359, 159–167 CrossRef CAS.
- M. Pivokonsky, L. Cermakova, K. Novotna, P. Peer, T. Cajthaml and V. Janda, Sci. Total Environ., 2018, 643, 1644–1651 CrossRef CAS.
- V. Camel and A. Bermond, Water Res., 1998, 32, 3208–3222 CrossRef CAS.
- D. Y. Yan, Z. Sun, J. J. Wang, L. L. Wang, R. J. Pan, Q. Wu and X. W. Liu, Water, 2019, 11, 13 Search PubMed.
- A. L. Andrady, Mar. Pollut. Bull., 2011, 62, 1596–1605 CrossRef CAS.
- A. F. Herbort, M. T. Sturm and K. Schuhen, Environ. Sci. Pollut. Res., 2018, 25, 15226–15234 CrossRef CAS.
- Ministry of Housing and Urban-Rural Development of the People′s Republic of China, GB50013-2018 Standard for Design of Outdoor Water Supply Engineering, China Planning Press, 2018 Search PubMed.
- L. Wang, J. Yang, Z. Chen, X. Liu and F. Ma, Arch. Environ. Prot., 2013, 39, 129–140 CAS.
- W. Yang, Y. Wu, L. Zhang, J. Jiang and L. Feng, Desalin. Water Treat., 2015, 54, 1134–1140 CrossRef CAS.
- C. Chow and K. S.-Y. Leung, Chemosphere, 2019, 237, 647–655 CrossRef.
- H. Zeng, L. Lu, M. Liang, J. Liu and Y. Li, Front. Environ. Sci. Eng., 2012, 6, 477–483 CrossRef CAS.
- S. C. Moldoveanu and V. David, in Essentials in Modern HPLC Separations, ed. S. C. Moldoveanu and V. David, Elsevier, 2013, pp. 85–114, DOI:10.1016/b978-0-12-385013-3.00003-3.
- S. Moldoveanu and V. David, in Modern Sample Preparation for Chromatography, ed. S. Moldoveanu and V. David, Elsevier, Amsterdam, 2015, pp. 131–189, DOI:10.1016/b978-0-444-54319-6.00006-2.
- S. Amézqueta, X. Subirats, E. Fuguet, M. Rosés and C. Ràfols, in Liquid-Phase Extraction, ed. C. F. Poole, Elsevier, 2020, pp. 183–208, DOI:10.1016/b978-0-12-816911-7.00006-2.
- A. Gao, L. Tan, M. I. Chaudhari, D. Asthagiri, L. R. Pratt, S. B. Rempe and J. D. Weeks, J. Phys. Chem. B, 2018, 122, 6272–6276 CrossRef CAS.
- Y. Tang, X. Zhang, P. Choi, Z. Xu and Q. Liu, Langmuir, 2018, 34, 14196–14203 CrossRef CAS.
- K. A. Prokhorov, G. Y. Nikolaeva, E. A. Sagitova, P. P. Pashinin, M. A. Guseva, B. F. Shklyaruk and V. A. Gerasin, Laser Phys., 2018, 28, 045702 CrossRef.
- L. L. Wang and X. W. Liu, Processes, 2019, 7, 16 CrossRef.
Footnote |
| † Electronic supplementary information (ESI) available. See DOI: 10.1039/d0ra07953g |
| This journal is © The Royal Society of Chemistry 2020 |

