 Open Access Article
Paper-based electroanalytical devices for stripping analysis of lead and cadmium in children's shoes
Chen-Chen Zhu,
Ning Bao * and
Xiao-Lei Huo*
School of Public Health, Nantong University, Nantong, Jiangsu 226019, China. E-mail: ningbao@ntu.edu.cn; hxl362349@ntu.edu.cn
First published on 13th November 2020
Abstract
Children's shoes are potential sources of toxic heavy metals, especially for younger children. Electrochemical detection could be applied for effective stripping analysis of heavy metals (such as Cd and Pb). However, the substrates of working electrodes are still limited and it is not well known which property is critical. Herein ITO glass was used as the substrate and the working electrode was modified with carbon cement for stripping analysis of Cd and Pb. The electrochemical impedance spectra of the ITO modified electrodes suggested the connection between the resistance and the electrochemical responses of heavy metals in stripping analysis, depending on the dilution ratio of the carbon cement. After optimization, the ITO modified electrodes in paper-based analytical devices could be used to sensitively quantify Cd and Pb with the concentration ranging from 10 to 1000 ppb. The detection limit of Pb2+ could reach less than 1 ppb while that of Cd2+ could reach 5 ppb, depending on the pH value of the sample solution. The paper-based electroanalytical devices could be used to quantify the concentration of Cd and Pb in children's shoes. This study implied the impact of the electric conductivity of the electrode substrates on stripping analysis, which might help to find more materials for the fabrication of the working electrodes.
1. Introduction
Nowadays, heavy metals pollution has become one popular environmental issue because they are inevitable in more economic activities of human beings.1 Cadmium (Cd), lead (Pb), arsenic (As), and mercury (Hg), etc., are known as toxic heavy metals because they are non-threshold toxic even at lower concentrations. Humans can be exposed to heavy metals in air, soil, dust, water, and food sources through several routes, such as ingestion, inhalation, and dermal absorption from combustion, discharges, and manufacturing facilities.2,3 Compared with adults, children have higher basal metabolic rates and higher comparative uptakes of food. Children can be exposed to toxic heavy metals in various ways, such as breastfeeding, hand-to-mouth, object-to-mouth, and outdoor activities.4 Because it is necessary to add heavy metals in polymers, children's shoes could inevitably introduce toxic heavy metals, such as lead, cadmium, or arsenic. Since some parts of the children's shoes were made from polymers, they could potentially contact the child's skin, eyes, or even mouth, causing the heavy metals to migrate to potentially harm the children. The younger the children are, the more danger the heavy metals would induce. Therefore, it is of importance to screen heavy metals in children's shoes, especially, for younger children.Heavy metals can be detected using analytical techniques, such as inductively coupled plasma mass spectroscopy (ICP-MS),5,6 atomic absorption spectroscopy (AAS),7,8 inductively coupled plasma-optical emission spectrometry (ICP-OES),9 neutron activation analysis (NAA),10 or X-ray Fluorescence Spectrometry (XRF),11 ion imprinting technology,12,13 colorimetric detection,14 etc. Although these methods show high sensitivity and low detection limits, the instruments are expensive and bulky. It is also necessary for skilled operators to perform sample treatments and detection.15 As a result, more investigation is still needed to develop simple, fast, reliable, and low-cost techniques for heavy metal detection. Electrochemical detection offers a suitable way for qualitative and quantitative detection of heavy metals based on stripping analysis.16 By combining with paper-based analytical devices, electrochemical detection could be extensively applied for rapid and in-field detections with improved portability.17 The working electrodes directly determine the efficiency of stripping analysis. Carbon (such as glassy carbon) and noble metals (such as gold) have been modified with the film of mercury or bismuth for detection of heavy metals.18–20 Because mercury is very harmful to human beings, the bismuth film was extensively used in stripping analysis due to its low toxicity. The modification of nanomaterials could dramatically enhance the analytical performance of stripping analysis.21,22 However, the substrates of working electrodes are still limited. More specifically, it is still unknown which property is of importance for the substrate to fabricate working electrodes for stripping analysis.
Previously, we have utilized double-sided conductive carbon tape as the substrate to fabricate the working electrodes for stripping analysis in paper-based analytical devices.17,23 It was found that the coating of gold could enhance the stripping analysis by increasing the conductivity. More recently, stainless steel sheets were used as the substrate of the working electrodes and modified with carbon cement for rapid screening of Pb and Cd in toys.24 Our results implied the critical role of the conductivity of the substrate is in stripping analysis. In this paper, the ITO glass was used as the substrate of the working electrodes and coated with carbon cement because of its excellent conductivity. The influences of the dilution ratio of the carbon cement on the resistance and performances of the ITO modified electrodes were systematically investigated in paper-based analytical devices. Based on in situ bismuth film,25,26 our device could be used for sensitive stripping analysis of Cd and Pb in children's shoes. This study suggested the critical roles of the substrate conductivity of the working electrodes on stripping analysis of the heavy metals.
2. Materials and methods
2.1 Chemicals and materials
CdCl2·2.5H2O was purchased from Shanghai Jinshantingxin Chemical Reagent Co. Ltd. (Shanghai, China). Pb(NO3)2 and Cu(NO3)2·3H2O were purchased from Shanghai Runjie Chemical Reagent Co. Ltd. (Shanghai, China). The indium tin oxide (ITO) conductive glass (1.1 mm thick and 10 ohms) was bought from Nanbo Display Technology Co. LTD (Shenzhen, Guangdong, China). The copper extractant M5640 was obtained from Zeneca Group PLC (London, United Kingdom). The conductive carbon cement (containing elements of C, H, and O) and its dilution solution were from Plano GmbH (Wetzlar, German). HAc and NaAc for preparation of the HAc/NaAc buffer solution were purchased from Guangdong Xiyi Chemical Co., Ltd. (Shantou, China). 10 mmol L−1 potassium ferricyanide (K3[Fe(CN)6]), 10 mmol L−1 potassium ferrocyanide (K4[Fe(CN)6]), and 0.1 mol L−1 KCl for electrochemical impedance spectroscopy (EIS) measurements were obtained from Shanghai Runjie Chemical Reagent Co. Ltd. (Shanghai, China). The No. 1 qualitative filter paper was from Whatman (Maidstone, United Kingdom). All chemicals are at the analytical grade and directly used without purification. The solutions should be carefully used because they are toxic. In all the experiments the double-distilled water was used.2.2 Fabrication of the paper-based electroanalytical devices
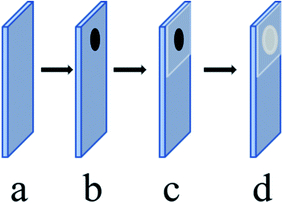
As shown in Scheme 1, the paper-based electroanalytical devices were fabricated with a similar approach in our previous reports.17,27 Briefly, the ITO glass was cut to be pieces with a length of 20 mm and a width of 8 mm before washed and dried. On the dried ITO glass pieces, diluted carbon cement (5 μL) with certain ratios was dropped and then dried at room temperature. In this case, the dilution ratio refers to the volume ratio of the carbon cement and the dilution solution. A piece of plastic tape with a 4 mm hole was covered on the coated carbon cement to provide an effective detection area. A circle piece of filter paper with a diameter of 6 mm was covered in the detection area. It needs to be emphasized that the application of filter paper could dramatically decrease the required volume of the sample solution. An Ag/AgCl wire (the reference electrode) and a platinum wire (the counter electrode) attached to a clip were attached to the filter paper to form the paper-based electroanalytical device.2.3 Sample preparation
The children's shoes from an internet store were treated according to the national safety technical regulation for children's shoes of China (GB25036-2010).28 The shoes were cut into small pieces with a weight of 0.5 g and then mixed with 8 mL 2 mol L−1 HNO3 and 2 mL H2O2. The mixture was performed at 150 oscillations per minute in the water at the temperature of 80 °C bath for 6 h. The solution was then heated on a heating plate at 200 °C for complete evaporation to remove the acid. It needs to be emphasized that our purpose is to quantify migration amounts of Pb and Cd in children's shoes. Before detection, the acetic acid solution (0.1 mol L−1, pH = 5.0) was filled until the volume reached 5 mL.2.4 Instruments
In our experiments, two electrochemical working stations (CHI1230B and CHI660D, CH Instrumentation, Shanghai, China) were used. The square wave voltammetry (SWV) was performed on CHI1230B with the initial potential of −1.2 V, the final potential of 0 V, the increased potential of 4 mV, the amplitude of 25 mV, frequency of 15 Hz, the quite time of 30 s, the pulse width of 0.036 s, pulse period of 0.3 s and the quite time of 30 s. The cyclic voltammetry (CV) was performed with the scanning potential of −0.2 to 0.6 V, the scan rate of 0.1 V s−1. The electrochemical impedance spectroscopy (EIS) was performed on CHI660D with the initial potential of 0.2 V, the frequency range was 1–100000 Hz and amplitude of potential perturbation of 5 mV. Before each detection, the working electrode was replaced with a new one, and other electrodes were thoroughly cleaned with double distilled water.3. Results and discussion
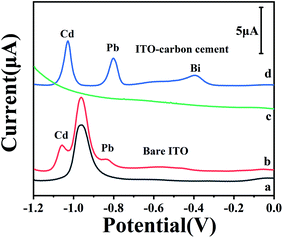
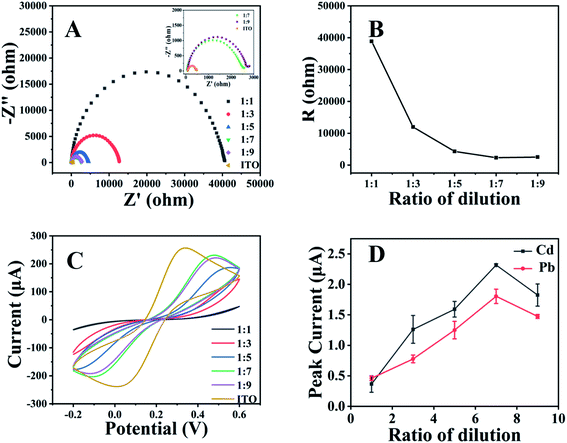
We recently reported the application of stainless steel sheets as the substrates of the working electrodes and observed their improved analytical performance in stripping analysis after their integration in paper-based analytical devices.24 As ITO glass is more popular and also electrically conductive, herein the ITO glass was used as the substrate to fabricate the working electrodes in paper-based analytical devices for stripping analysis of heavy metals. Fig. 1 shows electrochemical responses of native ITO electrode and carbon cement coated ITO electrode in HAc/NaAc buffer solution and in the solution of Cd2+ and Pb2+ with the concentration of 300 ppb, respectively. It could be found that the peaks of Cd2+ and Pb2+ were well defined and separated at baseline using the ITO electrode coated with carbon cement. With the native ITO electrode, it could be found that a large background peak appeared at the potential of −0.98 V. This peak overlaps with the peaks of Cd2+ and Pb2+. This peak might be attributed to the fact that the main phase of ITO, In1.88Sn0.12O3, could be reduced to the metal phase (Sn) under a negative potential.29 Thus, the ITO modified electrodes modified with carbon cement are used for stripping analysis of Cd2+ and Pb2+ in our following investigations.Fig. 2 illustrates the impacts of the dilution ratios of the carbon cement on the electrochemical characterization of the ITO modified electrodes. The electrochemical impedance spectra (Fig. 2A and B) show that the electric resistance part decreased with the dilution ration changed from 1![[thin space (1/6-em)]](https://www.rsc.org/images/entities/char_2009.gif) :
:![[thin space (1/6-em)]](https://www.rsc.org/images/entities/char_2009.gif) 1 to 1
1 to 1![[thin space (1/6-em)]](https://www.rsc.org/images/entities/char_2009.gif) :
:![[thin space (1/6-em)]](https://www.rsc.org/images/entities/char_2009.gif) 9. The decreased electric resistance might be ascribed to the thinner layer of carbon cement brought by the dilution.30,31 Fig. 2C shows that the influences of the dilution ratio of carbon cement on the cycle voltammetry curves at the ITO modified electrodes. It could be found that when the dilution ratio changed from 1
9. The decreased electric resistance might be ascribed to the thinner layer of carbon cement brought by the dilution.30,31 Fig. 2C shows that the influences of the dilution ratio of carbon cement on the cycle voltammetry curves at the ITO modified electrodes. It could be found that when the dilution ratio changed from 1![[thin space (1/6-em)]](https://www.rsc.org/images/entities/char_2009.gif) :
:![[thin space (1/6-em)]](https://www.rsc.org/images/entities/char_2009.gif) 1 to 1
1 to 1![[thin space (1/6-em)]](https://www.rsc.org/images/entities/char_2009.gif) :
:![[thin space (1/6-em)]](https://www.rsc.org/images/entities/char_2009.gif) 7 the potential difference between the oxidized and reduced peaks decreased. The change of the dilution ratio from 1
7 the potential difference between the oxidized and reduced peaks decreased. The change of the dilution ratio from 1![[thin space (1/6-em)]](https://www.rsc.org/images/entities/char_2009.gif) :
:![[thin space (1/6-em)]](https://www.rsc.org/images/entities/char_2009.gif) 7 to 1
7 to 1![[thin space (1/6-em)]](https://www.rsc.org/images/entities/char_2009.gif) :
:![[thin space (1/6-em)]](https://www.rsc.org/images/entities/char_2009.gif) 9 brought slight change in the potential. Fig. 2D shows the dependence of electrochemical responses of Cd2+ and Pb2+ on the dilution ratio of the carbon cement at the ITO modified electrodes in the paper-based analytical devices. It could be found that their peak heights reached the highest at the dilution ratio of 1
9 brought slight change in the potential. Fig. 2D shows the dependence of electrochemical responses of Cd2+ and Pb2+ on the dilution ratio of the carbon cement at the ITO modified electrodes in the paper-based analytical devices. It could be found that their peak heights reached the highest at the dilution ratio of 1![[thin space (1/6-em)]](https://www.rsc.org/images/entities/char_2009.gif) :
:![[thin space (1/6-em)]](https://www.rsc.org/images/entities/char_2009.gif) 7. Such results provide solid evidence for the close correlation between the conductivity of the working electrodes and the electrochemical responses of the heavy metals, which may help to find more substrates for the fabrication of the working electrodes. The dilution ratio of 1
7. Such results provide solid evidence for the close correlation between the conductivity of the working electrodes and the electrochemical responses of the heavy metals, which may help to find more substrates for the fabrication of the working electrodes. The dilution ratio of 1![[thin space (1/6-em)]](https://www.rsc.org/images/entities/char_2009.gif) :
:![[thin space (1/6-em)]](https://www.rsc.org/images/entities/char_2009.gif) 7 was used in the following experiments.
7 was used in the following experiments.
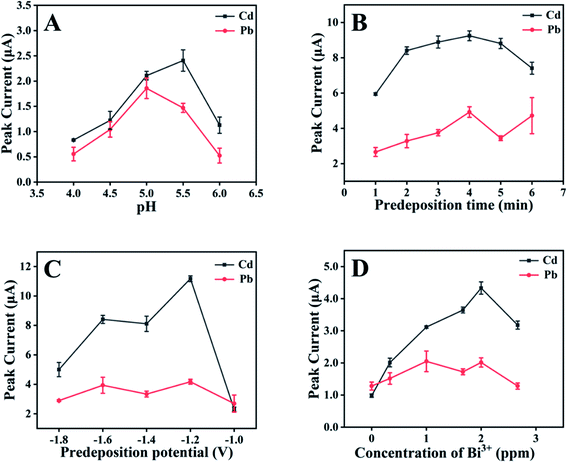
Fig. 3A exhibits the impacts of the pH value of the sample solution on the electrochemical response of Cd2+ and Pb2+. It could be found from Fig. 3A that electrochemical responses of both Cd2+ and Pb2+ increased significantly with the increase of the pH value from 4.0 to 5.0. With further increase of the pH value, the responses of Pb2+ decreased while those of Cd2+ reached the top at the pH value of 5.5 then decreased. The pH of 5 was used in our following experiments. Fig. 3B–D show the dependencies of electrochemical response of Cd2+ and Pb2+ on the predeposition time, the predeposition potential, and the concentration of Bi3+. Although their responses were not very similar, their highest values could be obtained simultaneously at the predeposition time of 4 min, the predeposition potential of −1.2 V, and the Bi3+ concentration of 2 ppm, respectively. Such results suggested that the pH value of the sample solution would be different while the other parameters are the same for optimized responses of Cd2+ and Pb2+.
Fig. 4 shows the dependences of electrochemical responses of Cd2+ and Pb2+ on their concentrations, respectively, using the optimized experimental parameters. Herein the pH value of 5.0 was selected for quantification of both Cd2+ and Pb2+. The relationship between the peak height (I, μA) and the concentration (C, ppb) of Cd2+ could be expressed by the equation of I = 0.0188 × C − 0.0133 (R2 = 0.987). For Pb2+, the relationship could be represented with the equation of I = 0.0103 × C + 0.015 (R2 = 0.991).
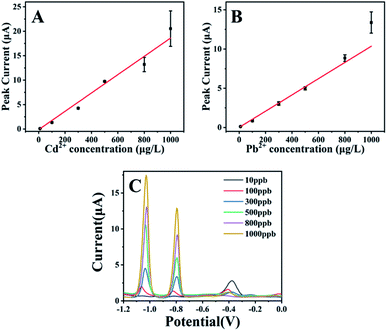 | ||
| Fig. 4 The dependence of peak current of Cd2+ (A) and Pb2+ (B) on their concentration range from 10 μg L−1 to 100 μg L−1. The SWV curves of Cd2+and Pb2+ at different concentrations (C). Experimental parameters: the same as those in Fig. 1. | ||
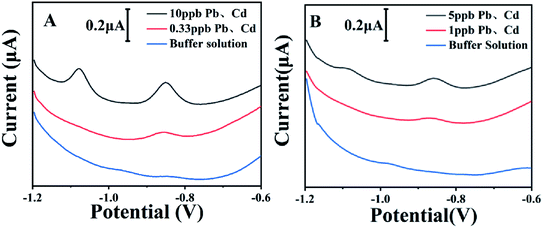
Fig. 5 illustrates the quantification of Cd2+ and Pb2+ at low concentrations with the current design. As we mentioned before, the pH value of the sample solution had different effects on electrochemical responses of Cd2+ and Pb2+. It could be observed from Fig. 5A that Pb2+ with the concentration of 0.33 ppb could be detected with the pH value of 5.0. With the pH value of 5.5 (Fig. 5B), Cd2+ with the concentration of 5 ppb could be detected. Such results demonstrated that the pH value of the sample solution plays a critical role in the detection limits of stripping analysis.
Fig. 6A illustrates the influences of Mn2+, Co2+, Ni2+, Zn2+, Fe3+ and Cu2+ on stripping analysis of Pb and Cd with our approach. It could be found that Zn2+ and Cu2+ decreased the responses of Cd2+ and Pb2+ and Ni2+ and Fe3+ enhance the responses. By comparison, Mn2+ and Co2+ have slight impacts. It has been reported that the presence of Cu2+ could interfere with the electrochemical response of Cd2+ and Pb2+ during stripping analysis.32 Fig. 6 shows the influences of Cu2+ on the detection of Cd2+ and Pb2+. It could be found that copper ions could inhibit electrochemical responses of Cd2+ and Pb2+, especially Cd2+, compared with the control. Besides, there's a peak at the potential of −0.32 V, which might be ascribed to Cu2+. The addition of copper extractant could not only remove the peak of Cu2+ but also recover both the peak heights of Cd2+ and Pb2+. Such results suggested that Cu2+ could interference stripping analysis of Cd2+ and Pb2+ in our system and this problem could be solved by adding copper extractant. It was also found that the addition of copper extractant had no effect on interferences of other ions.
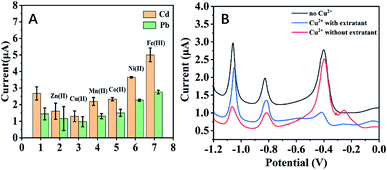 | ||
| Fig. 6 (A) Interference measurement in the solution containing 300 ppb Cd2+ and Pb2+ in the addition of 300 ppb Zn2+, Cu2+, Mn2+, Co2+, Ni2+ and Fe3+, respectively. (B) Influences of Cu2+ on electrochemical responses of mixture included 100 μg L−1 Cd2+, Pb2+, 2 mg L−1 Bi3+ at the modified electrodes. Experimental parameters: the same as those in Fig. 1. | ||
In the following, our approach was used to detect Cd and Pb in two children's shoes bought from internet stores. Fig. 7 shows the electrochemical responses of two samples in the paper-based electroanalytical devices after treatment with HNO3. It could be found that in the curves there were well-defined peaks at the potentials of ∼ −1.02 and ∼ −0.79 V, which was ascribed to the peaks of Cd2+ and Pb2+. Using the standard addition method, the migrated amounts of Cd and Pb could be further verified and quantified. Table 1 listed the results with our approach and those using ICP-MS on quantification of Pb and Cd in children's shoes. The agreement of results suggested the potential of our approach for monitoring heavy metals in practical applications.
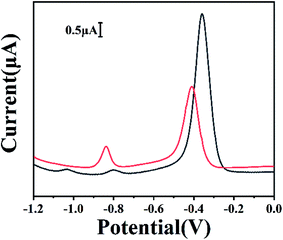 | ||
| Fig. 7 SWV curves of Cd and Pb ions migrated from children's shoes. Blackline: sample 1, red line: sample 2. Experimental parameters: the same as those in Fig. 1. | ||
| Sample | Heavy metals | Detection results (μg kg−1) | ICP-MS (μg kg−1) |
|---|---|---|---|
| 1 | Pb | 4875 | 4100 |
| Cd | 2279 | 2100 | |
| 2 | Pb | 14![[thin space (1/6-em)]](https://www.rsc.org/images/entities/char_2009.gif) 186 186 |
15![[thin space (1/6-em)]](https://www.rsc.org/images/entities/char_2009.gif) 000 000 |
| Cd | 0 | 0 |
4. Conclusion
Herein the paper-based electroanalytical devices were used for the study of the connection between the conductivity and the analytical performance of the ITO electrodes modified with carbon cement. Our experimental results showed that the dilution ratio of 1![[thin space (1/6-em)]](https://www.rsc.org/images/entities/char_2009.gif) :
:![[thin space (1/6-em)]](https://www.rsc.org/images/entities/char_2009.gif) 7 for the carbon cement brought about the lowest electric resistance and the highest electrochemical responses. After optimization, the devices could be used to quantify Cd and Pb linearly with the detection limits of less than 1 ppb for Pb and 5 ppb for Cd. With our approach, Cd and Pb in children's shoes could be screened with the results similar to those obtained with standard methods. This study suggested the importance of the electrode substrates and offered a simple and low-cost way for the fabrication of the working electrodes for stripping analysis.
7 for the carbon cement brought about the lowest electric resistance and the highest electrochemical responses. After optimization, the devices could be used to quantify Cd and Pb linearly with the detection limits of less than 1 ppb for Pb and 5 ppb for Cd. With our approach, Cd and Pb in children's shoes could be screened with the results similar to those obtained with standard methods. This study suggested the importance of the electrode substrates and offered a simple and low-cost way for the fabrication of the working electrodes for stripping analysis.
Conflicts of interest
There are no conflicts to declare.Acknowledgements
The authors appreciate financial supports from the National Key R&D Program of China (No. 2016YFF0203703) and the National Natural Science Foundation of China (No. 21904072 and 21375066).References
- Z. Rahman and V. P Singh, Environ. Monit. Assess., 2019, 191, 419 CrossRef.
- M. Kampa and E. Castanas, Environ. Pollut., 2008, 151, 362–367 CrossRef CAS.
- B. Robinson, Sci. Total Environ., 2009, 408, 183–191 CrossRef CAS.
- P. J. Landrigan, Children's health and the environment: a global perspective, World Health Organization, 2005 Search PubMed.
- H. Wang, Z. Wu, B. Chen, M. He and B. Hu, Analyst, 2015, 140, 5619–5626 RSC.
- E. L. Silva, P. d. S. Roldan and M. F. Gine, J. Hazard. Mater., 2009, 171, 1133–1138 CrossRef CAS.
- V. I. Safarova, G. F. Shaidullina, T. N. Mikheeva, F. K. Kudasheva and N. R. Nizamutdinova, Inorg. Mater., 2011, 47, 1512–1517 CrossRef CAS.
- S. Raje, R. T. Sane, K. Mangaonkar, S. Shailajan, G. Pathak, N. Jariwala and D. Kasar, J. Indian Chem. Soc., 2006, 83, 611–612 CAS.
- K.-Y. Kum, Q. Zhu, K. Safavi, Y. Gu, K.-S. Bae and S. W. Chang, Aust. Endod. J., 2013, 39, 126–130 CrossRef.
- E. H. El-Araby, M. Abd El-Wahab, H. M. Diab, T. M. Ei-Desouky and M. Mohsen, Appl. Radiat. Isot., 2011, 69, 1506–1511 CrossRef CAS.
- R. Sitko, P. Janik, B. Zawisza, E. Talik, E. Margui and I. Queralt, Anal. Chem., 2015, 87, 3535–3542 CrossRef CAS.
- J. Zhou, B. Li, A. Qi, Y. Shi, J. Qi, H. Xu and L. Chen, Sens. Actuators, B, 2020, 305, 127462 CrossRef CAS.
- J. Qi, B. Li, X. Wang, Z. Zhang, Z. Wang, J. Han and L. Chen, Sens. Actuators, B, 2017, 251, 224–233 CrossRef CAS.
- X. Sun, B. Li, A. Qi, C. Tian, J. Han, Y. Shi, B. Lin and L. Chen, Talanta, 2018, 178, 426–431 CrossRef CAS.
- L. Pujol, D. Evrard, K. Groenen-Serrano, M. Freyssinier, A. Ruffien-Cizsak and P. Gros, Front. Chem., 2014, 2, 19 Search PubMed.
- L. Wang, X. Peng, H. Fu, C. Huang, Y. Li and Z. Liu, Biosens. Bioelectron., 2020, 147, 111777 CrossRef CAS.
- Q.-M. Feng, Q. Zhang, C.-G. Shi, J.-J. Xu, N. Bao and H.-Y. Gu, Talanta, 2013, 115, 235–240 CrossRef CAS.
- Y. Ma, Y. Wang, D. Xie, Y. Gu, X. Zhu, H. Zhang, G. Wang, Y. Zhang and H. Zhao, Chem. Eng. J., 2018, 347, 953–962 CrossRef CAS.
- S. S. Li, M. Jiang, T. J. Jiang, J. H. Liu, Z. Guo and X. J. Huang, J. Hazard. Mater., 2017, 338, 1–10 CrossRef CAS.
- J. F. S. Joca, F. S. Felix and L. Angnes, Anal. Lett., 2020, 53, 1075–1086 CrossRef CAS.
- G. Moro, F. Bottari, J. Van Loon, E. Du Bois, K. De Wael and L. M. Moretto, Biosens. Bioelectron., 2019, 146 Search PubMed.
- H. D. Kilic and H. Kizil, Anal. Bioanal. Chem., 2019, 411, 8113–8121 CrossRef CAS.
- X.-M. Bi, H.-R. Wang, L.-Q. Ge, D.-M. Zhou, J.-Z. Xu, H.-Y. Gu and N. Bao, Sens. Actuators, B, 2018, 260, 475–479 CrossRef CAS.
- X. L. Huo, J. F. Qi, K. C. He, N. Bao and C. G. Shi, Anal. Chim. Acta, 2020, 1124, 32–39 CrossRef CAS.
- M. D. Tutulea, I. Cretescu, D. Sibiescu and C. Stan, Environ. Eng. Manage. J., 2012, 11, 463–470 CrossRef CAS.
- E. P. Achterberg and C. B. Braungardt, Anal. Chim. Acta, 1999, 400, 381–397 CrossRef CAS.
- W. Wang, H. Bai, H. Li, Q. Lv, Q. Zhang and N. Bao, Sens. Actuators, B, 2016, 236, 218–225 CrossRef CAS.
- H. Wang, T. Jiang, Y. Tang, Y. D. Zou and T. J. Jiang, Food Sci., 2014, 35, 88–92 CAS.
- L. Liu, S. Yellinek, I. Valdinger, A. Donval and D. Mandler, Electrochim. Acta, 2015, 176, 1374–1381 CrossRef CAS.
- K. Chen, G. Li, Y. Wang, W. Chen and L. Mi, Green Energy Environ., 2020, 5, 50–58 CrossRef.
- G. Li, K. Chen, Y. Wang, Z. Wang, X. Chen, S. Cui, Z. Wu, C. Soutis, W. Chen and L. Mi, Nanoscale, 2020, 12, 8493–8501 RSC.
- M. Finsgar, B. Petovar and K. Vodopivec, Microchem. J., 2019, 145, 676–685 CrossRef CAS.
| This journal is © The Royal Society of Chemistry 2020 |

