 Open Access Article
Characteristics and mechanism of toluene removal by double dielectric barrier discharge combined with an Fe2O3/TiO2/γ-Al2O3 catalyst
Rui Wang *abc,
Jiaze Renabc,
Jiangyou Wuabc and
Lanlan Wuabc
aState Key Laboratory of Safety and Health for Metal Mines, Maanshan 243000, China. E-mail: 564044540@qq.com
bSinosteel Maanshan General Institute of Mining Research Co., Ltd., Maanshan 243000, China
cHuawei National Engineering Research Center of efficient recycling for Metal Mineral Resources Co., Ltd., Maanshan 243000, China
First published on 13th November 2020
Abstract
Removal of volatile organic compounds (VOCs) by non-thermal plasma technology produced by dielectric barrier discharge has become a hotspot due to its rapid reaction at room temperature, convenience without preheating and high removal efficiency of VOCs. Ways to improve the removal efficiency of mixed VOCs and the control of by-products in the discharge process are urgently needed. In view of the above shortcomings, the research progress of catalysts to improve the removal efficiency of VOCs by dielectric barrier discharge in recent years was reviewed; in this research, we conducted experiments on the removal efficiency of toluene under high flow rate experimental conditions (input voltage 10–70 V, mixed gas flow rate 1 m3 h−1, inlet concentration 1000 mg m−3). The research used γ-Al2O3, TiO2/γ-Al2O3 and Fe2O3/TiO2/γ-Al2O3 as catalysts in a reactor with a discharge gap of 6 mm, and a 99.7% removal efficiency of toluene was achieved when the SIE was 183.4 J L−1. The added catalyst significantly reduced the concentration of by-products. At the same time, experiments with multiple catalysts to improve the removal efficiency and the performance of the discharge effect under different humidity levels were analyzed. The removal efficiency of toluene was optimized and recyclable, the formation of by-products was effectively suppressed when the catalysts in the reactor were Fe2O3/TiO2/γ-Al2O3, TiO2/γ-Al2O3 and γ-Al2O3, and the discharge length was 1![[thin space (1/6-em)]](https://www.rsc.org/images/entities/char_2009.gif) :
:![[thin space (1/6-em)]](https://www.rsc.org/images/entities/char_2009.gif) 2
2![[thin space (1/6-em)]](https://www.rsc.org/images/entities/char_2009.gif) :
:![[thin space (1/6-em)]](https://www.rsc.org/images/entities/char_2009.gif) 2.
2.
Introduction
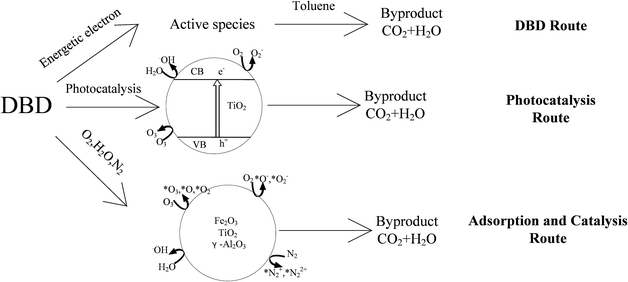
Volatile organic compounds (VOCs), as the main components of air pollution, are produced in large quantities in the production processes of leather goods, inks, and decoration materials. Due to the health hazards of VOCs and their negative impact on the environment, the issue of effective removal of VOCs is urgent. Traditional methods such as physical adsorption, chemical absorption, condensation or biological methods are difficult to put into practical industrial application due to their cost and concentration limitations.1–5 Low-temperature plasma has become a research hotspot because of its high response rate to VOCs, the low cost of the processing technology and the convenience of opening and closing the experimental device.6–8Dielectric barrier discharge, a method for efficiently generating low-temperature plasma, involves applying an alternating voltage to two electrodes covered by an insulating medium to break down the working gas between the electrodes, accelerate free electrons, endow the gas with high energy and cause electron collapse.9–11 The VOCs in the reactor are mainly degraded in two ways: in the first, the molecular structures of the VOCs themselves are destroyed by high-energy electrons and split into smaller particles, while in the second, high-energy electrons collide with gas molecules such as N2 and O2. Free radicals and active ions with different degrees of reactivity are generated, and these products react with VOCs to achieve the effect of purifying the VOCs.12
In order to reduce the yield of by-products in the process of removing low-temperature plasma generated by dielectric barrier discharge to remove VOCs and improve the reaction efficiency, a catalyst is usually used for the cooperative reaction. Studies13–20 have shown that catalysts can effectively increase the reaction area, improve the removal efficiency of VOCs along with the selectivity of CO2, and reduce the formation of by-products.21
Materials and methods
Experimental setup
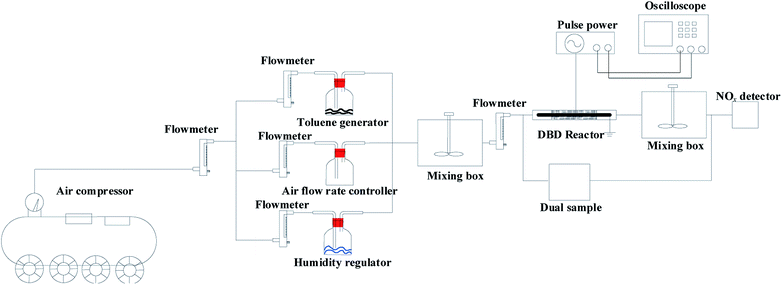
The experimental system consisted of a gas inlet system, DBD reactor (discharge length 200 mm, discharge distance 6 mm; the high-voltage electrode was stainless steel mesh, and the low-voltage electrode was quartz), pulse power supply (0–20 kV, 50% duty cycle, f = 10 kHz, fm = 200 Hz, CTP-2000 K, pulse width 2.5 × 10⁻³ s, China Jiangsu Suman Plasma Technology Co., Ltd.) and analysis system. Compressed air generated by an air compressor passes through the rotor flowmeter and enters the mixing box in three ways. In the first way, air enters the cylinder containing toluene (l); in the second way, air enters the empty cylinder to control the air flow rate (l); in the third way, air enters the water-mixed gas bottle to control the humidity. Experimental gas enters the mixing box after the three-way gas merges and then enters the dielectric barrier discharge reactor after mixing evenly. The experimental system adjusts the gas flow rate, humidity and initial concentration of toluene through the flow meter and the manual valve of the air compressor to control the concentration of toluene at about 1000 mg m−3 and the relative humidity at about 30%. The inlet and outlet concentrations of toluene and CO2 were measured by activated carbon adsorption/carbon analysis and gas chromatography, referring to the National Environmental Protection Standard of the People's Republic of China (HJ584-2010). The NOx concentration was analyzed by a flue gas analyzer (KM950, Kane International Co. Ltd.). The O3 concentration was measured by the iodometric method (Fig. 1).The toluene removal efficiency was defined as
| η = (C0 − C)/C0 × 100%. |
The selectivity of CO2 was defined as
| SCO2 = CCO2/7(C0 − C). |
Preparation of catalyst
Activation of γ-Al2O3: deionized water was used to clean the alumina pellets, the pellets were dried at 100 °C for 3 h, and the temperature was raised to 550 °C at 5 °C per minute in a muffle furnace. After roasting for 3 h, the pellets were set aside.Preparation of TiO2/γ-Al2O3
TiO2 powder was dispersed in 100 mL of deionized water containing 0.1% polyethylene glycol and ultrasonically dispersed at 30 °C for 30 min; then, the activated γ-Al2O3 pellets were immersed in the catalyst dispersion for 10 min. The powder was removed and roasted in a muffle furnace at 150 °C for 2 h.Preparation of Fe2O3/TiO2/γ-Al2O3
10 g of titanium dioxide powder was mixed with a certain amount of Fe(NO3)3 solution, stirred well and then ultrasonically dispersed for 10 min; after being kept open at 120 °C for 4 h, the solution was evaporated and the powder was removed. 100 mL deionized water containing 0.1% polyethylene glycol was added; the mixture was stirred uniformly and ultrasonically dispersed for 30 minutes. The activated γ-Al2O3 was soaked in this mixture for 30 minutes, then calcinated in a muffle furnace at 150 °C for 1 hour and calcinated under increasing temperature at a rate of 10 °C every 15 minutes for 2 hours.Measuring method of energy density
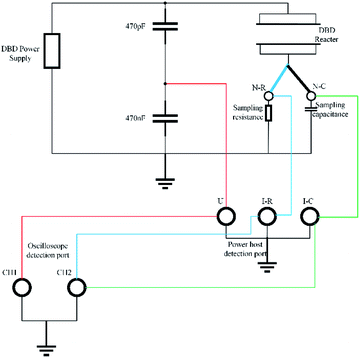
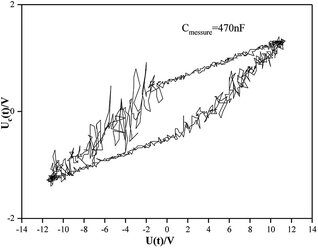
An error occurred in the power measurement caused by the action of the alternating electric field because the phase difference between the discharge voltage and current is difficult to measure. Therefore, in this study, we used the Lissajous method to determine the discharge power. The principle is to connect a measuring capacitor in series with the internal load of the power supply (its capacitance value CM is known and is much larger than the equivalent capacitance of the reactor load); the circuit diagram is shown in Fig. 2.At the same time, the voltage U(t) applied to the load and the voltage Uc(t) on the measuring capacitor were connected to the oscilloscope, and the relationship of the U(t)–t curves, Uc(t)–t curves and closed response U (the Lissajous curve of t)–Uc(t) is shown in Fig. 3. By integrating the Lissajous figure area, the discharge power of the reactor can be calculated by a formula. From this, the specific input energy of the DBD reactor can be calculated. The calculation formula is as follows:22,23
| P (W) = fm × capacitance × Slissajous |
Results and discussion
Characterization of the catalysts Fe2O3, TiO2, and γ-Al2O3
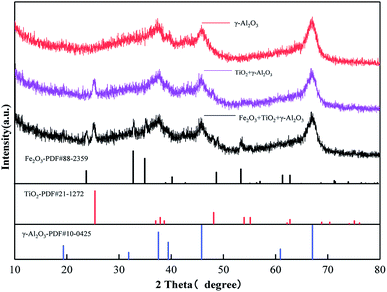
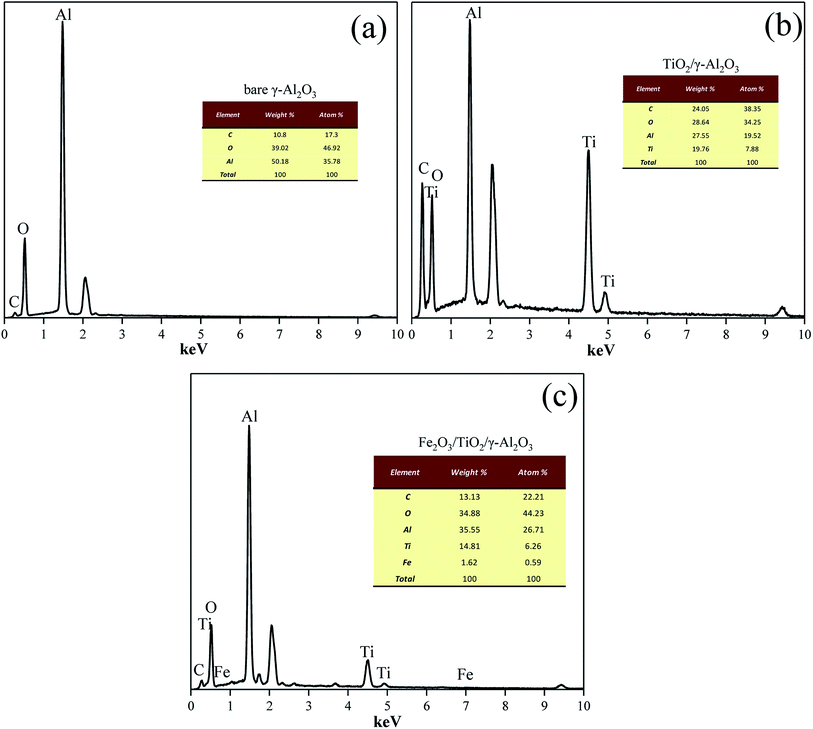
Fig. 4 shows the XRD patterns of γ-Al2O3 and other catalysts based on γ-Al2O3. As shown in Fig. 4, the diffraction peaks of Al2O3 appear at 2θ = 19.45°, 31.93°, 37.63°, 39.49°, 45.86°, and 67.03°, which correspond well to PDF no 10-0425; this proves that the crystal form of alumina is γ-Al2O3.After loading TiO2, the diffraction peaks appearing at 2θ = 25.28°, 37.8°, 48.05°, 62.69°, and 75.02° correspond well to the standard pd of anatase (PDF no 21-1272). After loading Fe2O3, the diffraction peaks appearing at 2θ = 23.85°, 32.85°, 35.08°, 40.32°, 48.82°, 53.5°, and 61.53° correspond to hematite (PDF no 88-2359). However, the peak intensity corresponding to Fe2O3 (hematite, PDF number 88-2359) is low and has a slight deviation. This is because loading Fe on Al2O3 will shift the peak to a larger angle.24 Due to the low loading and good spreading, the peak of Fe2O3 is not obvious in the XRD test results; however, the EDS test results (Fig. 5) show that sample 2 and sample 3 are successfully loaded with Ti and Fe.25
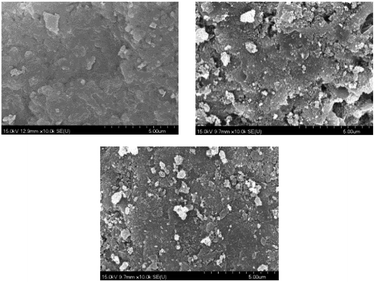
The SEM results (Fig. 6) also support this point of view: as shown in Fig. 6(a), the surface of the bare γ-Al2O3 is smooth; as shown in Fig. 6(b), TiO2(anatase) is loaded on the surface of γ-Al2O3 as small unevenly dispersed particles, showing an irregular morphology; in Fig. 6(c), the Fe2O3 hematite in the form of irregular flakes and blocks is loaded on the surface of TiO2/γ-Al2O3. It can be seen that compared with small TiO2 particles, larger flakes and massive particles appear on the surface of the catalyst. However, the surface of the catalyst still maintains an overall dense morphology, indicating that the loading of Fe2O3/TiO2 does not change the basic structure of the catalyst carrier γ-Al2O3.
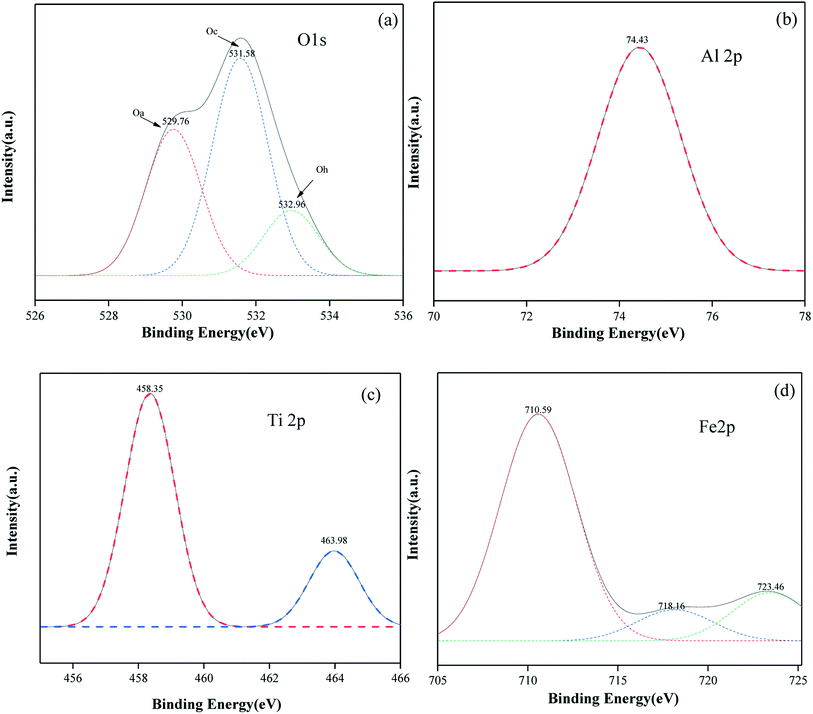
It can be seen from Fig. 7(a) that the xps spectra of O 1S of hematite, anatase and γ-Al2O3 can be fitted to three forms of peaks. The diffraction peak with a binding energy of 529.76 eV corresponds to the lattice oxygen (Oa) on the catalyst surface. The diffraction peak with a binding energy of 531.58 eV corresponds to the adsorbed oxygen (Oc) on the catalyst surface, and the diffraction peak with binding energy at 532.96 eV corresponds to the hydroxyl oxygen or oxygen in water (Od) due to adsorption on the catalyst surface. Among them, adsorbed oxygen (Oc) accounts for a higher proportion, which can improve the catalytic activity of the catalyst and is beneficial to the oxidation process of VOCs. The diffraction peak binding energy in the xps spectrum of γ-Al2O3 is 74.41 eV, indicating that Al exists in the form of Al3+. The XPS spectrum of Ti in the catalyst is shown in Fig. 7(c). The diffraction peaks of anatase at 458.35 eV and 463.98 eV correspond to Ti 2p3/2 and Ti 2p1/2. This shows that Ti4+ exists on the catalyst surface. The XPS spectrum of Fe 2p in the catalyst is shown in Fig. 7(d). The diffraction peaks of hematite at 710.59 eV and 723.46 eV correspond to Fe 2p1/2 and Fe 2p3/2, respectively, and the accompanying peaks are at 718.16 eV, indicating that hematite on the surface of the catalyst exists in the form of Fe3+.26 The diffraction peaks of the three elements of Al, Ti and Fe in the catalyst are all shifted to a certain extent compared to the standard XPS spectrum. Combined with XRD, it can be seen that the interaction between γ-Al2O3, anatase and hematite in the catalyst changes the electron cloud density of the surface elements, which is beneficial to the catalytic oxidation of VOCs.27
Influence of input voltage on output power and SIE
As shown in Fig. 8, the increase of the specific input energy (SIE, which is also called specific energy density) showed a trend of slow and then fast with increasing input voltage. After the input voltage was greater than 60 V, the growth rate gradually tended to be flat. The SIE values of the three curves represented by the reactor with catalyst added were significantly higher than the SIE value of the curve represented by a single DBD reactor because the addition of catalyst reduced the discharge gap, increased the peak voltage and ionized more high-energy particles. Therefore, the collision probability of high-energy particles and gas molecules in the dielectric barrier discharge process was improved, and the value of SIE increased.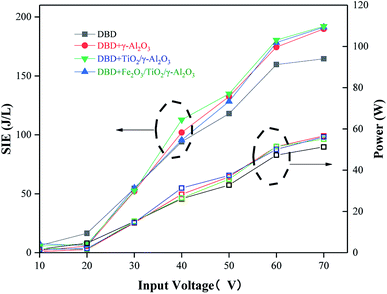 | ||
| Fig. 8 The relationships between SIE and the change in output power with input voltage in different types of DBD reactors. | ||
Moreover, the power increased slowly when the input voltage was 10–30 V, and the trend grew faster when the input voltage was 30–60 V. The curve with the added catalyst was similar to the value of the power compared to the single DBD due to the addition of the catalyst, which increased the peak voltage. At the same time, the smaller discharge interval caused the current to decrease; therefore, there is not much difference in the power value.
Influence of SIE on the toluene removal efficiency and selectivity of CO2
In the single DBD process, the removal efficiency of toluene and the selectivity of CO2 were both low because the residence time of toluene gas in the DBD process was relatively short and it could not be completely degraded. As a result, it was difficult to generate CO2. The addition of the catalyst significantly improved the removal rate of toluene at various energy densities. The γ-Al2O3 catalysts loaded with TiO2 and TiO2/Fe2O3 increased the removal efficiency of toluene by 20.48% and 28.94% compared with a single DBD and the selectivity of CO2 was increased by 32.55% and 35.85%, respectively. It can be seen from Fig. 9 that the removal rate of toluene by the reactor loaded with different catalysts improved with increasing SIE, which showed an increasing trend of fast and then slow. This is because with the increase of the applied electric field, more free radicals were produced during the reaction, and the electrons produced had higher energy. These high-energy particles would accelerate the decomposition of toluene. However, the high-energy electrons and free radicals generated were sufficient to destroy the lower-energy chemical bonds in the pollutants as the energy density gradually increased, and the removal rate increased slowly as the energy density continued to increase because the generated electrons had higher energy and more radical groups decomposed chemical bonds and grouped with higher energy moieties, such as benzene rings. At the same time, the pollutants completely decomposed and oxidized the intermediate products generated during the reaction into CO2 and H2O. This change improved the selectivity of CO2; however, it slowed the increase in the removal rate as well.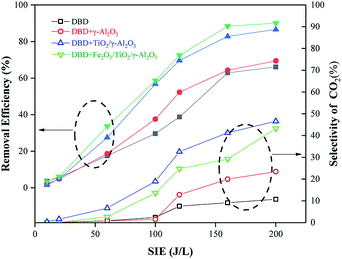 | ||
| Fig. 9 The relationship between the removal efficiency and selectivity of CO2 with SIE in different types of DBD reactors. | ||
Under the same SIE, the removal rate of toluene by the reactor loaded with catalyst was higher than that of the ordinary DBD reactor, indicating that the presence of γ-Al2O3 pellets loaded with TiO2 and Fe2O3 could effectively promote the degradation of organic matter. When the SIE was higher than 150 J L−1, the difference in the removal rate was reduced because the energy was enough to destroy the structure of most toluene molecules without the help of an external catalyst. Therefore, the addition of the catalyst could improve the energy utilization rate to a certain extent and reduce the energy consumption during the DBD reaction process.
Influence of SIE on NOx concentration
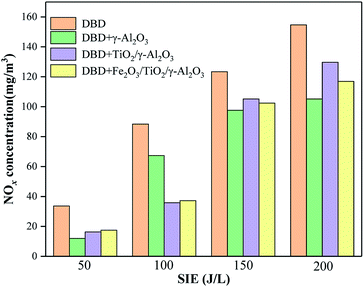
In the DBD process, electrons collided with background gas molecules such as O2 and N2, generating ground and excited oxygen and nitrogen atoms. These oxygen atoms and nitrogen atoms would further react with O2 and O3 to produce NO and NO2. This study investigated the amount of NOx produced by the DBD reactor and the catalyst-loaded reactor under different values of SIE. As shown in Fig. 10, the NOx concentration gradually increased as the SIE increased because the higher SIE reflected the higher discharge energy in the reaction. The extra NOx generated could not be reduced like O3, which decomposes at high temperature, and could not be used as a reactant to promote the oxidation of toluene; therefore, the concentration of NOx gradually increased.28,29The DBD reactor had the worst mineralization efficiency but the highest NOx output. It was found that the excessive energy in the DBD reactor was consumed in the process of forming NOx, which was an important reason for its low mineralization rate. Under the same value of SIE value, NOx was generated due to the short reaction time between the active group and the toluene molecule, in which the toluene molecule could not be purified while the active group was consumed. After adding the catalyst, on the one hand, the pollutants and background gas molecules were adsorbed on the surface of the carrier, and the probability that the active groups on the carrier surface would react with the pollutant gas molecules and oxygen molecules was improved compared with N2 molecules. On the other hand, the precursors of NOx-active oxygen atoms and excited nitrogen molecules or nitrogen atoms were consumed on the surface of the catalyst, resulting in a decrease in the concentration of NOx. Due to the above reasons, the reactor loaded with the catalyst had a higher energy utilization rate.
As shown in Fig. 10, the reactor loaded with γ-Al2O3 catalyst could control the production of NOx well. When the surface of γ-Al2O3 was loaded with TiO2 and Fe2O3, the NOx concentration of the two reactors was higher than that of the γ-Al2O3 reactor, and the total NOx concentration of the two reactors was not much different.
Influence of SIE on O3 concentration
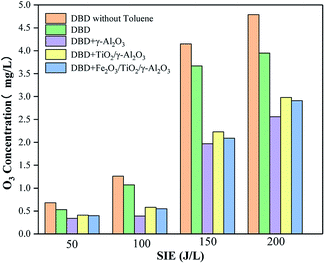
The principle of the synergy between the DBD process and a heterogeneous catalyst is that the ultraviolet light and high-energy particles generated during the DBD discharge process can excite TiO2 and generate hole–electron pairs. At the same time, γ-Al2O3 as the catalyst carrier plays a role in adsorbing pollutant molecules, while the addition of Fe2O3 also improves the catalytic activity. Under the action of the DBD electric field, the active material produced will react with the pollutant molecules adsorbed on the surface of the catalyst, and the holes will also directly oxidize the pollutant molecules or oxidize H2O molecules to form ·OH. During the reaction process, ozone went through the following process: (1) the hole–electron pair generated after TiO2 was excited had strong oxidizing properties, and a large amount of O3 was generated; (2) during the DBD process, a large amount of O3 was generated; (3) direct reactions with pollutant molecules on the catalyst surface occurred; (4) the pollutant molecules reacted with the precursors, which produced O3 on the surface of the catalyst.In the DBD reaction process, O3 is an inevitable by-product. This study investigated the changes in the concentration of O3 produced in the DBD process in different reactors under different values of SIE. As shown in Fig. 11, the amount of O3 produced in all the DBD reactors showed an initial rapidly increasing trend and then slowly increased with increasing SIE because the increase of SIE would lead to an increase in the energy and in the number of higher-energy electrons inside the reactor. These higher-energy electrons could easily destroy the O![[double bond, length as m-dash]](https://www.rsc.org/images/entities/char_e001.gif) O bond, converting O2 into O3; meanwhile, more high-energy electrons and free radical groups were generated, and these high-energy electrons and free radical groups would decompose O3 into O2 when the energy density increased at the same time. O3 was not only a byproduct but also an oxidant which could oxidize toluene and the intermediate products. The above reasons together led to an increase in ozone content.
O bond, converting O2 into O3; meanwhile, more high-energy electrons and free radical groups were generated, and these high-energy electrons and free radical groups would decompose O3 into O2 when the energy density increased at the same time. O3 was not only a byproduct but also an oxidant which could oxidize toluene and the intermediate products. The above reasons together led to an increase in ozone content.
When toluene was introduced, the O3 concentration decreased. On the one hand, toluene and O3 would directly react on the surface of the catalyst so that O3 could be consumed; on the other hand, toluene would react with the precursor that generated ozone on the surface of the catalyst, which indirectly led to a decrease in ozone content. However, the output of ozone decreased slightly after adding toluene to the reactor because the by-products generated during the reaction covered the active sites on the surface of the catalyst carrier, reducing the catalytic activity of γ-Al2O3. At the same time, these byproducts occupied the active sites on the surface of the catalyst, preventing toluene from reacting with the active oxygen groups on the surface.
The O3 concentration in the reactor loaded with TiO2/γ-Al2O3 was higher than that in the reactor loaded with blank γ-Al2O3. TiO2 could be excited to generate hole–electron pairs under the action of DBD, and the holes had a strong oxidizing ability; meanwhile, a large amount of O3 was generated, and the O3 would also be decomposed on the surface of the catalyst during the reaction process.30
In addition, it can be seen from Fig. 11 that the concentration of ozone was lower in the reactors loaded with Fe2O3/TiO2/γ-Al2O3 and TiO2/γ-Al2O3 than in the DBD reactor. The concentration of ozone in the former reactor was the lowest. This showed that the addition of Fe2O3 not only consumed the oxygen used to generate ozone but also promoted the decomposition of ozone or make ozone form active groups to participate in the degradation reaction and further reduce the concentration of ozone. The concentrations of ozone produced by the two catalytic reactors were not much different. The O3 concentration produced by the reactor loaded with Fe2O3/TiO2/γ-Al2O3 was lower than that in the reactor loaded with TiO2/γ-Al2O3. This result was in agreement with the previous removal rate comparison, which further showed that the Fe2O3/TiO2/γ-Al2O3 catalyst has higher catalytic activity.
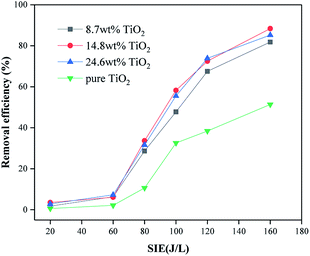
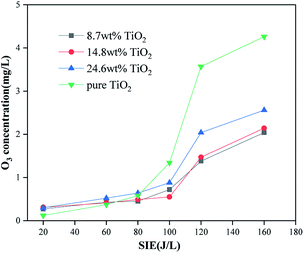
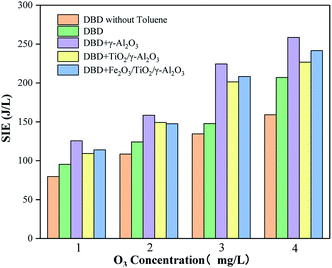
Four catalytic reactors were prepared by loading TiO2 on γ-Al2O3 and directly coating TiO2 on the electrode. The removal efficiency of toluene and the output of O3 were evaluated under different SIE values. It can be seen from Fig. 12 and 13 that with the help of the γ-Al2O3 carrier, the TiO2 carried on the γ-Al2O3 carrier showed a higher toluene removal efficiency and a lower O3 output than pure TiO2. This is because more pollutant molecules will be adsorbed onto the surface of the catalyst, which increases the probability of reacting with active substances on the catalyst surface. After TiO2 is excited, the carrier facilitates the exposure of pollutant molecules to the generated holes. As shown in Fig. 12, reactors with different TiO2 wt% show similar treatment efficiencies and ozone production. Among these, the catalytic reactor with about 15 wt% TiO2 has the best effect. This is because a suitable weight percentage of TiO2 can not only generate enough electron–hole pairs to oxidize pollutant molecules, but will also not cover too many catalyst sites, thereby affecting the adsorption effect of the pollutant molecules. Pure TiO2 shows lower processing efficiency and higher ozone production. This is because the lack of catalyst carrier adsorption of pollutant gas molecules reduces the residence time of gas molecules in the reactor and is not conducive to the consumption of ozone on the surface of the catalyst. Through control experiments on the amount of ozone produced by different reactors under different SIE values, the research showed that under different O3 concentration levels, the reactor loaded with Al2O3 has the highest SIE value; the SIE values of the reactors loaded with TiO2/γ-Al2O3 and Fe2O3/TiO2/γ-Al2O3 are slightly lower, indicating that the Al2O3 catalyst has the best controlling effect on ozone, and the results are also consistent with the research of ozone production under the same SIE (Fig. 14).
Byproduct analysis
Active groups containing oxygen and nitrogen were formed during the discharge process after toluene and background gas molecules (N2 and O2) entered the reactor. These active groups and the high-energy electrons generated by the discharge would react with the toluene molecules to form a large amount of intermediate product. The chemical bonds with low bond energy in the toluene molecule would be destroyed by the particles, active groups with relatively low energy and some chemical bonds with higher bond energy, such as benzene rings, in this process. The energy would also be reduced during the collision with the particles, resulting in preliminary purification of the toluene molecules.As shown in Fig. 15(b), γ-Al2O3 had the function of adsorbing organic gas molecules, prolonging their residence time in the DBD process, and increasing the probability of collisions between high-energy electrons generated in the DBD process and gas molecules; this facilitates the production of high-energy particles or strong oxidizing properties, promoting the decomposition of the organic gas.
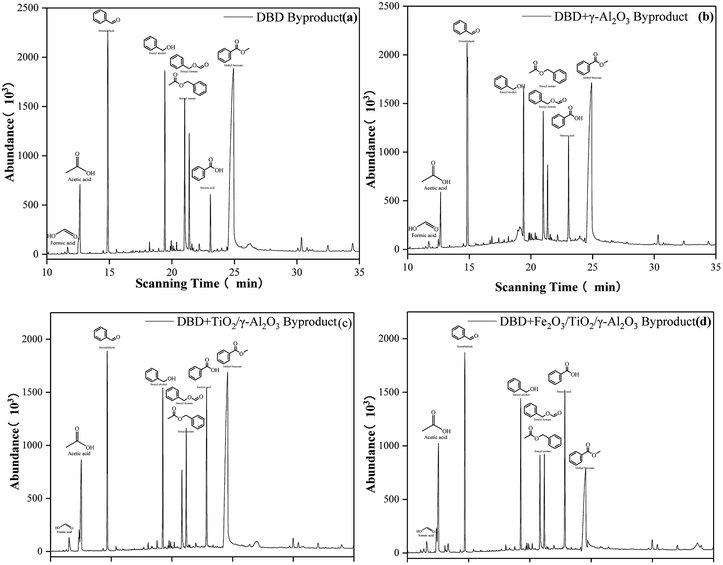 | ||
| Fig. 15 Byproducts generated in DBD (a), DBD + γ-Al2O3 (b), DBD + TiO2/γ-Al2O3 (c), DBD + Fe2O3/TiO2/γ-Al2O3 (d). | ||
After TiO2 was loaded on γ-Al2O3, the concentrations of benzyl formate, benzaldehyde and benzyl alcohol were significantly reduced. At the same time, the concentrations of benzoic acid, formic acid, and acetic acid increased, which can be found in Fig. 15(c). The results showed that the combination of photocatalysis and DBD strengthened the degradation ability of toluene molecules, which was beneficial to further improvement of the selectivity of CO2.
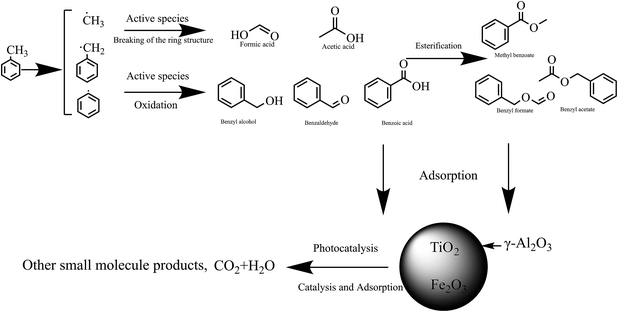
When Fe2O3/TiO2/γ-Al2O3 was added to the DBD reactor, a large number of active groups and high-energy particles generated by the DBD process and catalytic reaction were adsorbed on the surface of the catalyst carrier, and a series of reactions occurred on the active sites of the catalyst which further improved the decomposition rate of the organic mixture. It can be seen from Fig. 15(d) that the addition of Fe2O3 further reduced the concentration of methyl benzoate. More small molecules appeared under the synergistic effect of the photocatalysis and DBD reaction, which showed that the addition of Fe2O3 promoted the decomposition of toluene and intermediate products, pushing the reaction forward in the direction of producing smaller molecules. The inferred reaction mechanism is shown in Fig. 16 and 17.
Synergistic effects of different catalysts
From the research above, it can be found that different catalysts have their own advantages and disadvantages when cooperating with DBD to treat toluene. Therefore, this study considered the location of different catalysts in the DBD reactor according to the processing characteristics to maximize the removal efficiency and selectivity of CO2 and reduce the generation of by-products. Compared with other catalysts, Fe2O3/TiO2/γ-Al2O3 had higher treatment efficiency and selectivity of CO2. Therefore, Fe2O3/TiO2/γ-Al2O3 was used as the catalyst in the first section to degrade part of the toluene and promote the reaction in the direction of generating more small molecules. However, it can be seen from Fig. 15 that the DBD process using Fe2O3/TiO2/γ-Al2O3 as a catalyst would produce more kinds of by-products. The synergy of γ-Al2O3 loaded with TiO2 and DBD could further reduce the output of by-products, especially for the removal of small molecule products. Therefore, this study considered using TiO2 as the catalyst in the second section to oxidize small molecules and continue to degrade toluene.31 The combination of DBD and γ-Al2O3 achieved the lowest concentration of ozone and NOx in the experiment; therefore, γ-Al2O3 was considered as the third-stage catalyst to decompose ozone and NOx in order to increase the selectivity of CO2 and reduce the by-product concentration. After determining the types of catalysts in the different discharge regions, the discharge lengths occupied by different catalysts were compared. The research results showed that the removal efficiency could reach more than 99.7% under a certain value of SIE (Table 1).Discharge length ratio (Fe2O3/TiO2/γ-Al2O3![[thin space (1/6-em)]](https://www.rsc.org/images/entities/char_2009.gif) : :![[thin space (1/6-em)]](https://www.rsc.org/images/entities/char_2009.gif) TiO2/γ-Al2O3 TiO2/γ-Al2O3![[thin space (1/6-em)]](https://www.rsc.org/images/entities/char_2009.gif) : :![[thin space (1/6-em)]](https://www.rsc.org/images/entities/char_2009.gif) γ-Al2O3) γ-Al2O3) |
Value of SIE when the highest removal efficiency is reached (J L−1) | Selectivity of CO2 when the highest removal efficiency is reached (%) | O3 concentration when the highest removal efficiency is reached (mg m−3) | NOx concentration when the highest removal efficiency is reached (mg m−3) |
|---|---|---|---|---|
1![[thin space (1/6-em)]](https://www.rsc.org/images/entities/char_2009.gif) : :![[thin space (1/6-em)]](https://www.rsc.org/images/entities/char_2009.gif) 1 1![[thin space (1/6-em)]](https://www.rsc.org/images/entities/char_2009.gif) : :![[thin space (1/6-em)]](https://www.rsc.org/images/entities/char_2009.gif) 1 1 |
207.8 | 58.87 | 2260 | 131.58 |
1![[thin space (1/6-em)]](https://www.rsc.org/images/entities/char_2009.gif) : :![[thin space (1/6-em)]](https://www.rsc.org/images/entities/char_2009.gif) 1 1![[thin space (1/6-em)]](https://www.rsc.org/images/entities/char_2009.gif) : :![[thin space (1/6-em)]](https://www.rsc.org/images/entities/char_2009.gif) 2 2 |
216.9 | 59.52 | 2010 | 128.56 |
1![[thin space (1/6-em)]](https://www.rsc.org/images/entities/char_2009.gif) : :![[thin space (1/6-em)]](https://www.rsc.org/images/entities/char_2009.gif) 2 2![[thin space (1/6-em)]](https://www.rsc.org/images/entities/char_2009.gif) : :![[thin space (1/6-em)]](https://www.rsc.org/images/entities/char_2009.gif) 1 1 |
189.7 | 69.32 | 2450 | 130.42 |
1![[thin space (1/6-em)]](https://www.rsc.org/images/entities/char_2009.gif) : :![[thin space (1/6-em)]](https://www.rsc.org/images/entities/char_2009.gif) 2 2![[thin space (1/6-em)]](https://www.rsc.org/images/entities/char_2009.gif) : :![[thin space (1/6-em)]](https://www.rsc.org/images/entities/char_2009.gif) 2 2 |
183.4 | 67.74 | 2180 | 117.66 |
2![[thin space (1/6-em)]](https://www.rsc.org/images/entities/char_2009.gif) : :![[thin space (1/6-em)]](https://www.rsc.org/images/entities/char_2009.gif) 1 1![[thin space (1/6-em)]](https://www.rsc.org/images/entities/char_2009.gif) : :![[thin space (1/6-em)]](https://www.rsc.org/images/entities/char_2009.gif) 1 1 |
205.8 | 42.31 | 3130 | 141.87 |
2![[thin space (1/6-em)]](https://www.rsc.org/images/entities/char_2009.gif) : :![[thin space (1/6-em)]](https://www.rsc.org/images/entities/char_2009.gif) 1 1![[thin space (1/6-em)]](https://www.rsc.org/images/entities/char_2009.gif) : :![[thin space (1/6-em)]](https://www.rsc.org/images/entities/char_2009.gif) 2 2 |
218.6 | 49.58 | 2790 | 127.41 |
2![[thin space (1/6-em)]](https://www.rsc.org/images/entities/char_2009.gif) : :![[thin space (1/6-em)]](https://www.rsc.org/images/entities/char_2009.gif) 2 2![[thin space (1/6-em)]](https://www.rsc.org/images/entities/char_2009.gif) : :![[thin space (1/6-em)]](https://www.rsc.org/images/entities/char_2009.gif) 1 1 |
210.1 | 54.56 | 3740 | 147.69 |
The results showed that the reactor with a discharge length ratio of 1![[thin space (1/6-em)]](https://www.rsc.org/images/entities/char_2009.gif) :
:![[thin space (1/6-em)]](https://www.rsc.org/images/entities/char_2009.gif) 2
2![[thin space (1/6-em)]](https://www.rsc.org/images/entities/char_2009.gif) :
:![[thin space (1/6-em)]](https://www.rsc.org/images/entities/char_2009.gif) 2 only needed 183.4 J L−1 of SIE when the removal efficiency reached the highest level, and the selectivity of CO2 was slightly lower than that of 1
2 only needed 183.4 J L−1 of SIE when the removal efficiency reached the highest level, and the selectivity of CO2 was slightly lower than that of 1![[thin space (1/6-em)]](https://www.rsc.org/images/entities/char_2009.gif) :
:![[thin space (1/6-em)]](https://www.rsc.org/images/entities/char_2009.gif) 2
2![[thin space (1/6-em)]](https://www.rsc.org/images/entities/char_2009.gif) :
:![[thin space (1/6-em)]](https://www.rsc.org/images/entities/char_2009.gif) 1 because the catalytic activity of γ-Al2O3 was lower than those of the other two, resulting in a decrease in the selectivity of CO2. At the same time, the O3 and NOx concentrations in this type of reactor were lower than in the other kinds of reactors when it reached the highest treatment efficiency. Compared with the Fe2O3/TiO2/γ-Al2O3-DBD reactor, the reactor with a discharge length ratio of 1
1 because the catalytic activity of γ-Al2O3 was lower than those of the other two, resulting in a decrease in the selectivity of CO2. At the same time, the O3 and NOx concentrations in this type of reactor were lower than in the other kinds of reactors when it reached the highest treatment efficiency. Compared with the Fe2O3/TiO2/γ-Al2O3-DBD reactor, the reactor with a discharge length ratio of 1![[thin space (1/6-em)]](https://www.rsc.org/images/entities/char_2009.gif) :
:![[thin space (1/6-em)]](https://www.rsc.org/images/entities/char_2009.gif) 2
2![[thin space (1/6-em)]](https://www.rsc.org/images/entities/char_2009.gif) :
:![[thin space (1/6-em)]](https://www.rsc.org/images/entities/char_2009.gif) 2 achieved 21.16% increased selectivity of CO2, the O3 output decreased by 26.9%, and the NOx content decreased by 9.1%.
2 achieved 21.16% increased selectivity of CO2, the O3 output decreased by 26.9%, and the NOx content decreased by 9.1%.
Effects of humidity on the processing efficiency
By comparing the toluene removal efficiencies of different reactors under different humidity levels, it could be found that the reactor loaded with γ-Al2O3 and the single DBD reactor showed a small increase when the humidity was 10–30% because H2O was decomposed into hydroxyl radicals in the DBD process to promote the decomposition of toluene molecules under an SIE of 200 J L−1. When the humidity was 30–90%, there was a sharp drop because too many H2O molecules could not undergo timely decomposition, which reduced the electron density and accelerated the demise of free radicals. At the same time, the presence of H2O molecules would compete with other groups to adsorb on the catalyst surface, reducing the number of active sites for toluene and O3 adsorption.32 The reactor loaded with TiO2 and Fe2O3 catalysts was less affected by humidity than the first two reactors, which proved that these two catalysts could break down more water molecules and had stronger catalytic activity (Fig. 18).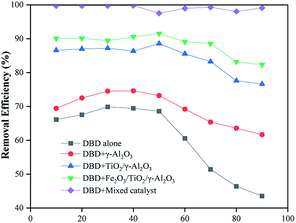 | ||
| Fig. 18 The relationships between humidity and removal efficiency in different types of DBD reactors. | ||
Regeneration of catalyst
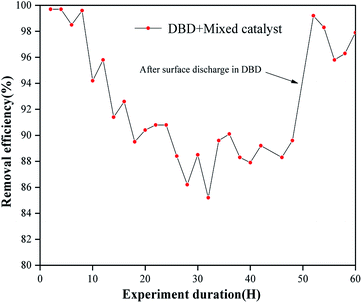
The research showed that after 48 hours of reaction, due to the accumulation of by-products on the surface of the catalyst, the carbon deposits produced gradually reduced the efficiency of the catalyst, and the treatment efficiency eventually dropped to about 88.6%. After 48 hours of use, there were carbon deposits on the surface; then, the different types of catalysts were placed in a DBD environment for surface discharge treatment for 2 hours. After surface discharge, it can be seen from Fig. 21 that the carbon deposits on the surface basically disappeared. From the SEM image (Fig. 20), it can be found that the small particles on the surface of the mixed catalyst still exist, and there is no obvious change in particle size; however, it can be seen from Fig. 20 that the surface of the catalyst became slightly rough and uneven, possibly due to corrosion by carbon deposits. The mixed catalyst was placed into the DBD reactor, and the test of the removal rate of toluene was continued. As shown in Fig. 19, the removal efficiency was basically restored.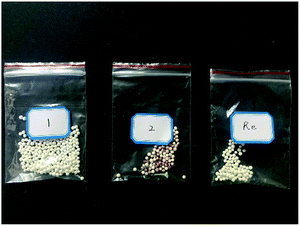 | ||
| Fig. 21 Photograph of Fe2O3/TiO2/γ-Al2O3 before use (1), after use (2), and after regeneration (Re). | ||
Conclusions
This study compared the removal rates, mineralization rates, SIE values and by-product outputs of different catalysts when synergizing DBD to treat toluene. Based on the value of SIE, the advantages and disadvantages of different catalysts to remove toluene were considered, and a mixed-catalyst synergistic DBD reaction was designed. Compared with the single catalyst and DBD treatment of toluene, a removal rate of more than 99.7% and CO2 selectivity of 67.74% were achieved under the conditions of an Fe2O3/TiO2/γ-Al2O3![[thin space (1/6-em)]](https://www.rsc.org/images/entities/char_2009.gif) :
:![[thin space (1/6-em)]](https://www.rsc.org/images/entities/char_2009.gif) TiO2/γ-Al2O3
TiO2/γ-Al2O3![[thin space (1/6-em)]](https://www.rsc.org/images/entities/char_2009.gif) :
:![[thin space (1/6-em)]](https://www.rsc.org/images/entities/char_2009.gif) γ-Al2O3 discharge length ratio of 1
γ-Al2O3 discharge length ratio of 1![[thin space (1/6-em)]](https://www.rsc.org/images/entities/char_2009.gif) :
:![[thin space (1/6-em)]](https://www.rsc.org/images/entities/char_2009.gif) 2
2![[thin space (1/6-em)]](https://www.rsc.org/images/entities/char_2009.gif) :
:![[thin space (1/6-em)]](https://www.rsc.org/images/entities/char_2009.gif) 2 and an SIE value of 183.4 J L−1, while the concentrations of O3 and NOx were reduced as well. In addition, the reactor in which the multiple catalysts worked together was stable under different humidity conditions, which indicates that this kind of reactor has the potential to remove toluene in a complex ambience.
2 and an SIE value of 183.4 J L−1, while the concentrations of O3 and NOx were reduced as well. In addition, the reactor in which the multiple catalysts worked together was stable under different humidity conditions, which indicates that this kind of reactor has the potential to remove toluene in a complex ambience.
Conflicts of interest
There are no conflicts to declare.Acknowledgements
This work was financially supported by the Anhui Provincial Science and Technology Major Special Project (17030801034).Notes and references
- K. Barbusinski, K. Kalemba, D. Kasperczyk, K. Urbaniec and V. Kozik, J. Clean. Prod., 2017, 152, 223–241 CrossRef CAS.
- B. Belaissaoui, Y. Le Moullec and E. Favre, Energy, 2016, 95, 291–302 CrossRef CAS.
- R. Hariz, J. I. del Rio Sanz, C. Mercier, R. Valentin, N. Dietrich, Z. Mouloungui and G. Hébrard, Chem. Eng. Sci., 2017, 157, 264–271 CrossRef CAS.
- C. Qin, X. Huang, J. Zhao, J. Huang, Z. Kang and X. Dang, J. Hazard. Mater., 2017, 334, 29–38 CrossRef CAS.
- W. Yang, H. Zhou, C. Zong, Y. Li and W. Jin, Sep. Purif. Technol., 2018, 200, 273–283 CrossRef CAS.
- B. Chen, L. Wu, B. Wu, Z. Wang, L. Yu, M. Crocker, A. Zhu and C. Shi, ChemCatChem, 2019, 11, 3646–3661 CrossRef CAS.
- Y. Liu, L. Lian, W. Zhao, R. Zhang and H. Hou, Plasma Sci. Technol., 2020, 22, 034016 CrossRef CAS.
- L. Zhou, C. Ma, J. Horlyck, R. Liu and J. Yun, Catalysts, 2020, 10, 668–717 CrossRef CAS.
- H. Yu, W. Hu, J. He and Z. Ye, Chemosphere, 2019, 237, 124439 CrossRef CAS.
- K. L. Pan and M. B. Chang, Environ. Sci. Pollut. Res. Int., 2019, 26, 12948–12962 CrossRef CAS.
- A. H. Khoja, M. Tahir and N. A. S. Amin, Energy Convers. Manage., 2019, 183, 529–560 CrossRef CAS.
- S. K. P. Veerapandian, N. De Geyter, J.-M. Giraudon, J.-F. Lamonier and R. Morent, Catalysts, 2019, 9, 98–138 CrossRef.
- L. Guo, N. Jiang, J. Li, K. Shang, N. Lu and Y. Wu, Front. Environ. Sci. Eng., 2018, 12, 15 CrossRef.
- M. F. Mustafa, X. Fu, Y. Liu, Y. Abbas, H. Wang and W. Lu, J. Hazard. Mater., 2018, 347, 317–324 CrossRef CAS.
- C. Norsic, J.-M. Tatibouët, C. Batiot-Dupeyrat and E. Fourré, Chem. Eng. J., 2018, 347, 944–952 CrossRef CAS.
- B. Wang, B. Chen, Y. Sun, H. Xiao, X. Xu, M. Fu, J. Wu, L. Chen and D. Ye, Appl. Catal. B Environ., 2018, 238, 328–338 CrossRef CAS.
- B. Wang, C. Chi, M. Xu, C. Wang and D. Meng, Chem. Eng. J., 2017, 322, 679–692 CrossRef CAS.
- X. Zhang, G. Zhang, Y. Wu and S. Song, AIP Adv., 2018, 8, 125109 CrossRef.
- X. Zhu, X. Gao, R. Qin, Y. Zeng, R. Qu, C. Zheng and X. Tu, Appl. Catal. B Environ., 2015, 170–171, 293–300 CrossRef CAS.
- X. Zhu, S. Liu, Y. Cai, X. Gao, J. Zhou, C. Zheng and X. Tu, Appl. Catal. B Environ., 2016, 183, 124–132 CrossRef CAS.
- B. Zhu, L.-Y. Zhang, M. Li, Y. Yan, X.-M. Zhang and Y.-M. Zhu, Chem. Eng. J., 2020, 381, 122599 CrossRef CAS.
- N. Jiang, Y. Zhao, K. Shang, N. Lu, J. Li and Y. Wu, J. Hazard. Mater., 2020, 393, 122365 CrossRef CAS.
- S. Li, X. Dang, X. Yu, G. Abbas, Q. Zhang and L. Cao, Chem. Eng. J., 2020, 388, 124275 CrossRef CAS.
- A. P. Roberts, Q. Liu, C. J. Rowan, L. Chang, C. Carvallo, J. Torrent and C.-S. Horng, J. Geophys. Res.: Solid Earth, 2006, 111, 35–51 Search PubMed.
- E. Y. Mora, A. Sarmiento, E. Vera, V. Drozd, A. Durigyn and S. Saxena, J. Phys.: Conf. Ser., 2017, 935, 012044 CrossRef.
- J. Ma, C. Zhu, J. Lu, H. Liu, L. Huang, T. Chen and D. Chen, Solid State Sci., 2015, 49, 1–9 CrossRef CAS.
- J. Chen, X. Chen, W. Xu, Z. Xu, J. Chen, H. Jia and J. Chen, Chem. Eng. J., 2017, 330, 281–293 CrossRef CAS.
- W. Liang, H. Sun, X. Shi and Y. Zhu, Catalysts, 2020, 10, 511 CrossRef CAS.
- X. Zhao, X. Liu, J. Liu, J. Chen, S. Fu and F. Zhong, J. Phys. D: Appl. Phys., 2019, 52, 145201 CrossRef.
- X. Yao, J. Zhang, X. Liang and C. Long, Chemosphere, 2019, 230, 479–487 CrossRef CAS.
- B. Zhu, L. Zhang, Y. Yan, M. Li and Y. Zhu, Plasma Sci. Technol., 2019, 21, 115503 CrossRef CAS.
- S. Li, X. Dang, X. Yu, R. Yu, G. Abbasd and Q. Zhang, J. Hazard. Mater., 2020, 400, 123259 CrossRef CAS.
| This journal is © The Royal Society of Chemistry 2020 |

