
 Open Access Article
 This Open Access Article is licensed under a Creative Commons Attribution-Non Commercial 3.0 Unported Licence
A useful preparation of ultrasmall iron oxide particles by using arc plasma deposition†
Yumi Ida a,
Atsushi Okazawa‡
b,
Kazutaka Sonobec,
Hisanori Muramatsuc,
Tetsuya Kambeac,
Takane Imaokaac,
Wang-Jae Chund,
Makoto Tanabe*a and
Kimihisa Yamamoto*ac
a,
Atsushi Okazawa‡
b,
Kazutaka Sonobec,
Hisanori Muramatsuc,
Tetsuya Kambeac,
Takane Imaokaac,
Wang-Jae Chund,
Makoto Tanabe*a and
Kimihisa Yamamoto*ac
aJST-ERATO, Yamamoto Atom Hybrid Project, Tokyo Institute of Technology, Yokohama 226-8503, Japan. E-mail: yamamoto@res.titech.ac.jp
bDepartment of Basic Science, Graduate School of Arts and Sciences, The University of Tokyo, Tokyo 153-8902, Japan
cLaboratory for Chemistry and Life Science, Tokyo Institute of Technology, Yokohama 226-8503, Japan
dGraduate School of Arts and Sciences, International Christian University, Mitaka, Tokyo 181-8585, Japan
First published on 14th November 2020
Abstract
Ultrasmall particles, different from the larger size nanoparticles, have recently attracted significant attention in the scientific community in nanotechnology for catalytic, electronic and optical applications; however, their magnetic properties remain unexplored due to the difficult structural analysis. A challenging issue is to develop a preparation method for iron oxide particles (IOPs) with fine size control, and to determine the dependence of magnetic properties on the morphology and crystallinity of the magnetic particles. However, synthetic approaches to obtain IOPs, regarded as one of the new fields of magnetic nanoparticles, have been significantly limited. This article reported a developed synthetic method to prepare IOPs on carbon supports using pulsed arc plasma deposition (APD) in flowing oxygen gas, which clarified the finely-controlled formation of IOPs on graphene nanosheets. Structural characterization of the IOPs revealed the formation of crystalline γ-Fe2O3 ultrasmall particles with oxygen deficiency. The pulsed APD method for IOPs is the first simple and convenient technique to not only prevent significant aggregation and contamination by organic compounds and avoid the need for thermal pretreatment, but also provide uniform crystalline nano-order particles.
Introduction
Magnetic iron oxide nanoparticles have attracted significant attention among the scientific community in nanotechnology and biotechnology for applications such as high-density magnetic storage media, magnetocaloric refrigeration and magnetic resonance imaging.1–3 The advantage of iron oxide nanoparticles relies on their chemical stability and biochemical suitability after the appropriate surface modification, which prevents the aggregation of the particles and provides the functionalization needed for nanomaterials and biomedicine.4,5 The rich arrangement of iron oxide polymorphs, including magnetite (Fe3O4), hematite (α-Fe2O3) and maghemite (γ-Fe2O3), exhibits unique magnetic properties tuneable by controlling their morphology and crystallinity.6,7 It is also important to probing the local environment of iron oxide particles in order to understand the magnetic properties depending on intrinsic or native defects.8,9 The most fundamental synthetic approach for iron oxide nanoparticles, i.e., the coprecipitation method, produces nanosized Fe3O4 particles from the mixing of ferrous (Fe2+) and ferric (Fe3+) materials,10 which are subsequently transformed into thermally stable γ-Fe2O3 via oxidation and, finally, converted to the most stable form, α-Fe2O3 at 450 °C.11 The synthetic methods for size-controlled iron oxide nanoparticles require careful selection of precursors, control of the temperature, and use of organic templates such as citric and oleic acids.12–19 However, since the large size nanoparticles to prepare of Fe3O4 or γ-Fe2O3 may remain mixed after annealing, it is extremely hard to obtain uniform iron oxide particles (IOPs) with tiny sized nanoparticles.Pulsed arc plasma deposition (APD) is a useful technique for the gram-scale and solvent-free synthesis of size-controlled metallic nanoparticles on various supports under direct and dry conditions, in contrast to the multi-step wet impregnation process.20,21 The biggest advantage of APD deposition is that it can prevent impurities from being mixed into the nanomaterials and achieve high dispersion of uniform particles on the supports by controlling the APD parameters, e.g., the number of arc plasma pulse shots, the discharge voltage, and the discharge condenser capacitance. The strong adherence of the nanoparticles on the supports due to the high energy discharge causes surface and interfacial anisotropy in the nanoparticles, which enhances electrochemical reactions22,23 and catalytic oxidation24–27 catalyzed by noble metals or their alloy nanoparticles. Magnetic Fe–Co alloy nanoparticles with large particle sizes (>3 nm), prepared by a pulsed APD method, formed non-spherical alloy grains with low crystallinity.28,29 Luo reported that an APD procedure using Fe atoms produced nanoparticles with sizes of 3.1 nm composed of a mixture of metallic Fe(0) and oxidized Fe(II) species due to surface oxidation.30 Therefore, the APD method has not been established for preparing metal oxide particles with uniform controlled oxidation states and crystalline morphology for oxophilic elements.
In this paper, we describe the first one-step preparation of size-controlled IOPs of highly crystalline γ-Fe2O3 using a pulsed APD method with O2 gas flowing, which are different from the ultrasmall Fe2O3 particles prepared by a liquid-phase synthetic method. The deposited particles without the need for an annealing techniques and chemical reagents revealed a single component on a two-dimensional carbon support, and enabled the retention of a particle size of less than 2 nm at high density.
Results and discussion
Fig. 1a and b illustrate the APD process with an oxygen gas flow (100 sccm) under vacuum, forming IOPs on three different carbon supports, i.e., Ketjen-black (KBm), graphene oxide (GOm), and graphene nanoplatelets (GNPm) (m represents the shot count number). Discharged Fe+ ions from an arc plasma gun are immediately oxidized to generate [FeOn]+ species, followed by landing on the supports and formation of iron oxide particles via their collection. A high dispersion of the IOPs was achieved by vigorous stirring of the carbon supports during the APD process. Fig. 1c summarizes the particle size estimated by high-angle annular dark-field scanning transmission electron microscopy (HAADF-STEM) observations and the Fe loading obtained from inductively coupled plasma atomic emission spectrometry (ICP-AES) analysis. A linear correlation of the Fe loading to the shot count ratio (shot count/weight of support), which was defined as shot count per mass of the carbon supports, was obtained for all the carbon supports (Tables 1 and S1†).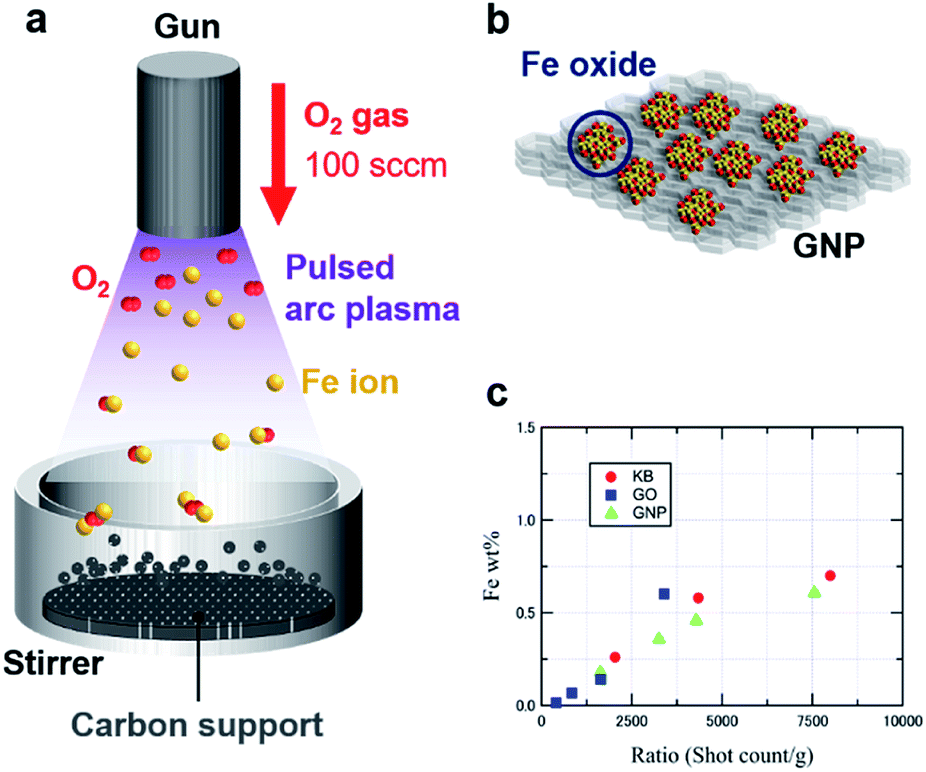 | ||
| Fig. 1 (a) Process for producing SIOPs using the APD method. (b) Model of the deposited SIOPs on carbon materials. (c) Plots of the Fe loadings versus the shot count ratios (shot count/weight of supports: g−1). | ||
| Sample | Shot count | Particle size [nm] | Fe loading [wt%] |
|---|---|---|---|
| KB200 | 200 | 1.39 ± 0.20 | 0.26 |
| KB400 | 400 | 2.30 ± 0.65 | 0.58 |
| KB800 | 800 | 3.02 ± 1.00 | 0.70 |
| KB2000 | 2000 | N/A | 2.18 |
| GO134 | 134 | N/A | 0.01 |
| GO267 | 267 | 0.75 ± 0.16 | 0.07 |
| GO534 | 534 | 1.25 ± 0.21 | 0.14 |
| GO1068 | 1068 | 1.15 ± 0.28 | 0.60 |
| GNP3666 | 3666 | 1.67 ± 0.24 | 0.18 |
| GNP7494 | 7494 | 1.93 ± 0.34 | 0.36 |
| GNP10900 | 10![[thin space (1/6-em)]](https://www.rsc.org/images/entities/char_2009.gif) 900 900 |
1.72 ± 0.50 | 0.46 |
| GNP18409 | 18409 |
2.48 ± 0.40 | 0.61 |
| GNP20000 | 20000 |
N/A | 1.45 |
Fig. 2 shows HAADF-STEM images of the IOPs on the three carbon materials. Iron oxide deposition on KB200 produced relatively large particles with diameters of 1.39 ± 0.20 nm, resulting in a low dispersion of the particles on Ketjen-black. Increasing the shot counts (KB400 and KB800) produced iron oxide nanoparticles with larger diameters of 2.30 ± 0.65 and 3.02 ± 1.00 nm due to their aggregation (Fig. S1†). In contrast, GO267 provided subnano-size particles of 0.75 ± 0.16 nm, together with the landing of single-atom particles on the GO surface. The nucleophilic oxygen atoms on the surface are assumed to cause a strong interaction with the cationic Fe+ or [FeOn]+ species. Increasing the shot count by factors of two and four (GO534 and GO1068) enlarged the particle sizes to about 1.25 nm (Fig. S2†). High dispersion of the IOPs was also achieved by using supports with a planar morphology with oxygen functional groups on the surface. The GNP were also suitable for deposition of the ultrasmall metal oxide particles with high density and high dispersion. The size of the deposited particle was also controlled in the range between 1.67 ± 0.24 (GNP3666) and 2.48 ± 0.40 (GNP18409) nm, depending on the shot count of the APD process (Fig. S3†). Further increases in the discharge count of Fe+ ions on GNP gave thin films on the surface (GNP20000; Fig. S4†).
 | ||
| Fig. 2 HAADF-STEM images and particle size histograms of (a) KB200, (b) GO534, and (c) GNP3666. | ||
X-ray photoelectron spectroscopy (XPS) measurements of the as-prepared IOPs revealed Fe 2p3/2 and 2p1/2 peaks in the range of 710.9–711.5 and 724.1–724.5 eV, respectively (Fig. 3), which are identified as Fe2O3 created by oxidation during the APD process, and considering the absence of any metal–support interaction among the three carbon supports (Fig. S5 and S6†). It was difficult to identify the IOPs by X-ray diffraction (XRD), due to low Fe loading amounts.
 | ||
| Fig. 3 XPS analysis of GNP10900. | ||
Fig. 4a shows Fe K-edge X-ray absorption near-edge structure (XANES) spectra of GNP10900 (0.46 wt%) and commercially available α-Fe2O3, γ-Fe2O3 and Fe3O4 standards as references. The absorption edge for GNP10900 at 7116.0 eV was located between those for 7114.5 eV for Fe3O4, with its mixed content of Fe2+ and Fe3+ species, and ∼7118 eV for α- and γ-Fe2O3, which contain iron in the Fe3+ state. The weak 1s → 3d pre-edge energy for GNP10900 at 7113.2 eV and the dipole-allowed 1s → 4p electron transition feature around 7131.7 eV are similar to the absorption peaks for γ-Fe2O3 (7113.1 and 7131.8 eV). The pre-edge curve analysis has been shown to be sensitive to the oxidation state of the iron species. The intensity of the pre-edge peak increases with decreasing coordination number of the iron center due to the loss of inversion symmetry.31 The γ-Fe2O3 structure contains oxygen lattice defects, so the pre-edge peak was analyzed as containing two components with an octahedral FeO6 geometry (Oh: transition energy from the T2g and Eg orbitals: 7112.6 and 7115.9 eV) and a coordinately unsaturated tetrahedral FeO4 geometry (Td: transition energy from the T2 orbital: 7113.8 eV). A Td ratio of 35% was estimated on the basis of the peak areas for Td and Oh (Fig. S7†). The pre-edge curve fitting for GNP10900 exhibited a major component with Td geometry (7113.4 eV) with a 67% ratio, compared to Oh geometry (7112.0 and 7116.0 eV). The Fourier transform of k3-weighted EXAFS spectra of GNP10900 in the k-space range of 3–16 Å−1, as shown in Fig. 4b, were also compared to those of α- and γ-Fe2O3. The former peaks for α- and γ-Fe2O3 in the first coordination shell (R = 1.0–1.9 Å) were attributed to the direct Fe–O bond. The latter second iron shells (2.1–3.8 Å) were suitable for the assignment of the Fe–Fe or the non-bonding Fe–O distances.32 The first Fe–O coordination shells for GNP10900 was slightly broadened and the magnitude for the second Fe–Fe and the long FeO distances significantly decreased compared to those for the α- and γ-Fe2O3 references, resulting from the formation of the IOPs. The curve fit results summarized in Table 2 suggested that the Fe–O bond distance for GNP10900 was 2.10 Å, which is slightly longer than the bond distances for the commercially available α- and γ-Fe2O3 of 2.06 and 2.05 Å, respectively. The reasonable identification of the small second shell was difficult due to the multicomponent at the surface of the ultrasmall particle.32 The XAFS results led to the conclusion that the as-prepared GNP10900 can be assigned as ultrasmall γ-Fe2O3 particles showing an increasing ratio of coordinately unsaturated Td geometry with decreasing particle size, which is different from the commercially available γ-Fe2O3 nanoparticles.
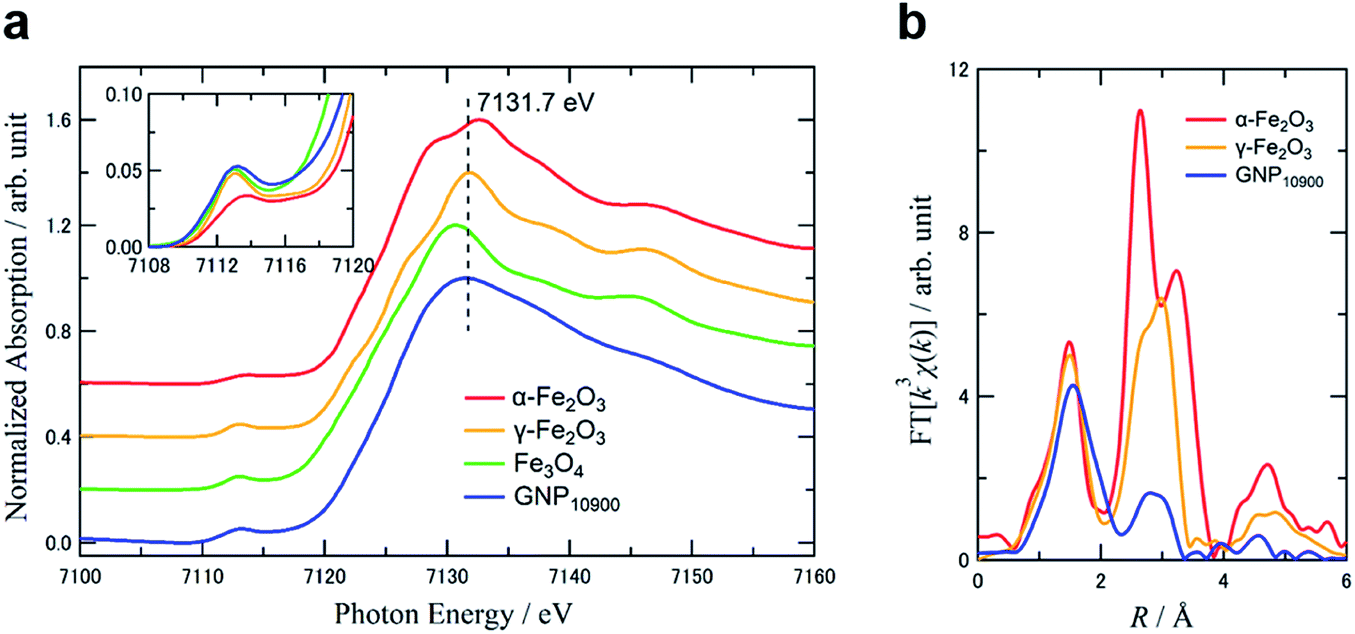 | ||
| Fig. 4 (a) Normalized XANES spectra of GNP10900 (blue), α-Fe2O3 (red), γ-Fe2O3 (yellow), and Fe3O4 (green). Inset shows the pre-edge peaks of all the samples. (b) Fourier transform of EXAFS spectra (k3: Δk = 3–16 Å−1). | ||
| Sample | N(Fe–O)b | r(Fe–O)c [Å] | ΔE0d [eV] | σ2/10−3e [Å] | Rff [%] |
|---|---|---|---|---|---|
| a Fourier transform and Fourier filtering regions for all the samples were limited to Δk = 3.0–16 Å−1 and Δr = 0.6–2.2 Å.b N, coordination number.c r, bond distance between absorber and backscatter atoms.d ΔE0, inner potential correction accounting for the difference in the inner potential between the sample and the reference.e σ2, the Debye–Waller factor (DW).f Rf (R-factor), goodness of curve fitting. | |||||
| α-Fe2O3 | 5.5 ± 0.4 | 2.06 ± 0.007 | 1.6 ± 1.4 | 3.7 ± 0.2 | 0.034 |
| γ-Fe2O3 | 5.3 ± 0.4 | 2.05 ± 0.008 | 3.3 ± 1.5 | 4.0 ± 0.2 | 0.039 |
| GNP10900 | 5.8 ± 0.5 | 2.10 ± 0.009 | 6.7 ± 1.5 | 5.7 ± 0.2 | 0.039 |
The electronic states of the iron oxides were also confirmed by the electron energy-loss spectroscopy (EELS) spectra of GNP20000 with 1.45 wt% film-like iron oxide loading (Fig. S8†). In the Fe L2,3-edge region, the Fe(III) peak at 707.9 eV showed almost the same energy loss for γ-Fe2O3, which was different from the full Fe(II) state at 705.9 eV of FeO used as a reference. The spectrum in the O K-edge spectrum was also different from that for the Fe(II) state. Interestingly, the Fe2O3 particles of smaller size (GNP1500, 0.29 wt%) showed a Fe(II) peak at 706.5 eV, which could be attributed to reduction from the Fe(III) state due to electron beam exposure during the EELS measurement.
57Fe Mössbauer spectroscopy is very effective at distinguishing iron(III) oxide polymorphs, and also provides an indication of magnetic states, such as superparamagnetism. Fig. 5 shows the Mössbauer spectra for the two samples GNP3666 and GNP10900, and the selected parameters of their isomer shift (IS) and quadrupole splitting (QS) are listed along with the data for reported nanoparticles of α- and γ-Fe2O3 (Table 3). All the obtained parameters are summarized in Table S2.† The spectra of GNP3666 and GNP10900 at 300 K display a clearly resolved doublet with IS values of 0.31 and 0.35 mm s−1 and QS values of 0.90 and 0.85 mm s−1, respectively, which correspond to the reported values for γ-Fe2O3 nanoparticles with an average diameter of 6.5 ± 2.1 nm (IS: 0.33 mm s−1, QS: 0.85 mm s−1)33 rather than those for nanosize α-Fe2O3 (IS: 0.30 mm s−1, QS: 0.68 mm s−1).34 Considering the Néel temperature (TN = ∼950 K) for the bulk γ-Fe2O3 samples, the absence of magnetic components in the spectra is indicative of the nanosize effect, due to faster superparamagnetic relaxation than the Mössbauer time window (τ ∼ 10−9). Upon cooling to 10 K, a broadened magnetic sextet appeared in the spectra of both GNP3666 and GNP10900 in addition to the remaining paramagnetic doublet. The hyperfine field (Hhyp) for the sextet reached about 40–45 T, which is slightly smaller than the expected value for the magnetically ordered Fe(III) state. For the 4.6 nm γ-Fe2O3 nanoparticles dispersed in polyvinyl alcohol, the magnetic hyperfine splits were completely saturated below 20 K, for which the Hhyp extended to ∼50 T.35 Therefore, the relatively small Hhyp and the residual paramagnetic component even at 10 K for GNP3666 and GNP10900 are attributable to superparamagnetic characteristics, demonstrating a particle size smaller than 4.6 nm, which is consistent with the results of the HAADF-STEM experiments. Additional Mössbauer measurements at various temperatures were hard to perform for GNP3666 and GNP10900 because of their low Fe-loading concentrations. On the other hand, variable-temperature Mössbauer measurements could be performed for GNP20000, which had a high Fe-loading ratio corresponding to a film-like deposition, affording a rough estimation of the superparamagnetic blocking temperature (for the Mössbauer time-scale) at 120–150 K (Fig. S9†). At 77 K, a paramagnetic doublet and a magnetic sextet also coexisted in the spectrum of GNP20000, which is similar to the spectra of GNP3666 and GNP10900 at 10 K. Subsequently, the doublet completely disappeared at 10 K in the spectrum of GNP20000 to convert the doublet into the sextet. These results rule out the possibility of the presence of another (super)paramagnetic component, as well as any Fe(II) species. Thus, the present nanoparticles prepared on GNP can be assumed to consist of a single component showing superparamagnetism.
 | ||
| Fig. 5 57Fe Mössbauer spectra measured of (a) GNP3666 and (b) GNP10900 at 300 and 10 K. The gray curve denotes the fitting curve, where the red and blue curves stand for the paramagnetic and magnetic components, respectively. | ||
Fig. 6a and b show the magnetization curves at 1.9 K for samples of GNPm with five different Fe loading weights from 0.18 to 1.45 wt%, as well as a reference of commercially available γ-Fe2O3 nanoparticles (<50 nm, 15 wt%) mounted on GNP. The saturation magnetization (Ms) per formula unit of Fe2O3 and coercivity (Hc) versus the particle size are summarized and plotted in Table 4, Fig. 6c and S10.† The temperature dependent magnetization of the GNPm are shown in Fig. S11.†
 | ||
| Fig. 6 Magnetization curves for γ-Fe2O3 nanoparticles deposited on the GNP series measured at 1.9 K, which indicate the magnetic moments per mole. (a) Magnetization curves ranging from −50 to 50 kOe. (b) Enlarged magnetization curves of GNP3666 and GNP10900. (c) Plots of the saturation magnetization (Ms) and coercivity (Hc) for the GNP series versus particle size. | ||
| Sample | Fe loading [wt%] | Particle size [nm] | Ms [NAμB] | Hc [Oe] |
|---|---|---|---|---|
| GNP3666 | 0.18 | 1.67 ± 0.24 | 0.73 | 202 |
| GNP7494 | 0.36 | 1.93 ± 0.34 | 1.27 | 129 |
| GNP10900 | 0.46 | 1.72 ± 0.50 | 0.87 | 282 |
| GNP18409 | 0.61 | 2.48 ± 0.40 | 1.44 | 302 |
| GNP20000 | 1.45 | N/A | 1.89 | 49 |
| γ-Fe2O3 | 15 | ≈50 | 1.99 | 296 |
The Ms values decreased gradually from 1.44 μB to 0.73 μB with decreasing particle size from 2.48 nm to 1.67 nm. The sample covered with a thin film of Fe2O3 (GNP20000) displayed the highest Ms value (1.89 μB), while the Hc value (49 Oe) was the lowest among the five prepared samples. These Ms values are evidently low compared to the ordered magnetic moment of 2.5 μB per formula unit for the bulk γ-Fe2O3,36,37 and such a size-dependent Ms decrease has been reported for some nanoparticles of γ-Fe2O3 prepared by other methods. This Ms decrease may be caused by the surface spin-canting effect and/or the internal order–disorder effect.38 The former is derived from spin glass-like behavior in the surface layer, and the latter is attributable to disorder of the Fe-site vacancies in the core to induce some canting of the magnetic moment, that is, Ms appears to be lower due to the imperfectly aligned magnetic moments. The Hc showed less dependence on the particle size, and appeared to be relatively constant (Fig. 6c). Disordered γ-Fe2O3 nanoparticles with a size of 2.7–8.7 nm exhibited a large coercivity of 500–1000 Oe at low temperatures,39 and decreasing particle size resulted in increased coercivity. This indicated the influence of the magnetic interaction between the surface and interior correlated with the particle shape. The magnitude of Hc depends on direct exchange interactions between the internal core spins and the magnetically frozen spins in the disordered surface layer.38 Therefore, the relatively low Hc for the present samples might be due to their higher crystallinity. The high crystallinity is also supported by the Ms values. The dependence of Ms and the size (4–10 nm) of the iron oxide particles with surface defects indicates that Ms monotonically decreases with particle size.40 Estimated by extrapolation of the monotonic decrease plot, Ms was 1.3–1.4 μB at 2 nm. This Ms value closely corresponds to the value of 1.27 μB for GNP7494 with low Hc.
To compare the magnetic properties of the IOPs obtained by the APD method, we tried preparing ultrasmall Fe2O3 particles by utilizing a liquid-phase synthetic method with a fourth-generation dendritic phenylazomethine (DPA G4) template acting as a ultrasmall-size template (Fig. S12†).41,42 The Fe60Ox@DPA G4/GNP (GNPFe60), prepared from the assembly of 60 eq. of FeCl3 to DPA G4 resulted in a particle size of 1.4 nm and a Fe(III) oxidation state (XPS data: Fe 2p3/2 = 711.0 eV), which were similar to the values for GNP3666 (1.67 nm and 711.1 eV). In contrast, the magnetization curve for GNPFe60 gave a significantly lower value of 0.41 μB compared to GNP3666 (0.73 μB) in spite of the similar particle sizes of GNPFe60 and GNP3666. The enhanced magnetization of the as-deposited GNP3666, compared to the amorphous Fe2O3 with a large particle size (∼3 nm, 0.57 μB)43 is attributed to the crystallinity of the ultrasmall γ-Fe2O3 particles.
Understanding the correlation between the morphology and size of particles and their magnetic parameters is very important for the development of magnetic materials, because magnetic iron oxide particles smaller than 20 nm have been recognized to have superparamagnetic properties. In this study, the APD method achieved the preparation of IOPs of less than 2 nm in size on planar structural graphene supports (GO and GNP), and the characterization results demonstrated the formation of a γ-Fe2O3-like structure without annealing at high temperature. For a particle size less than 2 nm, formation of the γ-phase is reasonable because the free energy G is lower than for the other potential phases (ε-, β-, and α-).44 The oxygen groups of GO serve as an anchor, where the deposited [FeOn]+ species are favorably adsorbed on the carbon materials, which prevents the migration and aggregation of the particles. In contrast, KB, with a higher specific surface area, exhibited weak adsorption toward the IOPs, enabling the particles to slide off to the edge of the support, promoting aggregation. Fig. 7 shows the models for the formation of IOPs on the carbon materials. Discharged Fe+ cations are immediately oxidized under flowing oxygen to form [FeOn]+ species, followed by landing and sliding together on the surface to form iron oxide cores during the initial stage (Fig. 7(1)). The [FeOn]+ species in the pulsed waves interact with the deposited iron oxide cores, growing pastille-shaped IOPs by stacking the FeO+ species on the Fe2O3 cores (Fig. 7(2)). The driving force for the crystalline γ-Fe2O3 particles is attributed to the high deposition energy generated by the pulsed collision, and the landing points are heated by the strong collision of FeO+ species on the carbon surface. Further shot counts led to occupation of the space on the islands of the iron oxide nanoparticles, providing the particles with higher density and creating large nanoparticles (Fig. 7(3)).
 | ||
| Fig. 7 Model for the growth of iron oxide nanoparticles on GNP. (1) Formation of iron oxide cores, (2) stacking of the FeO+ species on the Fe2O3 cores and (3) growing of the particles with higher density to create large size of the nanoparticles. | ||
The preparation method for IOPs has a significant effect on the structure and magnetic behavior of particles with similar sizes. The ultrasmall metal oxide synthesized using the DPA template showed amorphous characteristics,45–48 whereas the IOPs prepared by the gas-phase APD method exhibited high crystallinity. However, the Hc values for the IOPs in the GNP series were smaller than those for the γ-Fe2O3 nanoparticles of the same size and/or indicated little size dependence,38,39 because this difference would largely contribute to the amorphous nature of the particle surface. Increasing the shot count facilitates the vertical stacking of the iron oxide cores (Fig. 7(2)). This is the reason why GNP10900 with a larger shot count has smaller particles than GNP7494. The vertically grown IOPs contain a higher amount of surface defects than non-stacked particles of the same size. The defect structures on the surface would lead to enhanced coercivity due to the anisotropic energy being higher than the exchange interaction between the magnetic moments.38 The geometry of particles grown in-plane direction on carbon nanosheets involves a smaller amount of surface defects than the stacked structure, showing a partially ordered structure. Therefore, Hc decreases and Ms is close to the appropriate value (e.g., GNP7494). In the GNP series, the magnitudes of Hc and Ms are related to the particle shape and the structural distortion on the surface during the particle growth process. For particles growing toward the out-of-plane direction, the surface amorphous content of the particles determines the magnitude of Hc. In contrast, for particles growing toward the in-plane direction, the decrease in the amorphous content leads to an Ms value comparable to that for highly crystalline nanoparticles.
Conclusions
In summary, we demonstrated the preparation of ultrasmall γ-Fe2O3-like iron oxide particles on a GNP support without annealing at high temperature. The Fe loadings, obtained from the ICP-AES results, were proportional to the shot count on all the carbon supports. The HAADF-STEM images displayed the presence of IOPs with sizes of less than 2 nm, which were successfully prepared on graphene carbon nanosheets such as GO and GNP. The obtained γ-Fe2O3 on GNP was carefully characterized by XPS, Mössbauer, and XAFS spectral analysis. The particle growth on GNP increased two magnetic parameters related to the direction; one is an in-plane direction for Ms and the other is an out-plane direction for Hc. The APD method is useful for the preparation of size-controlled IOPs in the case of graphene derivatives with a two-dimensional structure. The use of GO as a support led to the successful preparation of iron oxide nanoparticles with sizes of about 1 nm even when the Fe loading was increased. The size change for the nanoparticles with Fe loading was also small for the GNP samples. This small change in particle size was characteristic of these graphene analogues with smooth surfaces, unlike the KB series with large particle size changes. Therefore, the use of graphene analogues enabled high-density and high-dispersion deposition while maintaining a small particle size. Moreover, the desired particle size could be achieved by finding the appropriate amount of support. This novel dry process provides a convenient and simple method to synthesize magnetic clusters without annealing.Experimental section
Materials
All chemical reagents and dehydrated solvents were used without further purification. Dehydrated chloroform was purchased from FUJIFILM Wako Pure Chemical Co. Methanol, dehydrated acetonitrile, and sodium borohydride (NaBH4) were purchased from Kanto Chemical Co., Inc. Iron chloride(III) (FeCl3) and sodium triethylborohydride (NaBEt3H, 1.0 M in toluene) were purchased from Sigma-Aldrich. The iron oxides (α-, γ-) used as the standard samples were purchased from FUJIFILM Wako Pure Chemical Co. and Sigma-Aldrich, respectively. The carbon supports, graphene oxide (GO) and graphene nanoplatelets (GNP) were purchased from Sigma-Aldrich, and Ketjen-black (KB) was obtained from Lion Specialty Chemicals Co., Ltd. The carbon supports were pretreated to remove metallic impurities, with the following procedure described as representative. GNP (2.5 g) was washed with an HCl aqueous solution (300 mL, 3 mol L−1) under ultrasonication for 2 h, followed by filtration and washing with ultrapure water. The GNP was then washed with methanol (100 mL) and dried in vacuo at 200 °C immediately before use. A fourth-generation phenylazomethine dendrimer with a tetraphenylmethane core (DPA G4) was synthesized according to a previously reported method.49Overview of experimental and measurement equipment
The IOPs on carbon supports were prepared using an APD-P instrument (Advance Riko, Inc.). The prepared IOPs were characterized by inductively coupled plasma atomic emission spectroscopy (ICP-AES; ICPS-8100, Shimadzu Co.), X-ray photoelectron spectroscopy (XPS; ESCA-3400, Shimadzu Co. and, spectra analysis by using Igor macro50), X-ray absorption fine structure (XAFS, BL12C, KEK), Mössbauer spectroscopy (Model 220; Topologic Systems), and high-angle annular dark-field scanning transmission electron microscopy (HAADF-STEM; JEM-ARM200F, JEOL, Ltd.) operated at 80 kV. The electron energy-loss spectroscopy (EELS; GIF Quantum ER, Gatan, Inc.) was performed using a NEOARM atomic resolution TEM system (JEOL Ltd.) with an accelerating voltage of 60 kV. The magnetization measurements were performed using a SQUID magnetometer (MPMS-XL5, Quantum Design, Inc.).Arc plasma deposition (APD) method
The IOPs supported on KB, GO and GNP were prepared using a pulsed APD method under reduced pressure (0.9 Pa). These carbon materials were stirred in a cup during the deposition process, and IOPs were continuously formed at an oxygen gas flow rate of 100 sccm. The discharge voltage was 100 V, and the discharge count was varied from 134 to 20000 shots to deposit Fe from 0.18 to 2.18 wt%. These samples were labeled according to the shot count for each carbon support; e.g., KB200, the support was Ketjen-black deposited with 200 shots. The others are the same as described.
XAFS measurements
XAFS was measured in a transmission mode at the BL12C beamlines at the High Energy Accelerator Research Organization Institute of Materials Structure Science Photon Factory (KEK-IMSS-PF). Synchrotron radiation from the storage ring was monochromatized with Si(111) channel-cut crystals. The angle of the monochromator was calibrated using Fe foil. The ionization chambers, as detectors to monitor the incident (I0) and transmitted X-rays (I), were filled with N2 and 15% Ar–85% N2 mixed gas for the Fe K-edge XAFS, respectively. All measurements were conducted at room temperature. The 1s → 3d pre-edge curve analysis was carried out by using XANES dactyloscope freeware.51 EXAFS curve fitting results were obtained by using REX2000 package (Rigaku Co., Japan). The theoretical phase shifts and the amplitude functions for Fe–O used in the fitting routine were calculated on the basis of the commercially available α-Fe2O3 powder.57Fe Mössbauer spectroscopy
The 57Fe Mössbauer spectra were measured using a conventional Mössbauer spectrometer (Topologic Systems) in transmission mode with a 57Co/Rh γ-ray source. Low-temperature measurements were performed using a CryoMini/CryoStat cryogenic refrigerator (Iwatani Industrial Gases Corp.). The samples were placed in a copper holder and the spectra were calibrated using α-Fe foil as a reference at room temperature. Spectral fitting was carried out using the MossWinn 4.0 program.52Magnetic properties
Magnetization curves were measured using a Quantum Design SQUID magnetometer (MPMS-XL5) from −50 to 50 kOe at 1.9 K. The samples were held in a gelatin capsule. The iron oxide nanoparticles supported on GNP were fixed in a small amount of n-eicosane due to the high magnetic field during the measurements. The temperature was increased at 320 K to melt the n-eicosane. The magnetic responses were corrected with diamagnetic blank data for the sample holder, such as the gelatin capsule, GNP, and n-eicosane. The essential data were subtracted from the diamagnetic blank, which is the net weight of GNP from the ICP-AES analysis results.Liquid-phase synthesis of Fe60Ox@DPA G4/GNP
The liquid-phase procedure was performed in an inert-gas-filled glove box. To the mixed solution (95 mL, acetonitrile:chloroform = 1:1) containing DPA G4 (3.2 mg, 3.0 μmol L−1), 60 eq. of FeCl3 in acetonitrile solution (5.4 μL, 3.2 mmol L−1) was added. The solution changed from light yellow to dark yellow, and was stirred for 0.5 h. Excess NaBH4 in methanol (3240 μL, 0.30 mol L−1) was added dropwise to the FeCl3–DPA G4 solution for chemical reduction to form dendrimer-encapsulated Fe60 particles (Fe60@DPA G4). To the solution of Fe60@DPA G4, GNP (210 mg) dispersed in acetonitrile (50 mL) was immediately added, then the mixture was stirred for 2 h for immobilization. The heterogeneous suspension was oxidized by air exposure and further stirred for 1.5 h. The solvent was partly evaporated and the immobilized support was filtered off, washed with methanol, and dried in vacuo overnight to yield Fe60Ox@DPA G4/GNP.
Conflicts of interest
There are no conflicts to declare.Acknowledgements
This study was supported by JST ERATO Grant Numbers JPMJER1503, Japan (K. Y.), Grant-in-Aid for Scientific Research (S) KAKENHI 15H05757 (K. Y.), and Grant-in-Aid for Early-Career Scientists, KAKENHI 18K14084 (Y. I.). The authors are thankful to Mr H. Tanaka (Advance Riko, Inc.) for preparation of the IOPs on carbon supports and Ms M. Morita for her support during the STEM-EELS experiments. The authors also thank our colleagues in the Suzukakedai Materials Analysis Division, Technical Department, Tokyo Institute of Technology, for performing ICP analysis. XAFS measurements were conducted at the BL12C beamlines of the High Energy Accelerator Research Organization—Institute of Materials Structure Science—Photon Factory (KEK-IMSS-PF) under the approval of the Photon Factory Advisory Committee (Proposal numbers 2019G655 and 2019G089).References
- D. Ling, N. Lee and T. Hyeon, Acc. Chem. Res., 2015, 48, 1276–1285 CrossRef CAS.
- W. Wu, Z. Wu, T. Yu, C. Jiang and W.-S. Kim, Sci. Technol. Adv. Mater., 2015, 16, 023501 CrossRef.
- W. Wu, C. Z. Jiang and V. A. L. Roy, Nanoscale, 2016, 8, 19421–19474 RSC.
- N. Zhu, H. Ji, P. Yu, J. Niu, M. U. Farooq, M. W. Akram, I. O. Udego, H. Li and X. Niu, Nanomaterials, 2018, 8, 810 CrossRef.
- W. Ling, M. Wang, C. Xiong, D. Xie, Q. Chen, X. Chu, X. Qiu, Y. Li and X. Xiao, J. Mater. Res., 2019, 34, 1828–1844 CrossRef CAS.
- R. M. Cornell and U. Schwertmann in The iron oxides: structure, properties, reactions, occurrences and uses, Wiley-VCH, Weinheim, 2nd edn, completely revised and extended edition, 2003 Search PubMed.
- S. Laurent, D. Forge, M. Port, A. Roch, C. Robic, L. Vander Elst and R. N. Muller, Chem. Rev., 2008, 108, 2064–2110 CrossRef CAS.
- J.-M. Li, A. C. H. Huan, L. Wang, Y.-W. Du and D. Feng, Phys. Rev. B: Condens. Matter Mater. Phys., 2000, 61, 6876–6878 CrossRef CAS.
- J.-M. Li, X.-L. Zeng and Z.-A. Xu, Appl. Phys. Lett., 2013, 103, 232410 CrossRef.
- R. Massart, IEEE Trans. Magn., 1981, 17, 1247–1248 CrossRef.
- H. Shokrollahi, J. Magn. Magn. Mater., 2017, 426, 74–81 CrossRef CAS.
- W. Wu, Q. He and C. Jiang, Nanoscale Res. Lett., 2008, 3, 397–415 CrossRef CAS.
- M. I. Dar and S. A. Shivashankar, RSC Adv., 2014, 4, 4105–4113 RSC.
- J. Park, K. An, Y. Hwang, J.-G. Park, H.-J. Noh, J.-Y. Kim, J.-H. Park, N.-M. Hwang and T. Hyeon, Nat. Mater., 2004, 3, 891–895 CrossRef CAS.
- P. Guardia, A. Labarta and X. Batlle, J. Phys. Chem. C, 2011, 115, 390–396 CrossRef CAS.
- A. Demortière, P. Panissod, B. P. Pichon, G. Pourroy, D. Guillon, B. Donnio and S. Bégin-Colin, Nanoscale, 2011, 3, 225–232 RSC.
- H. Yun, X. Liu, T. Paik, D. Palanisamy, J. Kim, W. D. Vogel, A. J. Viescas, J. Chen, G. C. Papaefthymiou, J. M. Kikkawa, M. G. Allen and C. B. Murray, ACS Nano, 2014, 8, 12323–12337 CrossRef CAS.
- Z. Cheng, Q. Fu, H. Duan, Z. Cui, Y. Xue and W. Zhang, Ind. Eng. Chem. Res., 2019, 58, 8418–8425 CrossRef CAS.
- S. Kamali, C. J. Chen, B. Bates, C. E. Johnson and R. K. Chiang, J. Phys.: Condens. Matter, 2020, 32, 015302 CrossRef CAS.
- S. Hinokuma, S. Misumi, H. Yoshida and M. Machida, Catal. Sci. Technol., 2015, 5, 4249–4257 RSC.
- S. H. Kim, S.-Y. Moon and J. Y. Park, Top. Catal., 2017, 60, 812–822 CrossRef CAS.
- S. Takahashi, N. Takahashi, N. Todoroki and T. Wadayama, ACS Omega, 2016, 1, 1247–1252 CrossRef CAS.
- S. Takahashi, H. Chiba, T. Kato, S. Endo, T. Hayashi, N. Todoroki and T. Wadayama, Phys. Chem. Chem. Phys., 2015, 17, 18638–18644 RSC.
- T. Fujitani, I. Nakamura, T. Akita, M. Okumura and M. Haruta, Angew. Chem., Int. Ed., 2009, 48, 9515–9518 CrossRef CAS.
- M. Sadakiyo, S. Yoshimaru, H. Kasai, K. Kato, M. Takata and M. Yamauchi, Chem. Commun., 2016, 52, 8385–8388 RSC.
- S. M. Kim, H. Lee, K. C. Goddeti, S. H. Kim and J. Y. Park, J. Phys. Chem. C, 2015, 119, 16020–16025 CrossRef CAS.
- H. Yoshida, S. Misumi, A. Matsumoto, Y. Kuzuhara, T. Sato, J. Ohyama and M. Machida, Catal. Sci. Technol., 2019, 9, 2111–2117 RSC.
- D. Horiyama, M. Matsuura, T. Yamamoto, N. Tezuka and S. Sugimoto, Mater. Trans., 2016, 57, 207–211 CrossRef CAS.
- M. Sadakiyo, M. Heima, T. Yamamoto, S. Matsumura, M. Matsuura, S. Sugimoto, K. Kato, M. Takata and M. Yamauchi, Dalton Trans., 2015, 44, 15764–15768 RSC.
- X. Luo, J. Lu, E. Sohm, L. Ma, T. Wu, J. Wen, D. Qiu, Y. Xu, Y. Ren, D. J. Miller and K. Amine, Nano Res., 2016, 9, 1913–1920 CrossRef CAS.
- T. E. Westre, P. Kennepohl, J. G. DeWitt, B. Hedman, K. O. Hodgson and E. I. Solomon, J. Am. Chem. Soc., 1997, 119, 6297–6314 CrossRef CAS.
- J. Zhao, F. E. Huggins, Z. Feng, F. L. Lu, N. Shah and G. P. Huffman, J. Catal., 1993, 143, 499–509 CrossRef CAS.
- Sarveena, J. M. Vargas, D. K. Shukla, C. T. Meneses, P. M. Zélis, M. Singh and S. K. Sharma, Phys. Chem. Chem. Phys., 2016, 18, 9561–9568 RSC.
- W. Kündig, H. Bömmel, G. Constabaris and R. H. Lindquist, Phys. Rev., 1966, 142, 327–333 CrossRef.
- E. Tronc, A. Ezzir, R. Cherkaoui, C. Chanéac, M. Noguès, H. Kachkachi, D. Fiorani, A. M. Testa, J. M. Grenèche and J. P. Jolivet, J. Magn. Magn. Mater., 2000, 221, 63–79 CrossRef CAS.
- J. M. D. Coey, Phys. Rev. Lett., 1971, 27, 1140–1142 CrossRef CAS.
- H. Batis-Landoulsi and P. Vergnon, J. Mater. Sci., 1983, 18, 3399–3403 CrossRef CAS.
- M. P. Morales, S. Veintemillas-Verdaguer, M. I. Montero, C. J. Serna, A. Roig, L. Casas, B. Martínez and F. Sandiumenge, Chem. Mater., 1999, 11, 3058–3064 CrossRef CAS.
- D. Fiorani, A. M. Testa, F. Lucari, F. D'Orazio and H. Romero, Phys. B, 2002, 320, 122–126 CrossRef CAS.
- S. R. Cooper, L. K. Plummer, A. G. Cosby, P. Lenox, A. Jander, P. Dhagat and J. E. Hutchison, Chem. Mater., 2018, 30, 6053–6062 CrossRef CAS.
- K. Yamamoto and T. Imaoka, Acc. Chem. Res., 2014, 47, 1127–1136 CrossRef CAS.
- K. Yamamoto, T. Imaoka, M. Tanabe and T. Kambe, Chem. Rev., 2020, 120, 1397–1437 CrossRef.
- L. Machala, R. Zboril and A. Gedanken, J. Phys. Chem. B, 2007, 111, 4003–4018 CrossRef CAS.
- S. Sakurai, A. Namai, K. Hashimoto and S. Ohkoshi, J. Am. Chem. Soc., 2009, 131, 18299–18303 CrossRef CAS.
- Y. Inomata, K. Albrecht and K. Yamamoto, ACS Catal., 2018, 8, 451–456 CrossRef CAS.
- Y. Inomata, K. Albrecht, N. Haruta and K. Yamamoto, Chem. Mater., 2019, 31, 8373–8382 CrossRef CAS.
- A. Kuzume, M. Ozawa, Y. Tang, Y. Yamada, N. Haruta and K. Yamamoto, Sci. Adv., 2019, 5, 1–8 Search PubMed.
- K. Sonobe, M. Tanabe and K. Yamamoto, ACS Nano, 2020, 14, 1804–1810 CrossRef CAS.
- O. Enoki, H. Katoh and K. Yamamoto, Org. Lett., 2006, 8, 569–571 CrossRef CAS.
- O. Lytken, EccentricXPS for free on Igor Exchange, http://www.wavemetrics.com/project/EccentricXPS Search PubMed.
- K. V. Klementiev, XANES dactyloscope for Windows, freeware, http://www.cells.es/Beamlines/CLAESS/software/xanda.html Search PubMed.
- Z. Klencsár, E. Kuzmann and A. Vértes, J. Radioanal. Nucl. Chem., 1996, 210, 105–118 CrossRef.
Footnotes |
| † Electronic supplementary information (ESI) available. See DOI: 10.1039/d0ra07443h |
| ‡ Present address: Division of Chemistry, Institute of Liberal Education, Nihon University School of Medicine, Tokyo 173-8610, Japan. |
| This journal is © The Royal Society of Chemistry 2020 |