 Open Access Article
Pretreatment by recyclable Fe3O4@Mg/Al-CO3-LDH magnetic nano-adsorbent to dephosphorize for the determination of trace F− and Cl− in phosphorus-rich solutions
Si Chenab,
Yongchun Xuab,
Yu Tangab,
Wei Chen *ab,
Shubin Chenab,
Lili Huab and
Georges Boulon
 c
c
aKey Laboratory of Materials for High Power Laser, Shanghai Institute of Optics and Fine Mechanics, Chinese Academy of Sciences, Shanghai 201800, China. E-mail: weichen@siom.ac.cn
bCenter of Materials Science and Optoelectronics Engineering, University of Chinese Academy of Sciences, Beijing 100049, China
cInstitut Lumière Matière (ILM), UMR5306 CNRS-Université Claude Bernard Lyon 1, Université de Lyon, 69622 Villeurbanne, France
First published on 16th December 2020
Abstract
The magnetic nano-adsorbent Fe3O4@Mg/Al-CO3-LDH (Mg/Al-type layered double hydroxide) with a CO32− interlayer anion has been synthesized successfully on Fe3O4 nanoparticles via a urea hydrothermal method. It is confirmed that the nano-adsorbent can adsorb PO43− rapidly and efficiently in multi-ion solutions; meanwhile, it did not adsorb any F− and Cl−, even with a high amount of the nano-adsorbent or a longer adsorption time. This behaviour is beneficial for applications to remove PO43− in phosphorus-rich solutions, and especially can be utilized to determine trace F− and Cl− anions in phosphorus-rich solutions by physical and chemical analysis methods including ion chromatography without serious interference from PO43− for trace determinations. Herein, the hydrothermally synthesized Fe3O4@Mg/Al-CO3-LDH was characterized via SEM, TEM, SAED, XRD, FTIR, magnetic hysteresis loop analysis and adsorption–desorption isotherm analysis. The structure and stability, adsorption mechanism, magnetic saturation value, specific surface area, total pore volume, phosphate adsorption capacity and recyclability are discussed. Using the optimized pretreatment conditions, Fe3O4@Mg/Al-CO3-LDH was utilized successfully to adsorb PO43− in real samples and determine trace F− and Cl− accurately by ion chromatography; this would be very beneficial for continuous analysis and on-line tests by physical and chemical analysis methods without interference from PO43− in phosphorus-rich samples, leaving F− and Cl− even if in a trace content.
1 Introduction
Currently, phosphate materials or its hybrid materials, presented as crystal, glass or ceramics, are widely applied1 in numerous fields such as optics and electronics, as well as medical biomaterials for applications2 in bone grafting and regeneration, drug delivery, etc. However, in the determination of target ions in solutions containing these materials, the matrix phosphate anion PO43− seriously interferes in determinations by methods such as spectrophotometry,3 neutron activation,4 molecular absorption spectrometry,5 graphite furnace,6 electrothermal atomic absorption spectrometry,7 and inductively coupled plasma mass spectrometry.8 To determine anion impurities, the commonly used chromatography method will be affected seriously by interference from the phosphate anion. The signal from a high concentration PO43− will cover the peak or deform the peak shape of the target anion.9–11 Furthermore, it will make the analytical column overloaded, which will shorten the service life of the column. Once the analytical column is overloaded, a ghost peak will appear, or the next injection may not even be allowed.11 Although solutions with a high concentration of PO43− can be diluted greatly, this also reduces the content of the target anion, leading to a content much lower than the detection limit.10 After fully rinsing the loops11 of the chromatograph for several runs using deionized water, a certain amount of PO43− as carryover resulting from the previous injection may still be observed even if a blank sample is used. Therefore, an appropriate sample pretreatment to dephosphorize solutions with a high PO43− content is particularly important.10,11A further issue is specifically related to the determination of trace F− and Cl− anions in phosphorus-rich solutions. If F− anions from the raw materials and products of the phosphate industry such as from phosphate ore, phosphate fertilizer, phosphogypsum enter the biological chain continuously during manufacturing processes, storage and utilization, the bioaccumulated F− will pose a serious threat to human life. Thus, it is necessary to monitor trace F− and Cl− anions in phosphorus-rich raw materials and final products.12 Moreover, hydroxyapatite is a particularly promising bone-grafting material for dental and orthopaedic applications. The addition of trace F− can construct a microenvironment favouring bone healing and bone regeneration,13 but its trace amount must be strictly controlled to avoid cell death or necrosis.14 Thus, all the above-mentioned factors make the accurate determination of trace F− and Cl− in phosphorus-rich solutions necessary, with the aim to fully keep F− and Cl− and adsorb PO43− as much as possible during the pretreatment, which should be developed.
Layered double hydroxides (LDHs) are two-dimensional nanostructured anionic clays, with the general formula of [M1−x2+Mx3+(OH)2]x+[Ax/nn−yH2O]x−, where M is a metal cation and A is the interlayer anion with n-valence.15,16 Strong chemical bonds exist within the layer of [M1−x2+Mx3+(OH)2]x+, but the bonds between the interlayer anion of [Ax/nn−yH2O]x− and the layer of [M1−x2+Mx3+(OH)2]x+ are relatively weak. This makes LDHs promising ion-exchangers17 for applications to adsorb the PO43− anion.17–30
To efficiently adsorb PO43−, the interlayer anion choice will play a key role. Based on LDHs, there are some good options to use the Cl− anion,17,20,22–24,31 or NO3− anion,19,21,32 or Cl− and SO42− anions25 as the interlayer anion. They can be used to adsorb PO43− effectively, but their adsorption efficiencies are inevitably affected by carbon dioxide (CO2) or carbonate (CO32−) from the preparation process of the LDH, the solution environment and even the atmosphere.17,19,25
Employing CO32− as the interlayer anion, Zn–Al-LDH,18 Zr-modified MgFe-LDH(CO3),27 Fe3O4@Mg–Al-LDH,26 Mg–Fe LDH28 and Fe3O4@gelatin-encapsulated hydrotalcite33 were prepared to adsorb PO43− successfully by a co-precipitation method. By comparison, the hydrothermal method is a better way to prepare LDH with the CO32− interlayer anion using urea, which can well control the size and crystallinity of the prepared nanoparticle.15 In the investigations for the preparation of LDH with CO32− via the urea hydrolysis method,29,30,34–54 only two LDHs have been used as a phosphate adsorbent.29,30 Cu–Al LDH (CuAl/biomass carbon fibre-layered double hydroxide)29 was synthesized at 110 °C for 12 h, and Zn–Al LDHs30 were synthesized at 150 °C for 36 h.
Herein, an Mg–Al LDH was hydrothermally synthesized with Mg(NO3)2, Al(NO3)3, and urea, using CO32− as the interlayer anion. To utilize magnetic solid phase extraction (MSPE), which can achieve the purpose of phosphate adsorption and its rapid separation, Fe3O4 magnetic nanoparticles were introduced into the Mg–Al LDH nano-adsorbent during the hydrothermal synthetic process. Using the prepared Fe3O4@Mg/Al-CO3-LDH magnetic nano-adsorbent, adsorption–determination and recycle procedures were conducted, as described in Section 2.3. As described in Section 3.1, its structural properties were characterized via SEM, TEM, FTIR, and XRD, and its magnetic property, specific surface area, and porosity were also analysed. After optimizing the pretreatment conditions, as discussed in Section 3.2, the stability and recyclability after 15 cycles with high adsorption capacity is shown in Section 3.3. More importantly, it was found that the hydrothermally synthesized Fe3O4@Mg/Al-CO3-LDH magnetic nano-adsorbent only adsorbed PO43−, not F− and Cl− in solution. This is undoubtedly beneficial to accurately determine the content of F− and Cl− in phosphate solutions by chromatography, and the practical applications are introduced in Section 4.
2 Experimental
2.1 Hydrothermally synthesized Fe3O4@Mg/Al-CO3-LDH
The magnetic layered double hydroxide nano-adsorbent Fe3O4@Mg/Al-CO3-LDH was synthesized via a urea hydrothermal method. After several trials, 0.6 g of Fe3O4 nanoparticles (ultrafine powder purchased from Macklin) was used and added to 15 mL solution of 0.1 mol L−1 NaOH (AR grade). After the mixture was dispersed by ultrasonication for 10 min, it was separated using a magnet for further use. Then 2.044 g Mg(NO3)2·6H2O (AR grade), 1.500 g Al(NO3)3·9H2O (AR grade), and 1.68 g urea (CH4N2O, AR grade) were added to 70 mL deionized water (Millipore Milli-Q Direct 8). The mixed salt solution was further mixed using a vortex mixer (NP-30S) for 15 min. The activated Fe3O4 and mixed salt solution were transferred to an autoclave and mixed for 2 h using the vortex mixer. Then the autoclave was heated at 120 °C for 12 h. Next, the autoclave was cooled to room temperature. The obtained product was separated by a magnet and washed with deionized water and ethanol (AR grade) three times, followed by drying in an oven at 60 °C for 12 h. Finally, the Fe3O4@Mg/Al-CO3-LDH magnetic nano-adsorbent was obtained.2.2 Instruments
SEM analysis was performed using an Inspect F50 field-emission scanning electron microscope (FEI) with a resolution of 2.0 nm. An acceleration voltage of 10 kV was applied during secondary electron imaging.TEM analysis was performed using a JEM-2100F high-resolution field-emission transmission electron microscope (JEOL) with a point resolution of 0.24 nm and line resolution of 0.10 nm. To observe the morphology of the nanoparticles, the bright-field mode was utilized. To observe the electron diffraction from different regions on the nanoparticle, the selected area mode was utilized. An acceleration voltage of 200 kV was applied for both modes. The nanoparticles were dispersed by ethanol to form a suspending liquid before observation.
FTIR spectra were measured using a Nicolet Nexus Fourier transform infrared spectrometer (Thermo Fisher), in the range of 4000 to 400 cm−1 with a resolution of 4 cm−1. The nanoparticles were mixed with KBr (SP grade) in the mass ratio of 1![[thin space (1/6-em)]](https://www.rsc.org/images/entities/char_2009.gif) :
:![[thin space (1/6-em)]](https://www.rsc.org/images/entities/char_2009.gif) 100. After grinding in an agate mortar, the mixture was pressed into a thin disc sample.
100. After grinding in an agate mortar, the mixture was pressed into a thin disc sample.
XRD patterns were collected using a SmartLab9 X-ray diffractometer (Rigaku) with Cu-Kα radiation of λ = 0.15418 nm in the 2θ range of 0.08–78° with the scanning step of 0.02° and the step time of 2 s.
Magnetic hysteresis loop analysis was performed using a SQUID vibrating sample magnetometer (Quantum Design) in the magnetic field range of ±30![[thin space (1/6-em)]](https://www.rsc.org/images/entities/char_2009.gif) 000 Oe.
000 Oe.
Specific surface area and porosity were fitted from the N2 adsorption–desorption isotherms, which were determined at 77 K using an ASAP 2460 Accelerated Surface Area and Porosimeter System (Micromeritics).
The contents of F−, Cl−, and PO43− were determined using an ICS 5000+ ion chromatograph (Thermo Fisher) with a 25 μL sample loop and a conductivity detector. An IonPac® AS18 (250 mm × 4.0 mm i.d.) was applied as the anion exchange analytical column, which was protected by the guard column of IonPac® AG18 (50 mm × 4.0 mm i.d.). The temperature of the column compartment was set to 30 °C. For the eluent of NaOH solution, the flow rate through the anion exchange analytical column was 1.00 mL min−1, and its concentration was automatically adjusted by an electrolytic eluent generator. When the test time was set to 35 min, the eluent concentration would be 25 mmol (0–13 min), 40 mmol (13–30 min), and 25 mmol (30–35 min). Manual injection was done in the operation.
2.3 Adsorption–determination and recycle procedures
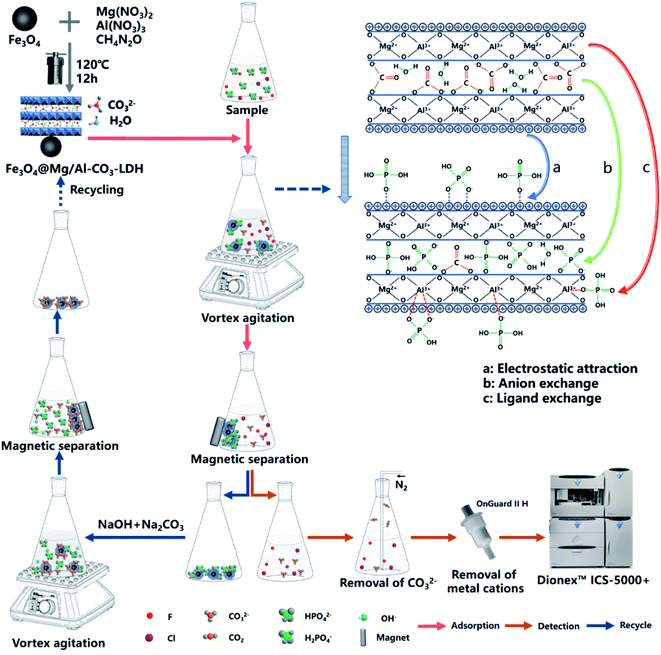
The two main procedures are exhibited in Fig. 1 to adsorb PO43− in a solution of Fe3O4@Mg/Al-CO3-LDH for the determination of F− and Cl−, and to recycle and reuse Fe3O4@Mg/Al-CO3-LDH.Specifically, 50 mg of the synthesized magnetic nano-adsorbent was added to 80 mL of sample solution. They were mixed in a beaker by a vortex mixer for 5 min. After the adsorbent was isolated from the suspension with a magnet, the residual solution was filtered using a 0.22 μm membrane. It was bubbled with N2 for 30 s to remove CO32−, and then passed through an OnGuard II H column to remove the metal cations. At this time, the residual solution after adsorption on the Fe3O4@Mg/Al-CO3-LDH nanoparticles could be introduced into the ion chromatograph to determine F− and Cl−.
For the recycle procedure, the used Fe3O4@Mg/Al-CO3-LDH was collected and placed in 15 mL desorption solution, 5 wt% NaOH and 10 wt% Na2CO3 (AR grade), and further mixed using a vortex mixer for 30 min. With the aid of a magnet, the Fe3O4@Mg/Al-CO3-LDH nanoparticles were washed with deionized water and ethanol three times. This was followed by drying in an oven at 60 °C for 12 h, and then Fe3O4@Mg/Al-CO3-LDH was regenerated for use for a new cycle adsorption. It should be noted that NaOH in the desorption solution will not affect the stability of Mg/Al-CO3-LDH since it was synthesized in an environment of NaOH, as indicated in Section 2.1.
To evaluate the recyclability of the magnetic adsorbent, the phosphate adsorption capacity per unit mass of Fe3O4@Mg/Al-CO3-LDH was measured for each cycle. Briefly, 50 mg of the magnetic adsorbent was added to 80 mL mixed solution with 1.00 mg L−1 F−, 1.00 mg L−1 Cl− and C0 = 100 mg P per L PO43− (based on P). Then, it was processed by 60 min mixing/adsorption, magnetic solid phase extraction–separation, filtering, bubbling, cation removal and chromatographic determination, as stated above. After determining the remaining phosphate concentration, Ce, which is also the equilibrium PO43− concentration in the solution, the adsorption capacity, Qe, of PO43− was calculated by Qe = (C0 − Ce)V/m, where V is the solution volume in L and m is the dry weight of the nano-adsorbent in g.
3 Results and discussion
3.1 Characterization of Fe3O4@Mg/Al-CO3-LDH
Fig. 2 shows the electron microscopy analysis of Fe3O4 and the synthesized Fe3O4@Mg/Al-CO3-LDH magnetic nanoparticles. Both the SEM and bright-field TEM images show that Fe3O4 is an octahedral nanoparticle with clear edges and smooth surface, and its size is about 120 nm, as shown in Fig. 2(a) and (b). On the surface of Fe3O4, Mg/Al-CO3-LDH was synthesized via the urea hydrothermal method. The shape of these irregular Fe3O4@Mg/Al-CO3-LDH nanoparticles is not like the octahedron of Fe3O4, and on their surface, some protuberances exist, as shown in Fig. 2(c). According to the bright-field TEM image shown in Fig. 2(d), these protuberances also can be observed at the outer boundary of the bright gray region, and the bright gray region surrounding the dark region of Fe3O4 is characterized by a flake-like matrix. This is similar to the morphology of Fe3O4@CuMgAl-LDH nanoparticles.55 Due to the stacking of many small flakes, the hydrothermally synthesized Mg/Al-CO3-LDH on Fe3O4 nanoparticles appears to consist of an agglomeration of plate-like structures.56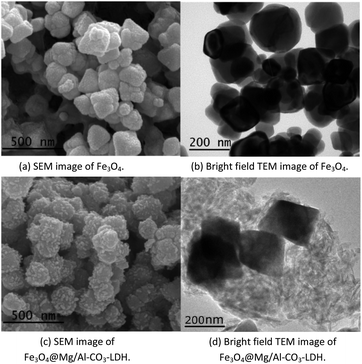 | ||
| Fig. 2 Electron microscopy analysis of Fe3O4 nanoparticles and prepared Fe3O4@Mg/Al-CO3-LDH magnetic nano-adsorbent. | ||
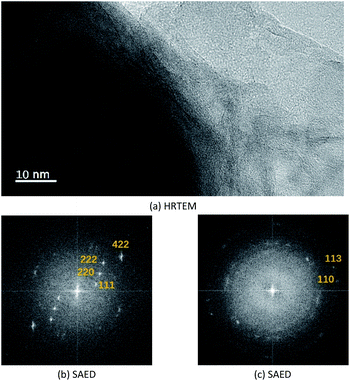
Fig. 3(a) shows the high-resolution TEM image of the synthesized Fe3O4@Mg/Al-CO3-LDH, where the bottom-left dark region and the bottom-right bright region were chosen for SAED, as shown in Fig. 3(b) and (c), respectively. The selected area electron diffraction (SAED) for the dark region clearly shows 4.910 Å, 3.193 Å, 2.469 Å and 1.698 Å diffractions, corresponding to the (111), (220), (222) and (422) planes of Fe3O4 (PDF card: #19-0629). Also, the SAED for the bright region shows 1.541 Å and 1.476 Å diffractions, corresponding to the (110) and (113) planes of Mg/Al-LDH (PDF card: #89-0460). Although the diffraction spots for the bright region are somewhat blurred, as shown in Fig. 3(c), the hexagonal diffraction pattern can still be observed, which is the typical diffraction pattern of LDH crystals.55
Thus, the above electron microscopic analysis indicates that during the hydrothermal process, Fe3O4 retains its original crystalline state, and Mg/Al-LDH is grown as small crystal plates. Their crystallization is also indicated by the XRD pattern shown in Fig. 4(a) for as-synthesized Fe3O4@Mg/Al-CO3-LDH. The diffraction peaks at the 2θ values of 18.24° (111), 30.08° (220), 35.46° (311), 37.04° (222), 43.12° (400), 53.50° (422), 57.04° (511), and 62.56° (400) correspond to the octahedral Fe3O4 crystal,26 and the peaks at the 2θ values of 11.54° (003), 23.44° (006), 35.46° (012), 61.02° (110), and 62.56° (113) correspond to the Mg–Al-LDH crystal.26,57 More importantly, after 15 cycles of PO43−-adsorption and regeneration of Fe3O4@Mg/Al-CO3-LDH, as stated in Section 2.3, both the XRD peak positions and intensities remained almost unchanged, as shown in Fig. 4(a) and (b). This indicates that even after 15 cycles, the Fe3O4@Mg/Al-CO3-LDH magnetic nano-adsorbent can still maintain its structural stability, and thus has important potential for recycling.58
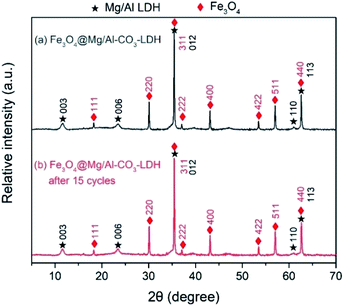 | ||
| Fig. 4 XRD patterns of Fe3O4@Mg/Al-CO3-LDH magnetic nano-adsorbent before and after 15 cycles of PO43−-adsorption and regeneration. | ||
To explore the adsorption and desorption of PO43−, the FTIR spectra of Fe3O4@Mg/Al-CO3-LDH were measured for the as-synthesized, PO43−-adsorbed, and regenerated after 15 cycles of PO43−-adsorption samples, as shown in Fig. 5(a)–(c), respectively. The Fe–O vibration peak59 appeared at 586 cm−1 before and after adsorption and desorption, showing the stable assembly between Fe3O4 and Mg/Al-CO3-LDH.
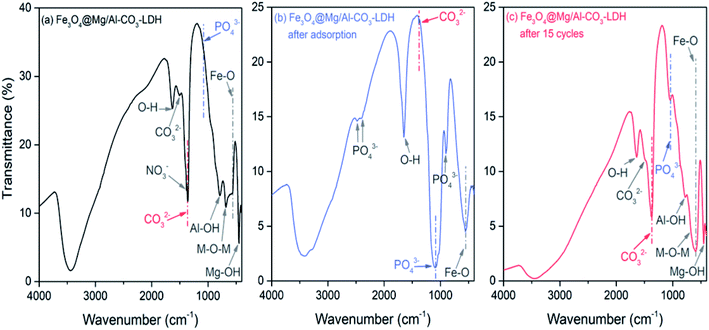 | ||
| Fig. 5 FTIR spectra of Fe3O4@Mg/Al-CO3-LDH magnetic nano-adsorbents. (a) As-prepared, (b) PO43−-adsorbed, and (c) regenerated after 15 cycles of PO43−-adsorption. | ||
As shown in Fig. 5(a), the spectrum of the as-synthesized sample exhibits peaks at 448 cm−1, 681 cm−1, and 788 cm−1, which are attributed to the vibration of Mg–OH,60 Mg–O–Al,61 and Al–OH,60 respectively. The two peaks located at 3445 cm−1 and 1637 cm−1 are related to the stretching and bending modes of the water molecule existing in the interlayer structure, respectively.62 These peaks indicate the successful synthesis of the layered structure Mg/Al-LDH. As the interlayer anion, the vibration of CO32− appears35 at 1362 cm−1 and 1502 cm−1. During the hydrothermal process, urea decomposes at high temperature and produces the CO32− anion,63 which then enters Mg/Al-LDH to form the interlayer anion. Moreover, there is a small peak located at 1385 cm−1, corresponding to the NO3− vibration, but it is rather weak. This is due to the use of nitrate during the synthetic process, where a small amount of NO3− existing in Fe3O4@Mg/Al-CO3-LDH was not replaced by CO32−.
As shown in Fig. 5(b), in the spectrum of the PO43−-adsorbed sample, the Fe–O vibration and the stretching and bending modes of the water molecule remained, but the vibrations resulting from Mg–OH, Mg–O–Al, and Al–OH almost disappear. Especially, there is no CO32− vibration at 1502 cm−1, and only a very weak CO32− peak at 1362 cm−1. On the other hand, new peaks at 2484 cm−1, 2401 cm−1, 1088 cm−1, and 901 cm−1 appear, which are due to the vibrations of PO43−.25,64,65 These results clearly indicate that the anion exchange26 really occurred for Fe3O4@Mg/Al-CO3-LDH after adsorbing PO43−, which is the process to use PO43− to replace CO32−. It is most probably the first mechanism for the synthesized Fe3O4@Mg/Al-CO3-LDH to adsorb PO43− in solution. Due to the disappearance of the vibrations of Mg–OH and Al–OH, it means that they can be protonated and become positively charged, and thus they can adsorb the negatively charged PO43− due to electrostatic adsorption on the surface of LDH.29 This may be the second mechanism to adsorb PO43− in solution. The disappearance of the vibration of Mg–O–Al may be possibly explained by the fact that, as a ligand anion,29 PO43− can be complexed with the Al3+ cation on the surface of Fe3O4@Mg/Al-CO3-LDH. This ligand exchange may be the third mechanism to adsorb PO43− in solution. The ability to perform these three mechanisms for the synthesized Fe3O4@Mg/Al-CO3-LDH is consistent with the reported PO43−-adsorbed LDHs.26,29,33
As shown in Fig. 5(c), in the spectrum of the regenerated sample after 15 cycles of PO43−-adsorption, the positions and intensities of the FTIR peaks are almost the same as that in Fig. 4(a) of the as-synthesized sample. This means that the desorption was successful, and the regenerated Fe3O4@Mg/Al-CO3-LDH returned to its original state with a strong ability to be recycled. It should be noted that there is still a weaker peak at 1088 cm−1 due to PO43−, which indicates a small amount of was PO43− left in Fe3O4@Mg/Al-CO3-LDH after 15 cycles. However, it had no great effect on the phosphate adsorption capacity, as stated in Section 3.3, since most of the interlayer anions were exchanged by CO32− during the desorption process.
It was reported52 that for MgAl-LDO calcined at 500 °C for 4 h after its synthesis, the FTIR band of –OH was shifted to a higher frequency from 1644 cm−1 to 1664 cm−1 after F− adsorption, which may be due to the adsorption of F−. However, as can be seen in Fig. 5(a)–(c), the band due to OH appears at 1637 cm−1, 1640 cm−1, and 1638 cm−1 for the as-synthesized, PO43−-adsorbed, and regenerated Fe3O4@Mg/Al-CO3-LDH samples, respectively. Thus, the absence of a shift in the OH band means that the synthesized Fe3O4@Mg/Al-CO3-LDH did not adsorb F−. This is in good agreement with the determination results by ion chromatography, indicating there was no change for the trace concentrations of F− and Cl− before and after adsorption (see Fig. 8 and 9 in Section 3.2, respectively). According to the literature, phosphate adsorption by some non-LDH adsorbents66–70 and some LDH adsorbents23–26,31,33 is greatly affected by F− or Cl− due to their adsorption. For LDHs, considering the bonding strength between the layers and interlayer anions in aqueous solution,17 the strength of phosphates is generally higher than that of F− and Cl−. Since there is a large amount of phosphate in aqueous solution, the adsorption possibility of phosphate is higher than that of F− or Cl−. However, it is still inevitable that a small amount of F− and Cl− will be adsorbed,23–26,31,33 although this possibility is small. Thus, to further decrease this possibility, for the synthesized nano-adsorbent of Fe3O4@Mg/Al-CO3-LDH, CO32− was employed as the interlayer anion. The bonding strength of CO32− is the highest,17 much greater than that of F− and Cl−. During the phosphate adsorption process, a lot of CO32− anions will be exchanged in the solution, which will further inhibit the adsorption of trace F− and Cl− anions. Moreover, if some OH− anions exist in solution, the adsorption efficiencies19 will further decline due to the combined effects of increasing competition from the OH− anion and the Coulomb repulsion between the negative-charged surface of the LDH adsorbent and F− or Cl−. If there is insufficient positive charge such as H+ on the surface of the LDH adsorbent, and there are enough anions such as CO32− and PO43−, which have a much higher bonding strength than F− and Cl−, to strongly compete with F− and Cl− anions, the synthesized magnetic nano-adsorbent Fe3O4@Mg/Al-CO3-LDH should not adsorb F− and Cl− anions.
Fig. 6 shows the magnetic hysteresis loops of Fe3O4, and Fe3O4@Mg/Al-CO3-LDH before and after 15 cycles of PO43−-adsorption. Compared with the magnetic saturation value of 102 emu g−1 for the pure Fe3O4 nanoparticles, that for the as-synthesized Fe3O4@Mg/Al-CO3-LDH drops to 36.75 emu g−1 since the non-magnetic Mg/Al-CO3-LDH shields the magnetic Fe3O4. Even if after 15 cycles, it was still 36.47 emu g−1. This value is sufficient to achieve repeated rapid magnetic extraction and separation. More importantly, it should be noted that the two loop curves before and after PO43−-adsorption come close to coinciding in shape. This truthfully reflects that the thickness of the Mg/Al-CO3-LDH coating layer did not change, which indicates almost no etching and degradation occurred even after 15 cycles of adsorption, separation and desorption. Based on this, the structural stability indicated by the above Fig. 4(b), which is also the result after 15 cycles of PO43−-adsorption, means that the two-dimensional crystalline nanostructure of Mg/Al-CO3-LDH and the interlayer anion CO32− in the layered double hydroxide were both maintained rather stably. Actually, it can be seen in Fig. 5(c) that after 15 cycles of adsorption, separation and desorption, the FTIR peak intensity of CO32− is as strong as that of the as-synthesized Fe3O4@Mg/Al-CO3-LDH, as seen in Fig. 5(a). This means that the content of CO32− was almost fully recovered even after 15 cycles of PO43−-desorption, which can provide an excellent performance for stable dephosphorization.
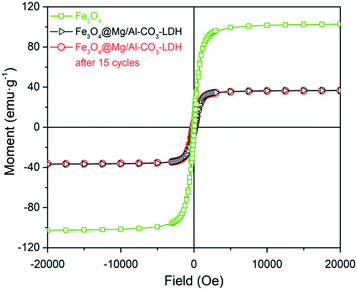 | ||
| Fig. 6 Magnetic hysteresis loop analysis for Fe3O4 nanoparticle, and prepared Fe3O4@Mg/Al-CO3-LDH magnetic nano-adsorbent before and after 15 cycles of PO43−-adsorption and regeneration. | ||
Fig. 7(a) and (b) show the N2 adsorption–desorption isotherms and BJH (Barrett–Joyner–Halenda) pore diameter distribution curves of Fe3O4@Mg/Al-CO3-LDH, respectively. In Fig. 7(a), there is a clear hysteresis loop at a high relative pressure of P/P0 > 0.6, which is a typical type IV adsorption isotherm28 according to the IUPAC classification. When P/P0 > 0.9, there is no saturated adsorption platform, and rapid adsorption and desorption occur in this high pressure region. This indicates that the loop can be further classified as type H3,28 which means the pores in Fe3O4@Mg/Al-CO3-LDH are mainly mesoporous. This was verified by Fig. 7(b), where the pore size distribution is mainly in the range of 5–50 nm, with an average size of 15.1 nm and total pore volume of 0.59 cm3 g−1. The formation of these mesoporous pores in Fe3O4@Mg/Al-CO3-LDH is related to the slit-shaped pores or voids created within the aggregates of platy particles.28,71 Generally, the specific surface area and total pore volume will affect the chance of contact between the adsorbent and the adsorbate, thereby affecting the adsorption effect of the adsorbent.28,72 According to the BET (Brunauer–Emmett–Teller) method,73 the specific surface area of Fe3O4@Mg/Al-CO3-LDH was calculated to be 88.4 m2 g−1. Thus, the hydrothermally synthesized Fe3O4@Mg/Al-CO3-LDH can adsorb PO43− in solution rapidly and efficiently.
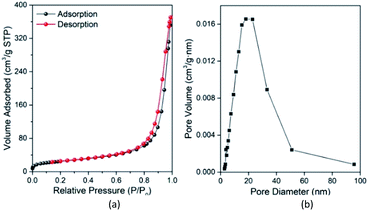 | ||
| Fig. 7 N2 adsorption–desorption isotherms (a) and Barrett–Joyner–Halenda (BJH) pore diameter distribution curve (b) of the prepared Fe3O4@Mg/Al-CO3-LDH magnetic nano-adsorbent. | ||
3.2 Optimized pretreatment by Fe3O4@Mg/Al-CO3-LDH
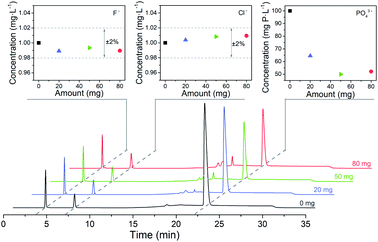
For 80 mL solution containing 1.00 mg L−1 F−, 1.00 mg L−1 Cl− and 100 mg P per L PO43− are the optimized adsorbent amount and adsorption time for Fe3O4@Mg/Al-CO3-LDH, respectively. These optimized pretreatment conditions were utilized for the analysis of real samples, as stated in Section 4.By using different amounts of Fe3O4@Mg/Al-CO3-LDH magnetic nano-adsorbent to adsorb PO43− for the same adsorption time of 60 min, Fig. 8 shows the chromatograms, in which three chromatographic peaks at about 3 min, 7 min, 22 min correspond to F−, Cl−, and PO43−, respectively. Their concentrations were calculated based on their peak area, and plotted at the top of Fig. 8. With the addition of Fe3O4@Mg/Al-CO3-LDH in the solution, the concentration of both F− and Cl− was always maintained at around 1.00 mg L−1 with the fluctuation of ±2%, as shown in the top-left and top-middle of Fig. 8. This indicates that Fe3O4@Mg/Al-CO3-LDH will not adsorb any F− and Cl− anions in the solution regardless of the adsorbent amount used, which is the most important factor to determine trace F− and Cl− in solution. On the other hand, only a small amount of the nano-adsorbent, such as 20 and 50 mg, could make the residual PO43− concentration decrease greatly from 100 mg P per L to 64.5 and 49.5 mg P per L, respectively, as shown in the top-right of Fig. 8. However, when the absorbent amount was further increased to 80 mg, the residual PO43− concentration did not further decrease since equilibrium between PO43− and CO32− was reached. Thus, the optimized adsorbent amount of 50 mg Fe3O4@Mg/Al-CO3-LDH is enough for 80 mL solution with 100 mg P per L PO43−.
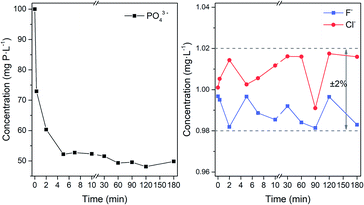
By using 50 mg Fe3O4@Mg/Al-CO3-LDH to adsorb PO43− in 80 mL solution for different times, the residual concentration of PO43− and F− and Cl− anions in the solution was determined by chromatography, as plotted in Fig. 9. According to Fig. 9(a), the concentration of both F− and Cl− was maintained at around 1.00 mg L−1 with the fluctuation of ±2%, regardless of the adsorbent time used. Similarly, as indicated in the plots at the top of Fig. 8, Fe3O4@Mg/Al-CO3-LDH did not adsorb any F− and Cl− anions in the solution, no matter how long the interaction time. However, for PO43−, even with fast magnetic separation immediately after the addition of Fe3O4@Mg/Al-CO3-LDH in the solution, the residual PO43− concentration directly declined to 72.9 mg P per L. Also, after 2 and 5 min adsorption, it decreased to 60.3 and 52.2 mg P per L, respectively. With a further increase in the adsorption time, the adsorption of PO43− slows down to the equilibrium stage, until the residual PO43− concentration finally reached 48.1 mg P per L after 120 min adsorption. According to the formula for phosphate adsorption capacity,74 as stated in Section 2.3, the capacity of Fe3O4@Mg/Al-CO3-LDH is 83.04 mg P per g for 120 min adsorption. Even for 5 min adsorption, it is still as high as 76.48 mg P per g. Thus, the optimized adsorption time was chosen to be 5–60 min for the solution using 50 mg Fe3O4@Mg/Al-CO3-LDH.
3.3 Recyclability of Fe3O4@Mg/Al-CO3-LDH
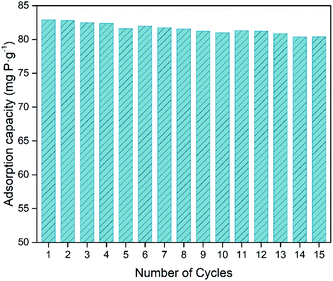
The recyclability of an adsorbent is vital for its practical application,31,58 and the premise for recycling is the stability of its structure. The crystalline structure stability, the adsorption stability, and the coating layer stability of Fe3O4@Mg/Al-CO3-LDH after 15 cycles of PO43−-adsorption and regeneration were confirmed by XRD, as shown in Fig. 4(b), FTIR, as shown in Fig. 5(c), and magnetic hysteresis loop analysis, as shown in Fig. 6, respectively.To evaluate the recyclability of the Fe3O4@Mg/Al-CO3-LDH magnetic nano-adsorbent, the phosphate adsorption capacities were determined for each cycle and shown in Fig. 10, where the 60 min adsorption, 30 min desorption and regeneration processes are stated in Section 2.3. The initial capacity of 83.04 mg P per g calculated from Fig. 9 was used for the as-synthesized Fe3O4@Mg/Al-CO3-LDH. For the subsequent cycles, the phosphate adsorption capacity decreased but very slowly. Even after 15 desorption–adsorption cycles, the capacity was still as high as 80.41 mg P per g, which is only 3.2% lower than the initial 83.04 mg P per g. Among the 15 cycles, the maximum decrease occurred in the 5th cycle, but not more than 1%, and the average decrease was as low as ∼0.2%. This clearly indicates that the synthesized Fe3O4@Mg/Al-CO3-LDH has excellent recyclability and stability, maintaining high phosphate adsorption capacities even after manifold cycles.
Table 1 presents the phosphate adsorption capacity, adsorption time, and recycle number of various magnetic adsorbents. These adsorbents, LDH adsorbents with interlayer anion and non-LDH adsorbents, can all be used to efficiently adsorb PO43− in solution. Compared with most of the adsorbents, the phosphate capacity per unit mass of the synthesized Fe3O4@Mg/Al-CO3-LDH is as high as 76.48 mg P per g, higher than 1.8675–36.9 mg P per g, but somewhat lower25,31,69,74 than 128–252.88 mg P per g of these four adsorbents. However, they used about 360–4320 min to adsorb phosphates in solution. It should be noted that the capacity is related to the adsorption time used. Even if the adsorption time used is as fast as 5 min, which is 1/8–1/288 of the reported times listed in Table 1, the adsorption capacity of 76.48 mg P per g for Fe3O4@Mg/Al-CO3-LDH is high enough to adsorb PO43− rapidly and efficiently so as to determine F− and Cl− without serious interference due to PO43−. In the case of the recycle number, which is one of the vital properties for the recyclability of an adsorbent, it is 15 cycles for Fe3O4@Mg/Al-CO3-LDH, more than the reported 2–5 cycles. The reported recycle number could reach up to 20 cycles,23 but there was no information about the phosphate adsorption capacity. According to Table 1, if only considering magnetic LDHs with a CO32− interlayer anion, Fe3O4@Mg/Al-CO3-LDH behaves very well to adsorb PO43− in solution, with four times greater cycle number and two times greater phosphate adsorption capacity.
| Adsorbent | Interlayer anion for LDHg | Adsorption time (min) | Adsorption capacitya (mg P per g) | Cycle no. | Ref. |
|---|---|---|---|---|---|
| a Adsorption capacity of phosphate, Qe = (C0 − Ce)V/m, where C0 and Ce are the initial and equilibrium phosphate concentration in mg L−1, V is the volume of phosphate solution in L, and m is the dry weight of the adsorbent in g.b The adsorption capacity decreased to 31 mg g−1 after 4 cycles.c The adsorption capacity decreased to 25.71 mg g−1 after 5 cycles.d The adsorption efficiency was reduced to 70.01% after 4 cycles.e The adsorption capacity decreased to 4.8 mg g−1 after 2 cycles.f The adsorption capacity decreased to 20.2 mg g−1 after 2 cycles.g The information is summarized from the description of preparation processes, or FTIR, XPS and other characterization in refs. | |||||
| ZnFeZr adsorbent@Fe3O4/SiO2 | Cl− | 60 | 20 | 23 | |
| Magnetic Fe/Mn oxide composites (TS-N) | Cl− | 90 | 26.0 | 24 | |
| Fe3O4/Zn–Al–Fe–La-LDH | Cl− and SO42− | 1440 | 169.5 | 4b | 25 |
| Fe3O4@Zn–Al-LDH | CO32− | 60 | 36.9 | 26 | |
| Fe3O4@Mg–Al-LDH | 31.7 | ||||
| Fe3O4@Ni–Al-LDH | 26.5 | ||||
| Fe/CaCO3_PVA | Non-LDH | 16.7 | 75 | ||
| Fe/MgCO3_PVA | 16.3 | ||||
| Fe3O4@SiO2–CeO2 | Non-LDH | 1440 | 10.8 | 2c | 76 |
| Ce–Ti@ Fe3O4 | Non-LDH | 1440 | 11.10 | 66 | |
| Carboxylated chitosan–Fe3O4 | Non-LDH | 60 | 1.8675 | 67 | |
| La–chitosan magnetic spheres | Non-LDH | 300 | 27.78 | 68 | |
| ZrO2/Fe3O4 | Non-LDH | 1440 | 29.5 | 77 | |
| Magnetic Caragana korshinskii biochar/Mg–Al-LDH | Cl− | 720 | 252.88 | 5d | 31 |
| Fe3O4@alkali-treated calcium-silicate | Non-LDH | 4320 | 128 | 2e | 69 |
| Fe3O4@gelatin encapsulated hydrotalcite | CO32− | 40 | 32.73 | 4f | 33 |
| NrGO/Fe3O4 | Non-LDH | 360 | 135.3 | 5 | 74 |
| Humic acid coated magnetite nanoparticles | Non-LDH | 180 | 28.9 | 70 | |
| Fe3O4@Mg/Al-CO3-LDH | CO32− | 5 | 76.48 | 15 | This work |
4 Analysis of real samples
Phosphate and fluorophosphate laser glasses contain high PO43− and a certain amount of various monovalent, divalent, trivalent metal cations. The leaching solutions from these glasses were determined before and after adsorption pretreatment using the Fe3O4@Mg/Al-CO3-LDH magnetic nano-adsorbent, and the chromatograms are shown in Fig. 11. As seen in Fig. 11(a) for the phosphate (P2O5 molar ratio of both N31 and N41 glasses is close to 60%) with high PO43− but low F− and Cl−, the strong peak at 22.36 min due to PO43− is too overloaded, and thus it seems to be a leading peak with 100 μS conductivity. After the adsorption pretreatment, the 22.36 min peak shape became normal and its intensity decreased greatly to 10 μS. This indicates that Fe3O4@Mg/Al-CO3-LDH could efficiently adsorb PO43− in the multi-ion leaching solution in a short time of only 5 min. On the other hand, Fe3O4@Mg/Al-CO3-LDH did not adsorb any F− or Cl−. The peaks at 3.79 and 7.34 min are due to F− and Cl−, respectively, and their intensities did not change after the adsorption pretreatment. As seen in Fig. 11(b) for the fluorophosphate with a high F− and PO43− content but low Cl−, the 22.36 min PO43− peak almost disappeared after the adsorption pretreatment by Fe3O4@Mg/Al-CO3-LDH for 5 min. The strong F− peak at 3.79 min and the weak Cl− peak at 7.34 min did not change after the pretreatment. Regardless of a high or low PO43− content in a multi-ion solution, the synthesized Fe3O4@Mg/Al-CO3-LDH magnetic nano-adsorbent can adsorb and extract PO43− rapidly. Also, regardless of a high or low F− or Cl− content in a multi-ion solution, the addition and extraction of the nano-adsorbent did not result in any change in the contents of F− or Cl−. These two facts determine the usefulness of the nano-adsorbent for specific applications, i.e. the removal of PO43−, and especially the determination of F−/Cl− after removing PO43− in a multi-ion solution. By using the Fe3O4@Mg/Al-CO3-LDH adsorption pretreatment, the pretreated solution can be utilized for other determination techniques or methods since there will be no serious interference from PO43− in the solution. Considering chromatography, the determination time for the accurate determination of F− and Cl− can be greatly shortened after removing PO43−. More importantly, without being affected by PO43− and fully retaining trace F− and Cl−, a continuous analysis or on-line test can be done during processes in the laboratory and industry in fields such as pharmaceuticals and biomaterials. If PO43− is not removed from a PO43−-rich solution, the next injection must not be allowed.11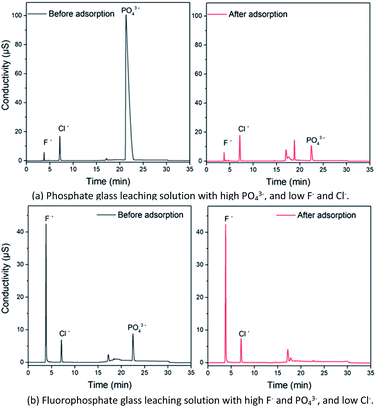 | ||
| Fig. 11 Chromatograms for the leaching solutions of phosphate glass (a) and fluorophosphate glass (b) before and after 5 min adsorption by 50 mg Fe3O4@Mg/Al-CO3-LDH magnetic nano-adsorbent. | ||
By chromatography, Table 2 lists the determined results of F− and Cl− for various real samples, such as a certified reference ore material (GBW07108 containing F, Cl and P, as well as 66 other elements), silicate glass, fluorophosphate glass, phosphate laser glasses, and environmental water samples. Specifically, 80 mL sample solution was pretreated using Fe3O4@Mg/Al-CO3-LDH under the optimized conditions. For the certified ore sample, the determined values of 0.395 and 0.0071 mg L−1 are very close to the certified values of 0.406 and 0.0078 mg L−1 for F− and Cl−, respectively. After determining F− and Cl− for the other samples, a certain amount of F− and Cl− standard solutions was added, i.e. the added content was 1.00 mg L−1. Subsequently, the contents of F− and Cl− in the solution re-pretreated by Fe3O4@Mg/Al-CO3-LDH were measured again. Accordingly, the spiked recoveries were calculated. As seen in Table 2, these spiked recoveries were all within an acceptable range of 95.7–104.9%. Thus, the above determinations prove the accuracy to determine F− and Cl− in multi-ion solutions pretreated by the synthesized Fe3O4@Mg/Al-CO3-LDH magnetic nano-adsorbent.
| Sample | F− | Cl− | ||||
|---|---|---|---|---|---|---|
| Added (mg L−1) | Found (mg L−1) | Recovery (%) | Added (mg L−1) | Found (mg L−1) | Recovery (%) | |
| a The certified reference ore samples were approved by the General Administration of Quality Supervision, Inspection and Quarantine of the People's Republic of China, which were mainly composed of silicate, carbonate and oxide of Al, Fe, Mg and Ca.b The certified content of F− and Cl− in the certified reference material GBW07108. | ||||||
| GBW07108a | 0.406b | 0.395 | 97.3 | 0.078b | 0.071 | 91.0 |
| 1.00 | 1.444 | 104.9 | 1.00 | 1.092 | 102.1 | |
| Silicate glass | 0 | 9.970 | — | 0 | 0.083 | — |
| 1.00 | 10.927 | 95.7 | 1.00 | 1.069 | 98.6 | |
| Fluorophosphate glass | 0 | 21.972 | — | 0 | 0.066 | — |
| 1.00 | 23.012 | 104.0 | 1.00 | 1.060 | 99.4 | |
| N31 phosphate glass, pot melting | 0 | 0.744 | — | 0 | 0.251 | — |
| 1.00 | 1.738 | 99.4 | 1.00 | 1.245 | 99.4 | |
| N41 phosphate glass, pot melting | 0 | 0.814 | — | 0 | 0.585 | — |
| 1.00 | 1.800 | 98.6 | 1.00 | 1.558 | 97.3 | |
| N41 phosphate glass, continuous melting | 0 | 1.267 | — | 0 | 0.459 | — |
| 1.00 | 2.277 | 101.0 | 1.00 | 1.501 | 104.2 | |
| River water | 0 | 0.153 | — | 0 | 7.351 | — |
| 1.00 | 1.150 | 99.7 | 1.00 | 8.338 | 98.7 | |
It should be noted that the pH values of real sample solutions may vary from sample to sample, especially when dissolving solid samples by acid or alkali. The pH value of the solution will affect the existing form of phosphate anions,17,26,29 such as PO43−, HPO42− and H2PO4−. Thus, two phosphate solutions were obtained by dissolving high purity Na3PO4 or NaH2PO4 in deionized water without adding any acid and alkali, and treated with the magnetic nano-adsorbent of Fe3O4@Mg/Al-CO3-LDH, and their ion chromatogram peaks due to phosphate greatly decreased. The large decrease indicates the effective adsorption of both Na3PO4 and NaH2PO4 solutions. This implies that no matter the existing form of phosphate anions, such as PO43− and H2PO4−, the synthesized Fe3O4@Mg/Al-CO3-LDH can adsorb them efficiently. On the other hand, the pH value of real sample solutions as in the above applications is not adjusted by acid and alkali to avoid any further disturbance in the trace determination of F− and Cl− by ion chromatography.
5 Conclusion
Using the urea hydrothermal method, the layered double hydroxide Mg/Al-CO3-LDH was synthesized and aggregated as small crystal plates on Fe3O4 nanoparticles, which retained its original crystalline state with high magnetism. The magnetic saturation value of 36.47 emu g−1 was sufficient to achieve rapid magnetic extraction–separation during PO43−-adsorption by Fe3O4@Mg/Al-CO3-LDH. As a recyclable magnetic nano-adsorbent, its structural stability was confirmed after 15 regeneration cycles for PO43−-adsorption and desorption. The vibrations of the CO32− and PO43− groups, and the Mg–OH, Al–OH, and Mg–O–Al bonds indicated that the mechanism for the adsorption of PO43− by Fe3O4@Mg/Al-CO3-LDH is related to the anion exchange between the interlayer anion CO32− and PO43− in solution, the LDH surface electrostatic adsorption for PO43− in solution, and the ligand exchange between LDH and PO43− in solution. Since mesoporous pores are created within the aggregates of small crystal plates during the synthesis of Fe3O4@Mg/Al-CO3-LDH, its large specific surface area and total pore volume are 88.4 m2 g−1 and 0.59 cm3 g−1, respectively. These endow the magnetic nano-adsorbent with a high phosphate adsorption capacity of 83.04 mg P per g for 120 min adsorption, or still up to 76.48 mg P per g for rapid 5 min adsorption. Even after 15 desorption–adsorption cycles, the capacity was still as high as 80.41 mg P per g with only a decline by 3.2%. Compared with other magnetic LDHs with CO32−, the synthesized Fe3O4@Mg/Al-CO3-LDH exhibited very good ability to adsorb PO43−, with four times greater cycle number, two times greater phosphate adsorption capacity, and eight-twelve times less adsorption time. More importantly, regardless of a high or low F− or Cl− content, and regardless of the used amount and adsorption time of Fe3O4@Mg/Al-CO3-LDH, the addition and extraction of the nano-adsorbent did not result in any change in the contents of F− and Cl− in a multi-ion solution. Thus, the usefulness of the synthesized Fe3O4@Mg/Al-CO3-LDH is concentrated on two specific applications, the removal of PO43−, and especially the accurate determination of F− and Cl− after the removal of PO43−. By optimizing the nano-adsorbent amount and adsorption time, Fe3O4@Mg/Al-CO3-LDH was successfully utilized to adsorb PO43− rapidly and determine F−/Cl− accurately by ion chromatography for real samples such as certified reference ore materials, phosphate laser glass, fluorophosphate glass, silicate glass and environmental water samples. Currently, these applications are greatly beneficial for product quality monitoring for extremely hazardous F− and Cl− to protect the ecological environment. On the other hand, excess P will lead to widespread eutrophication in aquatic environments, in which algal blooms are also harmful towards human health due to cyanotoxins.78 With the further development and progress on the adsorption capacity, adsorption recovery velocity, and adsorption kinetics,78,79 studies will be devoted to online applications and widening the scope of these significant methods using LDH adsorbents, which will contribute immensely to environmental protection.Conflicts of interest
There are no conflicts to declare.Acknowledgements
The research work was financially supported by Nd-doped phosphate laser glass projects from National Major Science and Technology Project of China, National High Technology Research and Development Program for Inertial Confinement Fusion of China.References
- F. Vasconcelos, S. Cristol, J. Paul, L. Montagne, F. Mauri and L. Delevoye, Magn. Reson. Chem., 2010, 48, S142–S150 Search PubMed.
- A. Salama, Int. J. Biol. Macromol., 2019, 127, 606–617 Search PubMed.
- H. Parham and N. Rahbar, Talanta, 2009, 80, 664–669 Search PubMed.
- V. P. Kolotov and E. A. Arafa, J. Radioanal. Nucl. Chem., 1993, 172, 357–362 Search PubMed.
- P. Venkateswarlu, Anal. Chim. Acta, 1992, 262, 33–40 Search PubMed.
- Z. Ni, Z. Rao and M. Li, Anal. Chim. Acta, 1996, 334, 177–182 Search PubMed.
- P. Bermejo-Barrera, A. Moreda-Piñeiro and A. Bermejo-Barrera, Spectrochim. Acta, Part B, 2002, 57, 327–337 Search PubMed.
- U. Nygren, H. Ramebäck, D. C. Baxter and C. Nilsson, J. Anal. At. Spectrom., 2005, 20, 529 Search PubMed.
- F. S. Stover, J. Chromatogr. A, 2002, 956, 121–128 Search PubMed.
- L. E. Vanatta, D. E. Coleman and A. Woodruff, J. Chromatogr. A, 2003, 997, 269–278 Search PubMed.
- E. Kaiser, J. S. Rohrer and K. Watanabe, J. Chromatogr. A, 1999, 850, 167–176 Search PubMed.
- L. Al Attar, M. Al-Oudat, K. Shamali, B. A. Ghany and S. Kanakri, Environ. Technol., 2012, 33, 143–152 Search PubMed.
- W. Qiao, R. Liu, Z. Li, X. Luo, B. Huang, Q. Liu, Z. Chen, J. Tsoi, Y. X. Su, K. Cheung, J. P. Matinlinna, K. Yeung and Z. Chen, Biomater. Sci., 2018, 6, 2951–2964 Search PubMed.
- D. Štepec and M. Ponikvar-Svet, Acta Chim. Slov., 2019, 66, 255–275 Search PubMed.
- F. L. Theiss, G. A. Ayoko and R. L. Frost, Appl. Surf. Sci., 2016, 383, 200–213 Search PubMed.
- V. Rives and M. Angeles Ulibarri, Coord. Chem. Rev., 1999, 181, 61–120 Search PubMed.
- Q. Zhang, F. Ji, T. Zhao, Q. Shen, D. Fang, L. Kuang, L. Jiang and S. Ding, Appl. Clay Sci., 2019, 174, 159–169 Search PubMed.
- M. P. Bernardo and C. Ribeiro, Mater. Res., 2018, 21, e20171001 Search PubMed.
- F. Li, J. Jin, Z. Shen, H. Ji, M. Yang and Y. Yin, J. Hazard. Mater., 2020, 388, 121734 Search PubMed.
- C. V. Luengo, M. A. Volpe and M. J. Avena, J. Environ. Chem. Eng., 2017, 5, 4656–4662 Search PubMed.
- H. Hatami, A. Fotovat and A. Halajnia, Appl. Clay Sci., 2018, 152, 333–341 Search PubMed.
- S. M. Ashekuzzaman and J. Jiang, Process Saf. Environ. Prot., 2017, 107, 454–462 Search PubMed.
- A. Drenkova-Tuhtan, M. Schneider, M. Franzreb, C. Meyer, C. Gellermann, G. Sextl, K. Mandel and H. Steinmetz, Water Res., 2017, 109, 77–87 Search PubMed.
- C. Chon, D. Cho, I. Nam, J. Kim and H. Song, J. Soils Sediments, 2018, 18, 946–956 Search PubMed.
- W. Qiao, H. Bai, T. Tang, J. Miao and Q. Yang, Colloids Surf., A, 2019, 577, 118–128 Search PubMed.
- L. Yan, K. Yang, R. Shan, T. Yan, J. Wei, S. Yu, H. Yu and B. Du, J. Colloid Interface Sci., 2015, 448, 508–516 Search PubMed.
- R. Chitrakar, S. Tezuka, J. Hosokawa, Y. Makita, A. Sonoda, K. Ooi and T. Hirotsu, J. Colloid Interface Sci., 2010, 349, 314–320 Search PubMed.
- K. S. Triantafyllidis, E. N. Peleka, V. G. Komvokis and P. P. Mavros, J. Colloid Interface Sci., 2010, 342, 427–436 Search PubMed.
- F. Hu, M. Wang, X. Peng, F. Qiu, T. Zhang, H. Dai, Z. Liu and Z. Cao, Colloids Surf., A, 2018, 555, 314–323 Search PubMed.
- J. Zhou, S. Yang, J. Yu and Z. Shu, J. Hazard. Mater., 2011, 192, 1114–1121 Search PubMed.
- Q. Cui, G. Jiao, J. Zheng, T. Wang, G. Wu and G. Li, RSC Adv., 2019, 9, 18641–18651 Search PubMed.
- B. Bekele, L. Lundehøj, N. D. Jensen, U. G. Nielsen and C. Forano, Appl. Clay Sci., 2019, 176, 49–57 Search PubMed.
- I. A. Kumar and N. Viswanathan, J. Environ. Chem. Eng., 2018, 6, 208–217 Search PubMed.
- M. Ogawa and H. Kaiho, Langmuir, 2002, 18, 4240–4242 Search PubMed.
- F. Yang, S. Sun, X. Chen, Y. Chang, F. Zha and Z. Lei, Appl. Clay Sci., 2016, 123, 134–140 Search PubMed.
- M. M. Rao, B. R. Reddy, M. Jayalakshmi, V. S. Jaya and B. Sridhar, Mater. Res. Bull., 2005, 40, 347–359 Search PubMed.
- S. Ma, C. Fan, G. Huang, Y. Li, X. Yang and K. Ooi, Eur. J. Inorg. Chem., 2010, 2010, 2079–2083 Search PubMed.
- S. Li, Y. Shen, D. Liu, L. Fan, X. Zheng and J. Yang, Compos. Interfaces, 2012, 19, 489–498 Search PubMed.
- J. Wang, D. Li, X. Yu, M. Zhang and X. Jing, Colloid Polym. Sci., 2010, 288, 1411–1418 Search PubMed.
- T. Hibino and H. Ohya, Appl. Clay Sci., 2009, 45, 123–132 Search PubMed.
- B. Li, J. He and D. G. Evans, Chem. Eng. J., 2008, 144, 124–137 Search PubMed.
- P. Zhang, T. Yamaguchi, B. N. Nair, K. Miyajima and G. M. Anilkumar, RSC Adv., 2014, 4, 41051–41058 Search PubMed.
- M. Yang, J. Liu, Z. Chang, G. R. Williams, D. O'Hare, X. Zheng, X. Sun and X. Duan, J. Mater. Chem., 2011, 21, 14741–14746 Search PubMed.
- S. Radha and A. Navrotsky, J. Phys. Chem. C, 2014, 118, 29836–29844 Search PubMed.
- B. Li and J. He, J. Phys. Chem. C, 2008, 112, 10909–10917 Search PubMed.
- G. K. Sarma and M. H. Rashid, J. Chem. Eng. Data, 2018, 63, 2957–2965 Search PubMed.
- X. Lei, W. Lu, Q. Peng, H. Li, T. Chen, S. Xu and F. Zhang, Appl. Catal., A, 2011, 399, 87–92 Search PubMed.
- X. Yuan, Y. Wang, J. Wang, C. Zhou, Q. Tang and X. Rao, Chem. Eng. J., 2013, 221, 204–213 Search PubMed.
- B. Zhu, L. Chen, T. Yan, J. Xu, Y. Wang, M. Chen and H. Jiang, Water Sci. Technol., 2018, 78, 1179–1188 Search PubMed.
- P. Zhang, T. He, P. Li, X. Zeng and Y. Huang, Langmuir, 2019, 35, 13562–13569 Search PubMed.
- Y. Zhang, L. Wang, L. Zou and D. Xue, J. Cryst. Growth, 2010, 312, 3367–3372 Search PubMed.
- L. Bo, Q. Li, Y. Wang, L. Gao, X. Hu and J. Yang, Environ. Prog. Sustainable Energy, 2016, 35, 1420–1429 Search PubMed.
- M. N. Sepehr, K. Yetilmezsoy, S. Marofi, M. Zarrabi, H. R. Ghaffari, M. Fingas and M. Foroughi, J. Taiwan Inst. Chem. Eng., 2014, 45, 2786–2800 Search PubMed.
- M. R. Berber, I. H. Hafez, K. Minagawa, M. Katoh, T. Mori and M. Tanaka, J. Mol. Struct., 2013, 1033, 104–112 Search PubMed.
- H. Zhang, G. Zhang, X. Bi and X. Chen, J. Mater. Chem. A, 2013, 1, 5934–5942 Search PubMed.
- U. Costantino, F. Marmottini, M. Nocchetti and R. Vivani, Eur. J. Inorg. Chem., 1998, 1439–1446 Search PubMed.
- M. Shao, F. Ning, J. Zhao, M. Wei, D. G. Evans and X. Duan, J. Am. Chem. Soc., 2011, 134, 1071–1077 Search PubMed.
- K. Mandel, A. Drenkova-Tuhtan, F. Hutter, C. Gellermann, H. Steinmetz and G. Sextl, J. Mater. Chem. A, 2013, 1, 1840–1848 Search PubMed.
- N. Ammavasi and R. Mariappan, J. Environ. Chem. Eng., 2018, 6, 5645–5654 Search PubMed.
- R. Zeng, Z. Liu, F. Zhang, S. Li, Q. He, H. Cui and E. Han, Trans. Nonferrous Met. Soc. China, 2015, 25, 1917–1925 Search PubMed.
- J. Shou, C. Jiang, F. Wang, M. Qiu and Q. Xu, J. Mol. Liq., 2015, 207, 216–223 Search PubMed.
- S. Arghavani-Beydokhti, M. Rajabi and A. Asghari, Anal. Methods, 2018, 10, 1305–1314 Search PubMed.
- W. H. R. Shaw and J. J. Bordeaux, J. Am. Chem. Soc., 1955, 77, 4729–4733 Search PubMed.
- V. Siva Kumar, A. H. Padmasri, C. V. V. Satyanarayana, I. Ajit Kumar Reddy, B. David Raju and K. S. Rama Rao, Catal. Commun., 2006, 7, 745–751 Search PubMed.
- F. Loretta, S. Perumal and S. Ramalingom, Asian J. Chem., 2013, 25, 1921–1926 Search PubMed.
- A. A. Markeb, L. A. Ordosgoitia, A. Alonso, A. Sánchez and X. Font, RSC Adv., 2016, 6, 56913–56917 Search PubMed.
- E. Mohammadi, H. Daraei, R. Ghanbari, S. Dehestani Athar, Y. Zandsalimi, A. Ziaee, A. Maleki and K. Yetilmezsoy, J. Mol. Liq., 2019, 273, 116–124 Search PubMed.
- R. Cheng, L. Shen, Y. Zhang, D. Dai, X. Zheng, L. Liao, L. Wang and L. Shi, Water, 2018, 10, 1659 Search PubMed.
- D. Jiang, Y. Amano and M. Machida, J. Environ. Chem. Eng., 2017, 5, 4229–4238 Search PubMed.
- M. Rashid, N. T. Price, M. Á. Gracia Pinilla and K. E. O'Shea, Water Res., 2017, 123, 353–360 Search PubMed.
- O. Mrózek, P. Ecorchard, P. Vomáčka, J. Ederer, D. Smržová, M. Š. Slušná, A. Machálková, M. Nevoralová and H. Beneš, Appl. Clay Sci., 2019, 169, 1–9 Search PubMed.
- M. Gilanizadeh and B. Zeynizadeh, New J. Chem., 2018, 42, 8553–8566 Search PubMed.
- N. Passe-Coutrin, S. Altenor, D. Cossement, C. Jean-Marius and S. Gaspard, Microporous Mesoporous Mater., 2008, 111, 517–522 Search PubMed.
- M. Y. Akram, S. Ahmed, L. Li, N. Akhtar, S. Ali, G. Muhyodin, X. Zhu and J. Nie, J. Environ. Chem. Eng., 2019, 7, 103137 Search PubMed.
- C. Han, J. Lalley, N. Iyanna and M. N. Nadagouda, Mater. Chem. Phys., 2017, 198, 115–124 Search PubMed.
- J. Liu, J. Cao, Y. Hu, Y. Han and J. Zhou, Water Sci. Technol., 2017, 76, 2867–2875 Search PubMed.
- J. Wang, X. Shao, J. Liu, Q. Zhang, J. Ma and G. Tian, Mater. Chem. Phys., 2020, 249, 123024 Search PubMed.
- F. Yang, S. Zhang, Y. Sun, D. C. W. Tsang, K. Cheng and Y. S. Ok, J. Hazard. Mater., 2019, 365, 665–673 Search PubMed.
- D. Fang, X. Zhuang, L. Huang, Q. Zhang, Q. Shen, L. Jiang, X. Xu and F. Ji, Sci. Total Environ., 2020, 725, 138490 Search PubMed.
| This journal is © The Royal Society of Chemistry 2020 |

