DOI:
10.1039/D0RA07699F
(Paper)
RSC Adv., 2020,
10, 38075-38084
Sustainable hydrogen-rich syngas from steam reforming of bio-based acetic acid over ZnO and CeO2–ZnO supported Ni-based catalysts
Received
8th September 2020
, Accepted 10th October 2020
First published on 15th October 2020
Abstract
Sustainable hydrogen-rich syngas from steam reforming (SR) of bio-based acetic acid over ZnO and CeO2–ZnO supported Ni-based catalysts was studied by means of a bench-scale fixed-bed unit combined with NDIR/TCD techniques. The effects of Ni/ZnO catalysts with different nickel loadings (5–15%), temperature (T = 500–900 °C), steam to carbon molar ratio (S/C = 1–5) and weight hourly space velocity (WHSV = 3–7 h−1) on SR of acetic acid were explored. In addition, the influence of CeO2 addition on the catalytic performance was assessed to investigate the improvement effect of Ce as a promoter on the catalytic activity. As the nickel loading increased from 5 to 15%, the H2 yield increased significantly from 31.0 to 51.0% with a growth rate of 64.5%, while the CO yield first decreased from 31.6 to 27.7% and then increased to 35.7%. Between 500 and 900 °C, the yields of H2 and CO first increased and then decreased, corresponding to the peak yields of 51.0% and 35.7% at 800 °C, respectively. S/C gave a similar trend of H2 yield to the T, while the CO yield continued to decrease with increasing S/C from 1 to 5. The H2 yield gradually decreased from 54.1 to 28.7% as the WHSV increased, while the peak value of CO yield was 35.7%, corresponding to WHSV = 5. The addition of 25 wt% CeO2 to the Ni/ZnO catalyst with a nickel loading of 15% improved the H2 yield from 51.0 to 74.0% when reforming acetic acid under the optimal operating conditions of T = 800 °C, S/C = 3 and WHSV = 5 h−1. The CO yield was reduced from 35.7 to 33.2%, and the corresponding H2/CO ratio increased from 2.9 to 4.5. The excellent catalyst stability was obtained in the SR of acetic acid using Ni/CeO2–ZnO catalyst. H2 yield was reduced from 76.0 to 73.5% with a decrease of 3.4%, while CO yield increased from 32.1 to 41.3% with a growth rate of 28.7% within 15–360 minutes.
1. Introduction
Hydrogen is an ideal and promising energy carrier with a calorific value of 143 kJ g−1,1 which has the advantages of large energy density, high heat conversion efficiency, and environmental friendliness. Hydrogen plays an important role in the synthesis of chemical substances such as pesticides, food flavors, cellulose acetate, etc.,2,3 and it is also a clean fuel for fuel cells.4,5 The total amount of H2 required for industrial applications reaches 60 million tons per year.6 Nowadays, hydrogen is produced in China mainly through the three technical routes: the first is to produce hydrogen mainly through coal gasification or natural gas reforming, which is the main hydrogen production method at present; the second is to produce hydrogen through industrial by-product gas, represented by coke oven gas and chlor-alkali tail gas; the third is hydrogen production by electrolysis of water, accounting for only about 1%. The original intention of developing hydrogen energy is to reduce the dependence on fossil energy. Therefore, the principles of clean, low-carbon, and efficient for hydrogen production should be grasped to optimize the hydrogen energy structure from the source and develop the hydrogen energy industry. Biomass is currently considered to be a promising and sustainable raw material for hydrogen production by virtue of its renewability, low pollution, wide distribution, carbon neutrality, etc.7
The development of bio-based chemicals derived from renewable biomass (starch, glucose, lignocellulose, etc.) to produce environmentally friendly chemical products and green energy is the only way for mankind to achieve sustainable development.8 Acetic acid is a bio-based intermediate that is easily derived from sugars9 and can be prepared by artificial synthesis and bacterial fermentation.10–12 Currently, biosynthesis (using bacterial fermentation) is considered the most important method for producing acetic acid.13 The production of acetic acid produced by biosynthesis accounts for 10% of the total production in the world. As a future bio-based platform chemical,14 acetic acid has wide applications in food flavors, textile printing and dyeing, rubber industry and the synthesis of organic substances.15 It need to mention that hydrogen as a high-quality clean fuel can be produced by steam reforming (SR) of acetic acid.16 The main reactions involved in the SR reaction process are as follows: complete SR of acetic acid (eqn (1)), thermal decomposition (eqn (2) and (3)), water gas shift reaction (eqn (4)), methanation reactions (eqn (5) and (6))
| | |
CH3COOH + 2H2O → 2CO2 + 4H2
| (1) |
| | |
CO2 + 4H2 → CH4 + 2H2O
| (6) |
Nickel-based catalysts are most commonly used for SR of acetic acid due to its low cost, strong C–C and C–H bond cleavage activity,17,18 high catalytic activity as well as selectivity. Nevertheless, the thermal sintering of Ni particles and the carbon deposits generated during the reaction process are usually the main reason of hindering the catalyst stability. The thermal sintering of Ni particles is mainly caused by the high temperature due to the limited heat resistance of catalysts, and the carbon deposits are mostly caused by the polymerization reaction that occurs at the acidic sites.19,20 Many researches have proved that the thermal stability and anti-carbon properties of the catalysts can be increased via improving the dispersion of the active components. Using alkaline supports such as MgO, ZnO, etc. or introducing efficient promoters such as Ce, La, etc. can improve the dispersion of Ni particles. ZnO is an n-type semiconductor oxide with Brønsted basicity,21 which can modulate the physical and chemical properties of the loaded active components, enhance the strength of the metal–support interaction, and improve the dispersion of the active components.22 ZnO has excellent performance for the catalyst supports due to its low toxicity,23 high specific surface area, and good thermochemical stability.24,25 Casanovas et al.26 pointed out that alkaline supports with redox properties such as ZnO should be used to avoid carbon deposits formed during the reaction on acidic supports. Rodriguez et al.27 found that the coking rate of Ni/Al2O3 catalyst was reduced after introducing ZnO as a promoter. Zeng et al.28 confirmed that some larger Zn2+ ions were conducive to the formation of a porous structure and increased the specific surface area of the supports. Yang et al.29 evaluated the influence of nickel-based catalysts with different supports on the ethanol SR and found that Ni/ZnO exhibited good hydrogen selectivity. In order to further improve the thermal stability and carbon deposition resistance of the catalyst, CeO2 can be introduced to modify Ni/ZnO to adjust the acid–base properties and oxygen vacancy distribution on the catalyst surface. CeO2 is considered to be a good support for the development of SR catalysts due to its unique functions related to oxygen migration and storage capacity30 as well as the formation of the metal–support redox couple, thereby promoting the strong interaction between the metal and support,31,32 which helps to enhance the dispersion of active components,33–35 improve the thermal stability of the catalyst36 and inhibit carbon deposition.37,38
In this study, sustainable hydrogen-rich syngas from SR of bio-based acetic acid over ZnO and CeO2–ZnO supported Ni-based catalysts was studied by means of a bench-scale fixed-bed unit combined with NDIR/TCD techniques. The effects of Ni/ZnO catalysts with different nickel loadings (5–15%), temperature (T = 500–900 °C), steam to carbon molar ratio (S/C = 1–5) and weight hourly space velocity (WHSV = 3–7 h−1) on SR of acetic acid were explored. In addition, the influence of Ce addition on the catalytic performance was assessed to investigate the improvement effect of Ce as a promoter on the catalytic activity.
2. Experimental
2.1 Catalyst preparation
The Ni/ZnO catalysts with different nickel loading were prepared by impregnation method using nickel nitrate as the metal precursor. Definite amount of Ni(NO3)·6H2O (Sinopharm Chemical Reagent Co., Ltd.) which was calculated according to the specific nickel loading on ZnO (Tianjin Youpu Chemical Reagent Co., Ltd.), were dissolved in deionized water. The ZnO support was then added into the aqueous solution of nickel nitrate under constant stirring for 2 h at 70 °C. After that, the sample was vacuum filtered and was then transferred to an oven and dried for 12 h at 100 °C. Finally, the samples were calcined in a muffle furnace at 600 °C for 3 h in an air atmosphere. The Ni/ZnO catalysts with nickel loadings of 5%, 10%, and 15% were obtained, which were denoted as 5Ni/ZnO, 10Ni/ZnO, and 15Ni/ZnO, respectively.
The CeO2–ZnO composite oxides support was prepared by the co-precipitation method as follows. Zn(CH3COO)2·H2O (Tianjin Damao Chemical Reagent Factory) and Ce(NO3)3·6H2O (Tianjin Aopusheng Chemical Co., Ltd.) as the corresponding precursors were dissolved in deionized water according to the desired mass ratio and precipitation was induced by the addition of 4 mol L−1 NaOH (Tianjin Zhiyuan Chemical Reagent Co., Ltd.) solution with a rate of 0.5 drops per second. The as-prepared precipitation was centrifuged at 3000 rpm for 15 minutes and dried for 12 h at 100 °C to obtain CeO2–ZnO support (CeO2 and ZnO account for 25% and 75% of the support mass, respectively).
Supported Ni-based catalysts were prepared by impregnation method using an aqueous solution of nickel nitrate hexahydrate (Ni(NO3)·6H2O). The CeO2–ZnO support was added to the nickel nitrate aqueous solution and stirred at 70 °C for 2 h. Then, the slurry was centrifuged at 3000 rpm for 15 minutes, dried at 100 °C for 12 h and calcined at 600 °C for 3 h to obtain 15Ni/CeO2–ZnO catalyst which nickel loading was 15%.
2.2 Catalyst characterization
The catalyst surface morphology was observed by field emission scanning electron microscopy (SEM). The SEM images were characterized using a Quanta 250 (American FEI Co., Ltd.) with the accelerating voltage of 10 kV. The crystallization properties of the catalysts were conducted by X-ray diffraction (XRD). The XRD patterns were obtained using a D8 ADVANCE X-ray diffractometer of Bruker AXS, Germany. The data were recorded from a start angle of 20 to an end angle of 80 when the operating voltage was 40 kV, the current was 50 mA, the wavelength of Cu Kα radiation was 0.154 nm, and the step size was 0.02°.
2.3 SR of acetic acid test
The SR system of acetic acid consists of a feeder, a bench-scale fixed-bed device, a condensation separation system and an infrared flue gas analyzer. Prior to reaction, the catalyst (3 g, 35 mm) was loaded on the bracket in the middle of the fixed-bed tubular reactor and reduced in situ for 30 min under a 10% H2/N2 atmosphere at 800 °C. After the reduction was completed, the reactor was purged with N2 until the hydrogen was exhausted. N2 was used as carrier gas during the reaction, and the flow rate remained constant. At the beginning of the reaction, the acetic acid aqueous solution was introduced into the fixed-bed device through a peristaltic pump (BT100-2J, Baoding Lange Constant Flow Pump Co., Ltd.). The produced gas passed through a condensing separation system to mostly separate excess water, some unconverted reactants and liquid byproducts. Afterward, the non-condensable gas was dried by activated carbon and passed into an infrared flue gas analyzer (Gasboard-3100, Wuhan Cube Optoelectronics Co., Ltd., China.). The content of H2, CO, CO2, CH4 and other gas composition was recorded online in real time. After the reaction was completed, the feeding was stopped, and the catalyst was removed after cooling to room temperature under N2 atmosphere. After each experiment, the reactor was fired at 800 °C to clear away carbon deposits from the tube wall to ensure the accuracy of the experimental results and the consistency of the experimental conditions.
2.4 Data analysis
The overall SR of acetic acid for hydrogen production could be simply represented by the eqn (1). The catalytic performances of the catalysts were explored in terms of yields selectivities and contents of gaseous products. The yields of H2, CO, CO2, CH4 and the selectivities of H2, CO were calculated by the eqn (7)–(10).| |
 | (7) |
| |
 | (8) |
| |
 | (9) |
| |
 | (10) |
3. Results and discussion
3.1 Comparative analysis on characterization of fresh and used 15Ni/ZnO and 15Ni/CeO2–ZnO catalysts
3.1.1 SEM analysis. The SEM images of the fresh and used 15Ni/ZnO and 15Ni/CeO2–ZnO catalysts at T = 800 °C, S/C = 3, and WHSV = 5 h−1 are presented in Fig. 1 and 2. The fresh 15Ni/ZnO catalyst shows an irregular short-rod structure, while the fresh 15Ni/CeO2–ZnO catalyst has a granular morphology (see Fig. 1(a) and 2(a)). The dispersion of the fresh catalyst particles is relatively uniform, and the surfaces of the catalysts are uneven to form rich pore structure, which not only facilitate the dispersion of active components, but also increase the contact area between catalysts and reactants, thereby improving the catalytic activity. The morphology and size of the used catalysts have changed: the particles size becomes larger, the surface is smoother, the structure is denser, and the agglomeration is obvious. The sintering of nickel-based catalysts tends to occur under high T conditions, which increases the particles size and reduces the catalytic activity.39 In addition, the coke generated during the SR of acetic acid will deposit in the pore structure for filling, or wrap on the surface of nickel particles,40 causing the particles to gradually grow.
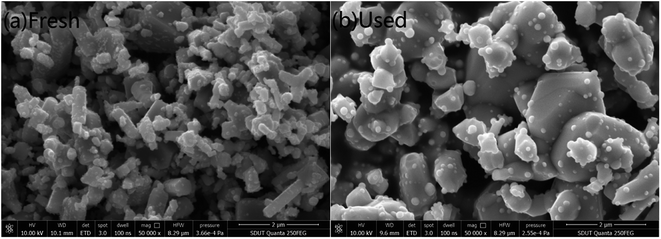 |
| | Fig. 1 SEM images of the (a) fresh and (b) used 15Ni/ZnO catalysts. | |
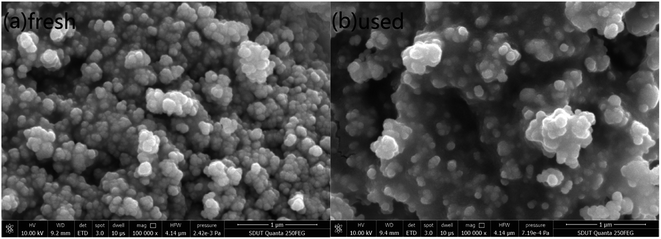 |
| | Fig. 2 SEM images of the (a) fresh and (b) used 15Ni/CeO2–ZnO catalysts. | |
3.1.2 XRD analysis. The XRD patterns of the fresh and used catalysts at T = 800 °C, S/C = 3, and WHSV = 5 h−1 are shown in Fig. 3. The NiO characteristic peaks in the fresh 15Ni/CeO2–ZnO catalyst appear at 2θ = 37.3°, 43.3°, 62.9° and 75.4°, which are assigned to the NiO(111), NiO(200), NiO(220) and NiO(311) bands, respectively. However, the only weak Ni characteristic peaks are observed at 2θ = 44.5°, 51.6° in the reformed catalyst, corresponding to Ni(111), Ni(200) bands. The fresh 15Ni/ZnO catalyst has the NiO characteristic diffraction bands at 2θ = 37.3° and 43.3°. Furthermore, there are the same Ni diffraction peak positions observed in the used 15Ni/ZnO and 15Ni/CeO2–ZnO catalysts. Compared with the fresh 15Ni/ZnO catalyst, the intensities of the NiO peaks are significantly increased in the fresh 15Ni/CeO2–ZnO catalyst, indicating that the 15Ni/CeO2–ZnO catalyst surface is more conducive to the dispersion of NiO under the same theoretical loading, resulting in higher catalytic activity, which is consistent with the results shown in Fig. 5. Moreover, the diffraction peaks of NiO are not found in the used 15Ni/CeO2–ZnO and 15Ni/ZnO catalysts. The above results proved that NiO was completely reduced to Ni. As can be seen, compared with the fresh catalysts, the diffraction peak intensities of the reformed catalyst are obviously weakened, which may be due to the formation of amorphous carbon on the catalyst surface.
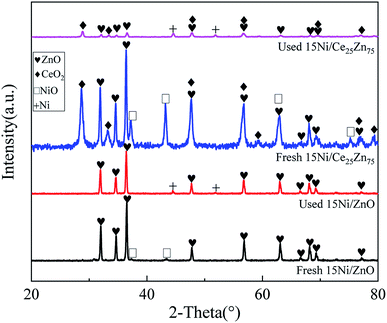 |
| | Fig. 3 XRD patterns of the fresh and used catalysts at T = 800 °C, S/C = 3, and WHSV = 5 h−1. | |
3.2 SR of acetic acid over Ni/ZnO catalysts
3.2.1 Effect of Ni/ZnO catalysts with different nickel loadings on SR of acetic acid. The variation of yields, selectivities and contents of gaseous products over Ni/ZnO catalysts with different nickel loadings at T = 800 °C, S/C = 3, and WHSV = 5 h−1 is displayed in Fig. 4. From Fig. 4, the yields of H2, CO, CO2 and CH4 are 51.0%, 35.7%, 25.8% and 5.4%, respectively, when the nickel loading is 15%. The SR effect of acetic acid over Ni/ZnO catalysts is significantly improved than that in the absence of the catalyst from the perspective of H2, CO, CO2 and CH4 yields. In the SR of acetic acid with no catalyst, the yields of H2, CO, CO2 and CH4 are 1.7%, 3.7%, 1.1% and 1.0%, respectively. As the nickel loading increases from 5% to 15%, the H2 yield increases significantly from 31.0% to 51.0% with a growth rate of 64.5%, while the CO yield first decreases from 31.6% to 27.7% and then increases to 35.7%. The trend of CO2 yield is opposite to CO yield, and the CH4 yield shows a downward trend with increasing nickel loading. The low CO yield in the presence of 10Ni/ZnO catalyst during the SR of acetic acid is shown. This research finding is different from those reported in other studies.41,42 Zhang et al.41 performed the SR of acetic acid over Ni/Al2O3 and 5% KOH–Ni/Al2O3 catalysts and found that increasing the nickel loading from 0 to 20% gave rise to a continuous increase slowly in CO yield. Zhang et al.42 examined the effect of nickel loading on the SR of acetic acid over the Ni/γ-Al2O3 catalysts at 600 °C and pointed out that the CO yield first increased rapidly and then began to decrease constantly with raising the nickel loading from 0 to 40%. The nickel-based catalyst has a significant effect for SR of acetic acid due to its strong C–C and C–H bond cleavage activity,43 and high catalytic activity as well as selectivity. The efficiency of nickel-based catalysts for SR of acetic acid increases with the increase of nickel loading, which is consistent with the research report of Zhang et al.41
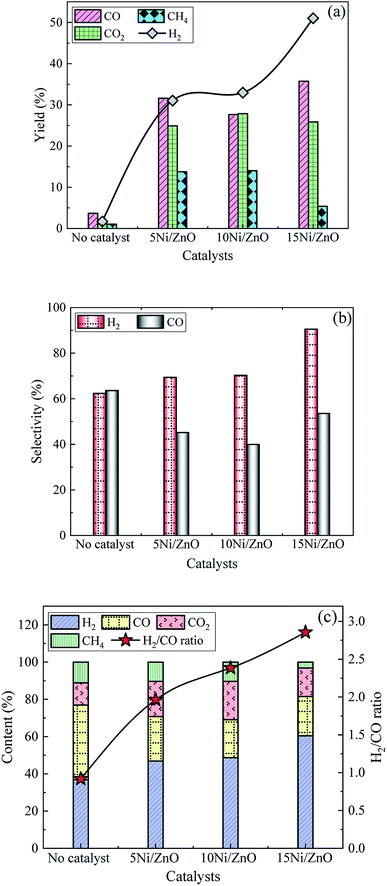 |
| | Fig. 4 The variation of (a) yields, (b) selectivities and (c) contents of gaseous products over Ni/ZnO catalysts at T = 800 °C, S/C = 3, and WHSV = 5 h−1. | |
The formation of H2 and CO may be mainly result from the thermal decomposition (eqn (2)) of acetic acid without the use of catalysts.41,44 The selectivity and content of H2 are 62.2% and 36.8%, respectively, while the selectivity and content of CO reach the maximum values of 63.5% and 40.1%. The selectivity and content of H2 show a gradually increasing trend with the nickel loading from 5% to 15%. The H2 selectivity and content reach 90.5% and 60.4%, respectively, when the nickel loading is 15%. The selectivity and content of CO first decrease and then increase, which is the same as the variation trend of CO yield. At the same time, the H2/CO ratio gradually increases from 2.0 to 2.9. The CO2 content is opposite to the CO content, while the CH4 content shows a gradual decrease trend. With the increase of nickel loading, more active sites are provided for the reaction, which leads to an increase in the reaction activity of the catalyst45 and a faster H2 production rate. And it promotes the occurrence of the water gas shift reaction (eqn (4)), resulting in higher H2 selectivity. The above data proves that 15Ni/ZnO has a better ability to selectively generate hydrogen, thereby significantly increasing the H2 yield.
3.2.2 Effect of T on SR of acetic acid. Effect of reforming T on the yields, selectivities and contents of gaseous products over 15Ni/ZnO catalyst at S/C = 3 and WHSV = 5 h−1 is shown in Fig. 5. Between 500 and 900 °C, the yields of H2 and CO first increase and then decrease, corresponding to the peak yields of 51.0% and 35.7% at 800 °C, respectively, as shown in Fig. 2. The CO2 yield shows a slowly increasing trend in the range of 500–900 °C, while the CH4 yield first increases, then decreases slightly and finally increases. The maximum H2 selectivity is 97.8% at 500 °C, but the yields of H2 and CH4 are only 5.0% and 0.1%, respectively. The highest CO selectivity reaches 53.4% which is achieved at 800 °C, and the corresponding H2 selectivity is 90.5%. H2 content is as high as 60.4% at 800 °C while the CO content of 21.1% is only slightly lower than the 22.8% at 600 °C. As the reforming T being raised from 500 to 900 °C, the H2/CO ratio values show a trend of first decreasing and then increasing, reaching a maximum value of 3.1 at 500 °C. Since the complete SR of acetic acid (eqn (1)) is an endothermic reaction, increasing the T can promote the reaction to proceed in the positive direction, resulting in an increase in the yields of H2, CO, CO2, and CH4 as the T increases from 500 to 700 °C. The SR reaction process is accompanied by side reactions such as thermal decomposition (eqn (3)), water gas shift reaction (eqn (4)) and methanation reactions (eqn (5) and (6)). Further increasing T, exothermic reactions such as the water gas shift reaction and methanation reactions are inhibited, resulting in a reverse shift of the reaction equilibrium. Therefore, the CH4 yield decreases and the CO2 yield increases slightly, while the yields of H2 and CO further increase, and the CO selectivity reaches a peak of 53.4% at 800 °C. Metallic Ni particles are easy to sinter under high T conditions, especially in the presence of steam.46 Catalyst sintering is generally referred to as the decrease in catalytic specific surface area due to growth of large particles at the expense of smaller particles, which is the reason for reducing the dispersion of active components and losing catalytic activity.47 Increasing T accelerates the sintering process. The SR reaction is accompanied by more thermal decomposition of acetic acid at 900 °C, which leads to a decrease in the yields of H2 and CO, and the yields of CO2 and CH4 tend to increase. Therefore, 800 °C is the optimal reforming T, taking into account that the highest H2 yield is produced at 800 °C.
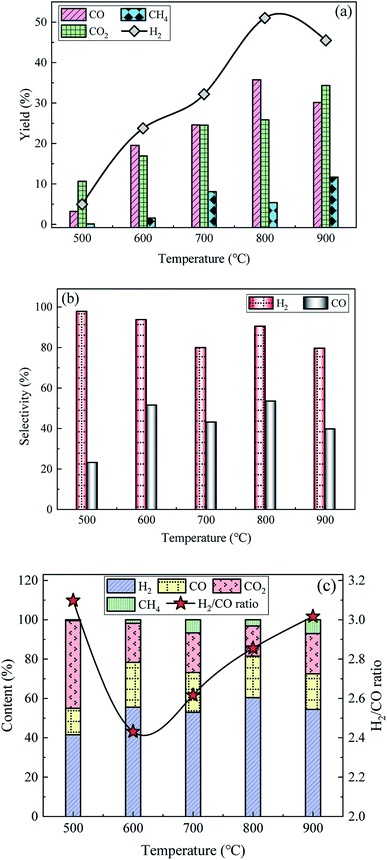 |
| | Fig. 5 Effect of reforming T on the (a) yields, (b) selectivities and (c) contents of gaseous products over 15Ni/ZnO catalyst at S/C = 3 and WHSV = 5 h−1. | |
3.2.3 Effect of S/C on SR of acetic acid. Fig. 6 shows the influence of S/C on the yields, selectivities and contents of the produced gas compositions over 15Ni/ZnO catalyst at T = 800 °C and WHSV = 5 h−1. The H2 yield shows a trend of first rising and then falling with the increase of S/C, while the yield trends of CO2 and CH4 are opposite to that of H2. The CO yield continues to decrease with increasing S/C from 1 to 5, which is consistent with the observation results of our previous study when conducting SR of acetic acid over commercial nickel-based catalysts with a S/C range of 1–7.48 The increase in the acetic acid concentration is conducive to the occurrence of thermal decomposition (eqn (2) and (3)), otherwise it favours the progress of complete SR of acetic acid (eqn (1)), in the process of hydrogen production by SR of acetic acid.49 When S/C = 1, the H2 yield is low. On the one hand, the higher concentration of acetic acid is beneficial for thermal decomposition of acetic acid in the fixed-bed reactor; on the other hand, the feed rate is slow in the same period of time, causing a small amount of acetic acid actually participating in the SR, hindering the production of H2. When S/C = 3, the reactant concentration decreases, which favours the reaction to proceed in the direction of consuming water, thereby promoting the occurrence of the reaction (complete SR of acetic acid, water gas shift reaction and reverse methanation reactions) and increasing the H2 yield. When S/C = 5, although acetic acid can participate in the reaction to the greatest extent, the H2 production is reduced because of the low acetic acid concentration. In addition, the feed rate increases with the increase of S/C under the condition of constant WHSV, which reduces residence time of the reactants on the catalyst bed, causing the reactants being taken out of the furnace by excess water vapor before participating in the reaction.
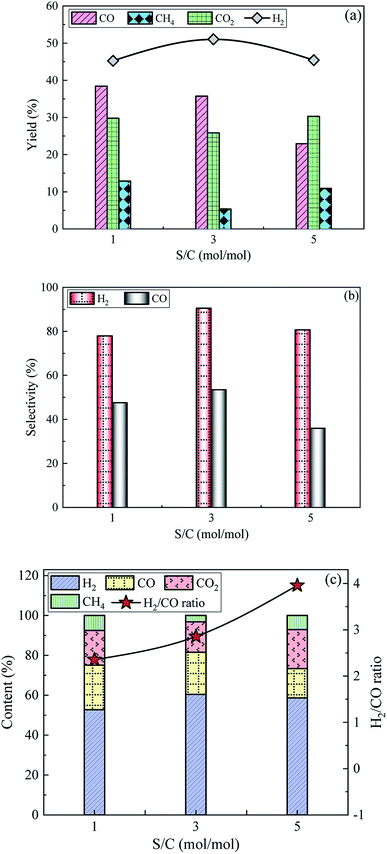 |
| | Fig. 6 Influence of S/C on the (a) yields, (b) selectivities and (c) contents of the produced gas compositions over 15Ni/ZnO catalyst at T = 800 °C and WHSV = 5 h−1. | |
The selectivity and content of H2 first increase and then decrease, which is consistent with the variation trend of H2 yield. The selectivity and content of H2 achieve maximum values of 90.5% and 60.4%, corresponding to S/C of 3. With the increase of S/C, the selectivity of CO first increases and then decreases, while CO content gradually decreases. As S/C increases from 1 to 5, the corresponding H2/CO ratio gradually increases from 2.4 to 4.0. Situmorang et al.6 pointed out that increasing the S/C ratio will reduce the CO/H2 ratio in the produced gas via bio-oil SR at a certain T. The contents of CO2 and CH4 decrease first and then increase. Bio-based acetic acid and steam are completely catalytically converted into H2 and CO2 under ideal conditions with S/C of 1. The increase in S/C facilitates the reaction to proceed toward the direction of water consumption, resulting in the increase of H2 contents, while a decrease in the content of CO. Further increasing S/C to 5, some acetic acid not participating in the reaction is taken away from the fixed-bed device by the excess water vapor, reducing the contents of H2 and CO. In order to ensure good hydrogen production effect, the S/C of 3 is an optimum choice on SR of acetic acid.
3.2.4 Effect of WHSV on SR of acetic acid. The variation patterns of yields, selectivities and contents of gaseous products over 15Ni/ZnO catalyst at T = 800 °C and S/C = 3 are exhibited in Fig. 7. The yields of H2, CO2 and CH4 show a similar variation trend with gradually decreasing as the WHSV increases, while the CO yield first increases and then decreases. The highest yields of H2, CO2 and CH4 are 54.1%, 39.2%, and 14.7%, respectively, corresponding to WHSV of 3, while the peak value of CO yield is 35.7%, corresponding to WHSV = 5. Although the slow feed rate is conducive to the full participation of the raw materials in the SR reaction, the total gas production is low. The feed rate increases with the increase of WHSV, which reduces residence time of the reactants on the catalyst bed, causing some reactants being taken out of the fixed-bed device by excess water vapor before participating in the reaction.50 In addition, the feed rate of the acetic acid solution is further increased, resulting in the reaction generating more carbon deposits attached to the catalysts in a short time due to the limited catalytic ability per unit mass of the catalysts,51 thereby reducing the reaction activity of the catalysts and affecting the overall effect of catalytic reforming.
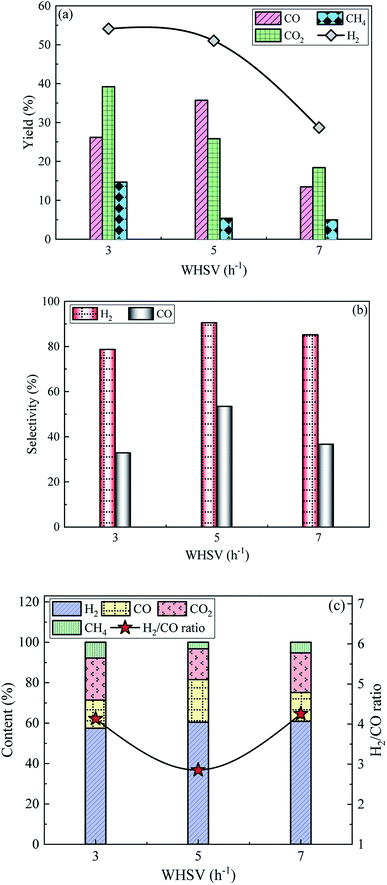 |
| | Fig. 7 The variation of (a) yields, (b) selectivities and (c) contents of gaseous products over 15Ni/ZnO catalyst at T = 800 °C and S/C = 3. | |
The selectivities of H2 and CO show a similar trend as the WHSV increases, which all increase first and then decrease. H2 and CO selectivities are as high as 90.5% and 53.4%, respectively, with WHSV of 5. As WHSV increases from 3 to 7, the H2 content increases slowly from 57.5% to 60.8%. The CO content first increases and then decreases. Correspondingly, the H2/CO ratio exhibits the opposite trend with first decreasing and then increasing. The highest value of H2/CO ratio is 4.3, which is obtained at WHSV = 7. The contents of CO2 and CH4 decrease first and then increase. The increase in the reactant concentration in furnace with the increase of WHSV facilitates the forward reaction according to Le Chatelier's principle in consequence increasing the H2 content slowly. With further increase in WHSV, the SR reaction is accompanied by more thermal decomposition (eqn (3)) of acetic acid, resulting in an increase in CO2 and CH4 content, while the reduction in CO content is based on the conservation of carbon. Considering that the highest CO yield is 35.7% at WHSV = 5, and CO can be converted into H2 through water gas shift reaction, 5 is the optimal WHSV from the perspective of potential H2 yield.
3.3 Comparative studies on the SR of acetic acid over 15Ni/ZnO and 15Ni/CeO2–ZnO catalysts
The SR of acetic acid over 15Ni/ZnO and 15Ni/CeO2–ZnO catalysts was studied at T = 800 °C, S/C = 3, and WHSV = 5 h−1. The comparison of yields, selectivities and contents of gaseous products during the SR of acetic acid by using two different catalyst is displayed in Fig. 8. Compared with 15Ni/ZnO catalyst, 15Ni/CeO2–ZnO catalytic SR of bio-based acetic acid for sustainable hydrogen-rich syngas increases the yield, selectivity and content of H2 from 51.0%, 90.5% and 60.4% to 74.0%, 91.3% and 64.1%, corresponding to the growth rate of 45.1%, 0.9% and 6.1%, respectively. As CeO2 promotes the water gas shift reaction,52 the yield, selectivity and content of CO are reduced from 35.7%, 53.4% and 21.1% to 33.2%, 40.1%, and 14.4%, respectively, and the corresponding H2/CO ratio increases from 2.9 to 4.5. The yields of CO2 and CH4 are significantly improved from 25.8% and 5.4% to 42.6% and 7.0%, respectively. Coke generation was suppressed53 and carbon deposition resistance was improved by introducing CeO2 into the catalyst. The ability of the Ni surface to oxidize coke is enhanced due to the oxygen transfer capacity of CeO2,54 which significantly improves the catalytic ability of catalysts to selectively produce H2 under high T conditions.
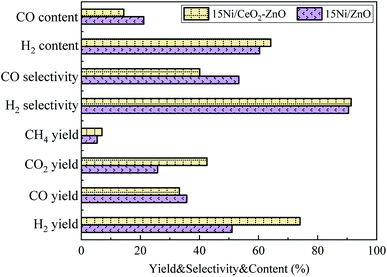 |
| | Fig. 8 Comparison of yields, selectivities and contents of gaseous products over 15Ni/ZnO and 15Ni/CeO2–ZnO catalysts at T = 800 °C, S/C = 3, and WHSV = 5 h−1. | |
To explore the stability of 15Ni/CeO2–ZnO catalyst, the SR of acetic acid was carried out for 6 h at T = 800 °C, S/C = 3, and WHSV = 5 h−1. Fig. 9 shows the yields, selectivities and contents of gaseous products with time. As the acetic acid SR reaction proceeds over 15Ni/CeO2–ZnO catalyst, the yields, selectivities and contents of gaseous products first increase or decrease slightly, and then stabilize. The yields of H2, CO, CO2 and CH4 are stabilized at 73.5%, 41.3%, 49.6% and 6.8%, respectively. The selectivities of H2 and CO are as high as 91.6% and 42.3%, while their contents are stable at 60.1% and 16.9% respectively. The 15Ni/CeO2–ZnO catalyst exhibits excellent stability during the process of the bio-based acetic acid SR to sustainable hydrogen-rich syngas. H2 yield is reduced from 76.0% to 73.5% with a decrease of 3.4%, while CO yield increases from 32.1% to 41.3% with a growth rate of 28.7% within 15–360 minutes.
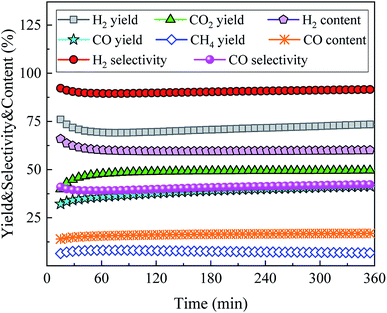 |
| | Fig. 9 Stability tests of the 15Ni/CeO2–ZnO catalyst for SR of acetic acid at T = 800 °C, S/C = 3, and WHSV = 5 h−1. | |
4. Conclusions
Sustainable hydrogen-rich syngas from SR of bio-based acetic acid over ZnO and CeO2–ZnO supported Ni-based catalysts was studied by means of a bench-scale fixed-bed unit combined with NDIR/TCD techniques. The effects of Ni/ZnO catalysts with different nickel loadings (5–15%), T (500–900 °C), S/C = (1–5) and WHSV (3–7 h−1) on SR of acetic acid were explored. In addition, the influence of CeO2 addition on the catalytic performance was assessed to investigate the improvement effect of Ce as a promoter on the catalytic activity. As the nickel loading increased from 5 to 15%, the H2 yield increased significantly from 31.0 to 51.0% with a growth rate of 64.5%, while the CO yield first decreased from 31.6 to 27.7% and then increased to 35.7%. Between 500 and 900 °C, the yields of H2 and CO first increased and then decreased, corresponding to the peak yields of 51.0% and 35.7% at 800 °C, respectively. S/C gave similar trend of H2 yield to the T, while the CO yield continued to decrease with increasing S/C from 1 to 5. The H2 yield gradually decreased from 54.1 to 28.7% as the WHSV increased, while the peak value of CO yield was 35.7%, corresponding to WHSV = 5. The addition of 25 wt% CeO2 to the Ni/ZnO catalyst with nickel loading of 15% improved the H2 yield from 51.0 to 74.0% when reforming acetic acid under the optimal operating conditions of T = 800 °C, S/C = 3 and WHSV = 5 h−1. The CO yield was reduced from 35.7 to 33.2%, and the corresponding H2/CO ratio increased from 2.9 to 4.5. The excellent catalyst stability was obtained in the SR of acetic acid using Ni/CeO2–ZnO catalyst. H2 yield was reduced from 76.0 to 73.5% with a decrease of 3.4%, while CO yield increased from 32.1 to 41.3% with a growth rate of 28.7% within 15–360 minutes.
Conflicts of interest
There are no conflicts to declare.
Acknowledgements
The authors gratefully thank the support for this research from National Natural Science Foundation of China (No. 51676116, 51976112, 51206100 and 61704098), Youth Innovation Support Program of Shandong Colleges and Universities (2019KJD013), Zibo Key R & D Project (2019ZBXC300) and Shandong Provincial Natural Science Foundation of China (No. ZR2017BF025).
References
- Y. Wang, D. Liang, C. Wang, M. Chen, Z. Tang, J. Hu, Z. Yang, H. Zhang, J. Wang and S. Liu, Renewable Energy, 2020, 160, 597–611 CrossRef CAS.
- Z. Yu, X. Hu, P. Jia, Z. Zhang, D. Dong, G. Hu, S. Hu, Y. Wang and J. Xiang, Appl. Catal., B, 2018, 237, 538–553 CrossRef CAS.
- M. Parente, M. A. Soria and L. M. Madeira, Renewable Energy, 2020, 157, 1254–1264 CrossRef CAS.
- O. A. Omoniyi and V. Dupont, Appl. Catal., B, 2018, 226, 258–268 CrossRef CAS.
- H. Li, H. Tian, S. Chen, Z. Sun, T. Liu, R. Liu, S. Assabumrungrat, J. Saupsor, R. Mu, C. Pei and J. Gong, Appl. Catal., B, 2020, 276, 119052 CrossRef CAS.
- Y. A. Situmorang, Z. Zhao, P. An, T. Yu, J. Rizkiana, A. Abudula and G. Guan, Appl. Energy, 2020, 268, 115122 CrossRef CAS.
- O. A. Omoniyi and V. Dupont, Appl. Catal., B, 2019, 242, 397–409 CrossRef CAS.
- P. O. Saboe, L. P. Manker, W. E. Michener, D. J. Peterson, D. G. Brandner, S. P. Deutch, M. Kumar, R. M. Cywar, G. T. Beckham, E. M. Karp and U.S. National Renewable Energy Lab. NREL, Green Chem., 2018, 20, 1791–1804 RSC.
- C. R. Vitasari, G. W. Meindersma and A. B. de Haan, Chem. Eng. Res. Des., 2015, 95, 133–143 CrossRef CAS.
- Z. Huo, Y. Fang, G. Yao, X. Zeng, D. Ren and F. Jin, J. Energy Chem., 2015, 24, 207–212 CrossRef.
- X. Gao, X. Chen, J. Zhang, W. Guo, F. Jin and N. Yan, ACS Sustainable Chem. Eng., 2016, 6b–767b Search PubMed.
- H. Su, J. Wang and L. Yan, ACS Sustainable Chem. Eng., 2019, 7, 18476–18482 CrossRef CAS.
- S. Li, P. Li, X. Liu, L. Luo and W. Lin, Appl. Microbiol. Biotechnol., 2016, 100, 4395–4411 CrossRef CAS.
- C. R. Vitasari, G. W. Meindersma and A. B. de Haan, Chem. Eng. Res. Des., 2015, 95, 133–143 CrossRef CAS.
- X. Christodoulou and S. B. Velasquez-Orta, Environ. Sci. Technol., 2016, 50, 11234–11242 CrossRef CAS.
- W. Nabgan, T. A. Tuan Abdullah, R. Mat, B. Nabgan, Y. Gambo, M. Ibrahim, A. Ahmad, A. A. Jalil, S. Triwahyono and I. Saeh, Renewable Sustainable Energy Rev., 2017, 79, 347–357 CrossRef CAS.
- A. C. Basagiannis and X. E. Verykios, Int. J. Hydrogen Energy, 2007, 32, 3343–3355 CrossRef CAS.
- F. Bossola, S. Recchia and V. D. Santo, Curr. Catal., 2018, 7, 89–98 CrossRef CAS.
- A. Iriondo, V. L. Barrio, J. F. Cambra, P. L. Arias, M. B. Guemez, M. C. Sanchez-Sanchez, R. M. Navarro and J. L. G. Fierro, Int. J. Hydrogen Energy, 2010, 35, 11622–11633 CrossRef CAS.
- N. Pinton, M. V. Vidal, M. Signoretto, A. Martínez-Arias and V. Cortés Corberán, Catal. Today, 2017, 296, 135–143 CrossRef CAS.
- W. Fei, H. Li, N. Li, D. Chen, Q. Xu, H. Li, J. He and J. Lu, Sol. Energy, 2020, 199, 164–172 CrossRef CAS.
- Y. Song, B. Peng, X. Yang, Q. Jiang, J. Liu and W. Lin, Green Energy Environ., 2020 DOI:10.1016/j.gee.2020.05.010.
- J. Xu, M. Li, L. Yang, J. Qiu, Q. Chen, X. Zhang, Y. Feng and J. Yao, Chem. Eng. J., 2020, 394, 125050 CrossRef CAS.
- Y. Zhang, L. Liu, B. Van der Bruggen, M. K. H. Leung and F. Yang, Chem. Eng. J., 2019, 373, 179–191 CrossRef CAS.
- M. Hassanpour, M. Salavati-Niasari, S. A. H. Tafreshi, H. Safardoust-Hojaghan and F. Hassanpour, J. Alloys Compd., 2019, 788, 383–390 CrossRef CAS.
- A. Casanovas, M. Roig, C. de Leitenburg, A. Trovarelli and J. Llorca, Int. J. Hydrogen Energy, 2010, 35, 7690–7698 CrossRef CAS.
- J. C. Rodriguez, E. Romeo, J. L. G. Fierro, J. Santamaría and A. Monzón, Catal. Today, 1997, 37, 255–265 CrossRef CAS.
- G. Zeng, Q. Liu, R. Gu, L. Zhang and Y. Li, Catal. Today, 2011, 178, 206–213 CrossRef CAS.
- Y. Yang, J. Ma and F. Wu, Int. J. Hydrogen Energy, 2006, 31, 877–882 CrossRef CAS.
- L. Santamaria, M. Artetxe, G. Lopez, M. Cortazar, M. Amutio, J. Bilbao and M. Olazar, Fuel Process. Technol., 2020, 198, 106223 CrossRef CAS.
- K. Kamonsuangkasem, S. Therdthianwong, A. Therdthianwong and N. Thammajak, Appl. Catal., B, 2017, 218, 650–663 CrossRef CAS.
- Z. Liu, S. Yao, A. Johnston-Peck, W. Xu, J. A. Rodriguez and S. D. Senanayake, Catal. Today, 2018, 311, 74–80 CrossRef CAS.
- Q. Lu, Y. Hou, S. R. Laraib, O. Khalifa, K. Li, W. Xie, M. Cui and Y. Yang, Fuel Process. Technol., 2019, 192, 57–64 CrossRef CAS.
- X. Yang, J. Da, H. Yu and H. Wang, Fuel, 2016, 179, 353–361 CrossRef CAS.
- D. Sun, Y. Du, Z. Wang, J. Zhang, Y. Li, J. Li, L. Kou, C. Li, J. Li, H. Feng and J. Lu, Int. J. Hydrogen Energy, 2020, 45, 16421–16431 CrossRef CAS.
- M. Greluk, M. Rotko and S. Turczyniak-Surdacka, Renewable Energy, 2020, 155, 378–395 CrossRef CAS.
- A. Vita, G. Cristiano, C. Italiano, L. Pino and S. Specchia, Appl. Catal., B, 2015, 162, 551–563 CrossRef CAS.
- D. G. Araiza, A. Gómez-Cortés and G. Díaz, Catal. Today, 2020, 349, 235–243 CrossRef CAS.
- M. Chen, Y. Wang, Z. Yang, T. Liang, S. Liu, Z. Zhou and X. Li, Fuel, 2018, 220, 32–46 CrossRef CAS.
- N. D. Charisiou, K. N. Papageridis, G. Siakavelas, V. Sebastian, S. J. Hinder, M. A. Baker, K. Polychronopoulou and M. A. Goula, Catal. Today, 2019, 319, 206–219 CrossRef CAS.
- Z. Zhang, X. Hu, G. Gao, T. Wei, D. Dong, Y. Wang, S. Hu, J. Xiang, Q. Liu and D. Geng, Int. J. Hydrogen Energy, 2019, 44, 729–747 CrossRef CAS.
- Z. Zhang, X. Hu, J. Li, G. Gao, D. Dong, R. Westerhof, S. Hu, J. Xiang and Y. Wang, Fuel, 2018, 217, 389–403 CrossRef CAS.
- S. Luo, P. Fu, F. Sun, B. Wang, A. Zhang, J. Wang and Q. Sun, ACS Omega, 2020, 5, 19727–19736 CrossRef CAS.
- O. A. Sahraei, A. Desgagnés, F. Larachi and M. C. Iliuta, Appl. Catal., B, 2020, 119330 CrossRef.
- Z. Zhang, X. Hu, J. Li, G. Gao, D. Dong, R. Westerhof, S. Hu, J. Xiang and Y. Wang, Fuel, 2018, 217, 389–403 CrossRef CAS.
- C. H. Bartholomew, Appl. Catal., A, 1993, 107, 1–57 CrossRef CAS.
- J. Sehested, J. Catal., 2004, 223, 432–443 CrossRef CAS.
- P. Fu, A. Zhang, S. Luo, W. Yi, S. Hu and Y. Zhang, ACS Omega, 2019, 4, 13585–13593 CrossRef CAS.
- R. R. Davda, J. W. Shabaker, G. W. Huber, R. D. Cortright and J. A. Dumesic, Appl. Catal., B, 2005, 56, 171–186 CrossRef CAS.
- F. Ming, X. Qingli, Q. Wei, Z. Zhikai, Z. Suping and Y. Yongjie, Energy Sources, Part A, 2016, 38, 2128–2134 CrossRef.
- F. Díaz Alvarado and F. Gracia, Int. J. Hydrogen Energy, 2012, 37, 14820–14830 CrossRef.
- M. D. Zhurka, A. A. Lemonidou and P. N. Kechagiopoulos, Catal. Today, 2020 DOI:10.1016/j.cattod.2020.03.020.
- F. Jing, S. Liu, R. Wang, X. Li, Z. Yan, S. Luo and W. Chu, Renewable Energy, 2020, 158, 192–201 CrossRef CAS.
- Z. Liu, S. Yao, A. Johnston-Peck, W. Xu, J. A. Rodriguez and S. D. Senanayake, Catal. Today, 2018, 311, 74–80 CrossRef CAS.
|
| This journal is © The Royal Society of Chemistry 2020 |
Click here to see how this site uses Cookies. View our privacy policy here.  Open Access Article
 *a,
Qi Suna and
Jianlin Wanga


