 Open Access Article
Effects of chlorinated Pd precursors and preparation methods on properties and activity of Pd/TiO2 catalysts†
Ye Eun Kim ab,
Mi Yeon Byunac,
Kwan-Young Lee
 *b and
Man Sig Lee
 *ad
*ad
aUlsan Division, Korea Institute of Industrial Technology (KITECH), Ulsan 44413, Republic of Korea. E-mail: lms5440@kitech.re.kr
bDepartment of Chemical and Biological Engineering, Korea University, Seoul 02841, Republic of Korea. E-mail: kylee@korea.ac.kr
cDepartment of Polymer Science and Chemical Engineering, Pusan National University, Busan 46241, Republic of Korea
dDepartment of Green Process and System Engineering, University of Science and Technology (UST), Ulsan 44413, Republic of Korea
First published on 12th November 2020
Abstract
We investigated the effects of Pd precursors and preparation methods on the physicochemical properties and performance of Pd/TiO2 catalysts in the photocatalytic degradation of methyl violet. To confirm the influence of the precursors, Pd/TiO2 catalysts were prepared via chemical reduction (CR) using four different Pd precursors. Additionally, to determine the effects of preparation methods, Pd/TiO2 catalysts were fabricated using K2PdCl4 precursor via three different methods: CR, deposition–precipitation (DP), and impregnation. The CO chemisorption results showed that the catalyst prepared via DP using the K2PdCl4 precursor, i.e., Pd/TiO2_K_DP, displayed the highest Pd dispersion of 12.42% owing to the stable formation of Pd(OH)2, which strongly interacted with the –OH groups on the TiO2 support. Although the catalyst prepared via CR using the Pd(NH3)4Cl2·H2O (PA) precursor, i.e., Pd/TiO2_PA_CR, had the lowest Pd dispersion of 0.7%, it exhibited the highest absorption of 26% after 30 min in the dark. It was found that high Pd2+/Pd0 ratio in dark conditions adversely affected the absorption of MV owing to electrostatic repulsion between the cationic dyes and metal nanoparticles. However, the Pd dispersion and the specific surface area played a key role in the photocatalytic activity under UV irradiation. Pd/TiO2_K_CR with higher Pd dispersion showed the highest photocatalytic activity and reaction rate of 0.0212 min−1.
Introduction
Methyl violet, a cationic, basic, and hazardous dye, is extensively used in various industries.1 Approximately 20% of the commercial dye used is discarded.2 It is not removed via washing with water and causes water pollution. In general, only 80% of the dye molecules and chemical mixtures can be decolorized.3 Dye effluents are harmful to living beings and pose the risk of cancer to humans.4 Countless research papers have been published on biological, physical, and electrochemical methods for the successful removal of dye particles.5–7 Photocatalytic degradation of dye molecules is an efficient and environment-friendly process to remove organic pollutants and does not produce additional toxic by-products.Photocatalysts are typically fabricated from semiconductors owing to their unique physical and chemical properties under light irradiation. Among a wide range of semiconductors, TiO2 has attracted significant attention owing to its high chemical and thermal stability, low cost, and non-toxicity. In recent reviews, the deposition of noble metals such as Ag, Au, Pd, and Pt was found to improve the photocatalytic performance significantly. Many studies have shown that Pd/TiO2 exhibits higher photocatalytic activity compared with that of pristine TiO2.8–10 Khojasteh et al. demonstrated that the metallic state further enhanced the photodegradation of rhodamine B owing to the creation of a Schottky barrier between Pd0 and TiO2.11 Wu et al. reported enhanced adsorption capacity of NO over Pd2+ modified on TiO2.12 Meng et al. reported that Pd2+ doped on semiconductors increased the photodegradation of rhodamine B by narrowing the band gap of the latter.13
Herein, we investigated the effects of four Pd precursors and three preparation methods on the Pd charge states and photocatalytic activity of the corresponding Pd/TiO2 catalysts based on their photocatalytic degradation of methyl violet 2B (MV).
Experimental
Materials
Palladium(II) chloride (PdCl2, 99.9%), palladium(II) nitrate hydrate (Pd(NO3)2·2H2O, ≥99.0%), tetraamine palladium(II) chloride (Pd(NH3)4Cl2·H2O, 98%), hydrochloric acid (HCl solution, 38%), sodium chloride (NaCl, 99.9%), sodium tartrate (Na2C4H4O6, ≥99.0%), sodium hydroxide (NaOH, 99.8%), sodium borohydride (NaBH4, 98.0%), and 5,5-dimethyl-pyrroline-N-oxide (DMPO) were purchased from Sigma Aldrich. Potassium tetrachloropalladate(II) (K2PdCl4, 99.99%) and sodium formate (HCOONa, 99.0%) were purchased from Alfa Aesar. Commercial TiO2 (P25) was purchased from Evonik Degussa.Preparation of catalysts
The Pd precursors were prepared by dissolving 0.1 mol PdCl2 in 0.2 M HCl solution or 0.2 M NaCl solution and 0.1 mol of K2PdCl4, 0.1 mol Pd(NO3)2·2H2O, and 0.1 mol Pd(NH3)4Cl2·H2O in distilled water.A series of 5 wt% Pd/TiO2 catalysts was prepared via chemical reduction (CR) using four different Pd precursors: H2PdCl4 (H), K2PdCl4 (K), Na2PdCl4 (N), and Pd(NH3)4Cl2·H2O (PA). We then prepared Pd/TiO2 catalysts using the precursor K via three different methods of preparation: CR, deposition–precipitation (DP), and impregnation (IM).
In the CR method, 5.64 mL of 0.1 M Pd precursor was suspended into 0.15 mmol Na2C4H4O6 in 150 mL of distilled water at 5 °C, following which 1.14 g of TiO2 support was added. A 0.02 M NaOH solution was injected to adjust the pH value to 11 and the mixture was stirred for 2 h. Thereafter 30 mmol NaBH4 in 100 mL of distilled water was injected to reduce the Pd2+ ions in the aqueous medium and the mixture was stirred for an additional 2 h. After reduction for 2 h, the solution was filtered, washed, and dried at 105 °C for 12 h.
In the DP method, 100 mL of distilled water was heated to 60 °C, following which 0.1 M K2PdCl4 was added and 1.14 g of TiO2 support was suspended into the solution. Next, 0.25 M NaOH was added to the TiO2 suspension to adjust the pH value to 11 for 3 h. Thereafter, 30 mmol HCOONa in 100 mL of distilled water was injected and the mixture was stirred for another 3 h. The solution was filtered, washed, and dried at 105 °C for 12 h.
In the IM method, 0.1 M K2PdCl4 in 50 mL of distilled water was stirred with 1.14 g of TiO2 support for 1 h to impregnate the Pd precursor. After the excess water had evaporated, the impregnated catalysts were dried at 105 °C for 1 h, calcined in air at 400 °C for 4 h, and then heated at 200 °C for 2 h in a 4% H2/N2 flow.
The catalysts prepared were denoted by Pd/TiO2_A_B (A: Pd precursor, B: preparation method).
Catalyst characterization
To identify the phase compositions of the catalysts prepared, their X-ray diffraction (XRD) patterns were obtained using a D/MAX 2500-V/PC instrument (Rigaku, Japan) with Cu Kα radiation. The 2θ scanning range was 10–80° at a scan rate of 5° min−1. The physical properties of the support and the catalysts prepared were studied based on N2 adsorption–desorption at 77 K using a Brunauer–Emmett–Teller (BET) apparatus on an ASAP 2020 instrument (Micromeritics, USA). Each sample was degassed under vacuum (<10 mm Hg) at 150 °C for 4 h before N2 physisorption. Micropore volume was calculated by the Horvath–Kawazoe (HK) method assuming slit pore geometry. To confirm the functional groups on the support and catalysts, Fourier transform infrared spectroscopy (FT-IR) was performed with a 1700 series FT-IR spectrometer (PerkinElmer, USA) in the 400–4000 cm−1 range using the KBr pellet method. The CO chemisorption measurements were carried out using an ASAP 2020 instrument (Micromeritics, USA) to identify the Pd dispersion and amount of CO adsorbed. The catalysts prepared were evacuated at 200 °C for 30 min and reduced in H2 at 250 °C for 2 h. Subsequently, they were evacuated again at 250 °C for 2 h and then cooled to 35 °C. The temperature-programmed desorption of CO (CO-TPD) was performed using an AutoChem 2920 instrument (Micromeritics, USA). Approximately 0.1 g of each Pd/TiO2 catalyst was placed in a reactor and CO (10% CO/He, 50 mL min−1) was adsorbed at a heating rate of 5° min−1 as the temperature was increased from 40 °C to 500 °C. The Pd particle size and distribution were obtained using a JEM-2010 transmission electron microscope (JEOL, Japan) operated at 200 kV with an optical point-to-point resolution of 0.23 nm. The X-ray photoelectron spectroscopy (XPS) analyses were carried out using a K-Alpha+ instrument (Thermo Fisher Scientific, USA). The diffuse reflectance spectra were analyzed using an ultraviolet-visible light (UV-vis) spectrophotometer (Shimazu, Japan) in the wavelength range 200–700 nm to calculate the band gap energies. BaSO4 was used as the reference sample. The generation of the reactive oxygen species (ROS) was observed by the JES-TE200 electron spin resonance (ESR, JEOL, Japan). DMPO was used as hydroxyl radical (˙OH) spin trapping agent and its concentration was 100 mM. The catalyst was suspended in DMPO aqueous solution. After UV irradiation for 5 min, the sample was taken very quickly and analyzed. ESR spectroscopy was measured under the following conditions: microwave power = 18.7 mW, microwave frequency = 9.418 GHz, center field = 340.1 mT, modulation frequency = 100 kHz, and sweep time = 2 min.Catalytic performance
The photocatalytic degradation of MV was carried out via the addition of 50 mg of catalyst into 50 mL of 25 ppm MV dye solution. The UV irradiation was provided by a 20 W UV lamp (Hangzhou Lijing Lighting Co., Ltd., China) with 365 nm wavelength radiation and an intensity of 1100 μW cm−2. The reactor was placed such that the sample was perpendicular to the UV light source at a distance of 10 cm. Each suspension prepared was magnetically stirred at 25 ± 2 °C in the dark for 30 min such that adsorption–desorption equilibrium of the MV dye on the catalyst surface was achieved. After 1 h of UV irradiation, 2 mL of the suspension was withdrawn. The change in the MV concentration was monitored using a UV-vis spectrophotometer (Hach, USA) at a wavelength of 584 nm.where A0 is the MV concentration after adsorption equilibrium and before UV irradiation, and A is the MV concentration after irradiation.
Results and discussion
Catalyst characterization
Fig. 1 presents the XRD patterns of the Pd/TiO2 catalysts prepared using different Pd precursors and preparation methods. Pristine TiO2 and Pd/TiO2 exhibited distinct peaks of the anatase phase at 25.60°, 38.03°, 48.29°, 53.94°, 55.05°, 62.66°, and 68.93° corresponding to the Miller indices (101), (004), (105), (211), (204), (116), and (215), respectively.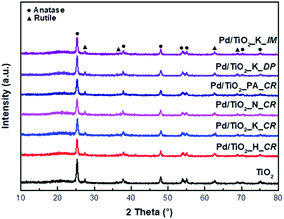 | ||
| Fig. 1 XRD patterns of TiO2 support and Pd/TiO2 catalysts prepared by different Pd precursors and preparation methods. | ||
Additionally, the XRD peaks of the rutile phase were observed at 27.45°, 36.09°, and 54.33° corresponding to the Miller indices (110), (101), and (111), respectively.14 In contrast, a decrease in intensity at 2θ = 25.60° was observed after the addition of Pd. This decrease was attributed to the presence of Pd atoms, which functioned as impurities or adatoms, resulting in a lower degree of crystallinity. Additionally, there were no distinct XRD peaks of Pd. This was probably because the Pd atoms were located in the bulk TiO2 crystals.
Fig. 2 shows the N2 adsorption–desorption isotherms of bare TiO2 and the Pd/TiO2 catalysts. According to the IUPAC classification, the adsorption isotherm of bare TiO2 was of type H4 and indicated slit-like pores. The adsorption–desorption isotherms of the Pd/TiO2 catalysts prepared changed into that of type H1 hysteresis and exhibited narrow distributions of relatively uniform mesopores. The BET surface areas, pore sizes, and pore volumes of the support and the catalysts prepared are listed in Table 1. The BET surface area of Pd/TiO2 decreased because the pores of TiO2 were filled with the NaOH used to adjust the pH values as well as the Pd nanoparticles.
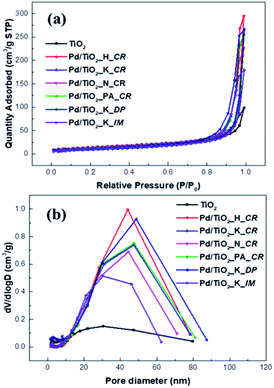 | ||
| Fig. 2 N2 adsorption–desorption curve (a) and pore size distribution (b) of TiO2 support and Pd/TiO2 catalysts. | ||
| Samples | Precursors | Preparation methods | SBET (m2 g−1) | Vmeso (cm3 g−1) | Vmicrod (cm3 g−1) | Dp (nm) |
|---|---|---|---|---|---|---|
| a CR: chemical reduction.b DP: deposition–precipitation.c IM: impregnation method.d Micropore volume calculated by the Horvath–Kawazoe (HK) method. | ||||||
| TiO2 | 51.21 | 0.131 | 0.019 | 12.56 | ||
| Pd/TiO2_H_CR | H2PdCl4 (H) | CRa | 50.10 | 0.436 | 0.019 | 33.58 |
| Pd/TiO2_K_CR | K2PdCl4 (K) | CR | 42.86 | 0.380 | 0.015 | 28.70 |
| Pd/TiO2_N_CR | Na2PdCl4 (N) | CR | 49.32 | 0.330 | 0.018 | 27.88 |
| Pd/TiO2_PA_CR | Pd(NH3)4Cl2·H2O (PA) | CR | 45.32 | 0.376 | 0.017 | 29.46 |
| Pd/TiO2_K_DP | K2PdCl4 (K) | DPb | 31.63 | 0.399 | 0.014 | 25.84 |
| Pd/TiO2_K_IM | K2PdCl4 (K) | IMc | 39.63 | 0.263 | 0.015 | 24.04 |
However, the pore size and pore volume calculated using the Barrett–Joyner–Halenda (BJH) model increased. The NaOH used as a precipitating agent blocked the pores and was then deposited on the outer surface of the TiO2 support.15 The BET surface area of the Pd/TiO2_K_IM catalyst drastically decreased as its pores collapsed during calcination.
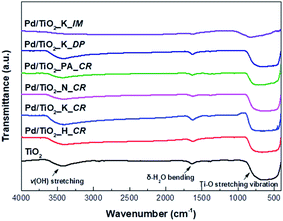
The FT-IR analysis was conducted to confirm the various functional groups present in the TiO2 support and Pd/TiO2 catalysts and the results are presented in Fig. 3. The FT-IR spectra was derived in the range 4000–400 cm−1. There were broad bands at 3700–3400 cm−1 and 750–520 cm−1, indicating v(OH) stretching and Ti–O stretching vibration, respectively. The weak bands at 1700 cm−1 corresponded to δ-H2O bending. In the case of Pd/TiO2_K_IM, the band intensities at all wavenumbers decreased owing to the collapse of its pores during calcination.
The CO-TPD profiles of the catalysts prepared using different Pd precursors and preparation methods are shown in Fig. 4. The CO-TPD intensity varied with the amount of active sites available for CO adsorption. Two shoulder CO desorption peaks at approximately 80 °C and 170 °C were observed for Pd/TiO2_K_CR and Pd/TiO2_K_DP, respectively. Desorption peaks corresponding to lower dispersion and larger crystalline size were exhibited at higher temperatures (Tdesorption > 227 °C) because of the lower Pd–CO bonding energy.14,15 Rieck et al. ascribed peaks at low temperatures (Tdesorption < 327 °C) and high temperatures (Tdesorption > 327 °C) to linear-bonded CO and bridge-bonded CO, respectively.18 Another study showed that the desorption of CO bound in the lower coordination sites on smaller Pd clusters occurred at lower temperatures owing to the weak intensity of the CO–Pd interaction.16,17 The weak desorption peak of Pd/TiO2_PA_CR shifted to a higher temperature (approximately 580 °C), which was assigned to the strong adsorption of CO and low metal dispersion. Consequently, the intensities of the TPD peaks were ascribed to two aspects: (i) influence of Pd particle size, and (ii) amount of linear-bonded CO species.
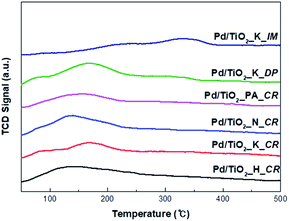 | ||
| Fig. 4 CO-TPD spectra of Pd/TiO2 catalysts (catalysts heating from 40 to 500 °C with heating rate of 5 °C min−1). | ||
The results of CO chemisorption are given in Table 2. The Pd dispersion of the catalysts synthesized varied from 0.74% to 12.42% depending on the nature of the precursor salt and the preparation method. The degree of dispersion using different Pd precursors followed the trend Pd/TiO2_K_CR > Pd/TiO2_H_CR > Pd/TiO2_N_CR > Pd/TiO2_PA_CR. Kettemann et al. revealed that Pd chloride precursors in aqueous solutions were mainly present in the form of [PdCl4]2− and [PdCl3(H2O)]−, which reacted with NaOH to form Pd(OH)2.19 It was further determined that Pd(OH)2 had strong interactions with the –OH groups present on the surface of the support, leading to higher Pd dispersion. We suggested that Pd dispersion was related to the formation rate of Pd(OH)2. When the CR method was employed in the present work, enhanced impregnation was achieved using the K2PdCl4 precursor whereas the lowest dispersion was attained with the impregnation of the Pd(NH3)4Cl2 precursor. Monteiro et al. reported that higher dispersion using chloride precursors (PdCl42−) was obtained owing to the stronger interaction between the Pd anions and the –OH groups on the support.20 Among K2PdCl4, H2PdCl4, and Na2PdCl4, K2PdCl4 may form polynuclear hydroxo complexes ([Pd(OH)2]n) more rapidly than the other two chloride precursors.19,21 This suggests that the smaller, hydrated Pd(OH)2 easily precipitates into the pores on the support while Pd(NH3)4Cl2 prevents the bulkier Pd2+ ion complexes from being deposited inside the pores. In addition, the Pd dispersion and crystallite size vary evidently with the preparation method. The dispersion of Pd/TiO2_K_CR (approximately 11%) and that of Pd/TiO2_K_DP (approximately 12%) were not significantly different. We supposed that the nucleation and growth rate of the Pd particles via ion exchange between the charged surface and Pd2+ ions in the CR and DP methods were similar.
| Catalysts | Metal dispersion (%) | Metallic surface area (m2 g−1 of metal) | Crystallite size (nm) |
|---|---|---|---|
| Pd/TiO2_H_CR | 8.01 | 35.70 | 14.00 |
| Pd/TiO2_K_CR | 11.16 | 46.70 | 10.04 |
| Pd/TiO2_N_CR | 5.14 | 22.89 | 21.81 |
| Pd/TiO2_PA_CR | 0.74 | 3.31 | 151.03 |
| Pd/TiO2_K_DP | 12.42 | 55.37 | 9.01 |
| Pd/TiO2_K_IM | 3.80 | 16.93 | 29.48 |
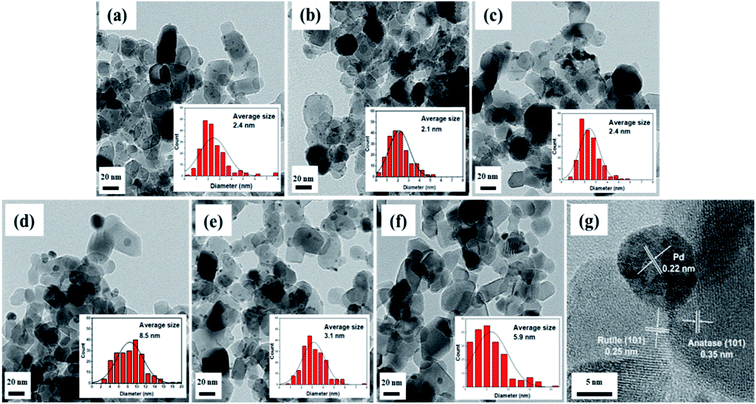
As shown in Fig. 5, field emission-transmission electron microscopy (FE-TEM) images were used to confirm the Pd particle sizes and distributions of the Pd/TiO2 catalysts prepared using different Pd precursors and preparation methods. The average Pd particle size was calculated based on a count of approximately 200 nanoparticles. When the catalysts were prepared via the CR method with different types of Pd precursors, the Pd particle size and distribution were influenced by the nature of the precursor. The average particle sizes of Pd/TiO2_K_CR and Pd/TiO2_N_CR were 2.1 nm and 3.5 nm, respectively. However, Pd/TiO2_PA_CR had the largest particle size and broadest Pd size distribution. This was because the ammoniacal salt had a weaker precursor–support interaction compared with those of the nitrate and chloride precursors, which, combined with its bulky size, prevented deeper penetration into the micropores. Among the Pd/TiO2_K catalysts prepared via the three preparation methods, Pd/TiO2_K_IM exhibited the broadest Pd particles and largest particle size of 5.9 nm owing to the chromatographic effect. Fig. 5b reveals that Pd/TiO2_K_DP had the smallest and most uniform Pd particles in agreement with the CO chemisorption results. The Pd particle size increased with Pd dispersion.
Fig. 6 and Table 3 show that the Pd 3d5/2 peak in the Pd/TiO2_K_CR spectrum is deconvoluted into two peaks observed at 333.4–334.9 eV (Pd0) and 335.8–336.2 eV (Pd2+), respectively.22 Despite the presence of a reducing agent, the Pd nanoparticles supported on TiO2 were not completely reduced owing to the strong interaction between them. The XPS results indicated that the binding energies (BEs) of the catalysts with higher dispersion shifted positively, which exhibited higher Pd/Ti atomic ratio. On the other hand, the peaks of the catalysts with lower dispersion exhibited lower Pd/Ti atomic ratio. A good correlation was observed between the BE values and the dispersion of Pd measured via CO chemisorption. Moreover, the Pd2+/Pd0 ratio of each catalyst was compared. In the case of the Pd/TiO2_K_DP and Pd/TiO2_K_CR catalysts with higher Pd dispersion, the Pd 3d5/2 peaks shifted to higher BE and exhibited not only the highest Pd/Ti atomic ratio but also the highest Pd2+/Pd0 ratio. However, the Pd/Ti atomic ratio of Pd/TiO2_PA_CR with the lowest Pd dispersion was much lower than that of Pd/TiO2_K_DP. The Pd 3d5/2 BE of Pd/TiO2_PA_CR was exhibited at 334.5 eV and 335.7 eV and the Pd0 peak area was much larger than the Pd2+ peak area. Mahata et al. proposed that the PA precursor has four ligands with NH3, which act as a reducing agent and facilitate the reduction of the Pd2+ ions.23 We suggested that the chemical state of Pd was influenced by the formation rate of Pd(OH)2 as well as the intensity of the Pd–O–Ti chemical bonding.
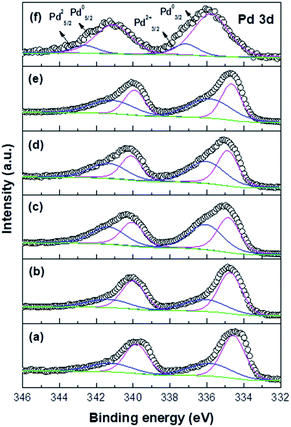 | ||
| Fig. 6 XPS spectra of Pd/TiO2 catalysts: (a) Pd/TiO2_PA_CR, (b) Pd/TiO2_N_CR, (c) Pd/TiO2_H_CR, (d) Pd/TiO2_K_CR, (e) Pd/TiO2_K_DP, and (f) Pd/TiO2_K_IM. | ||
| Catalysts | BEs of Pd 3d5/2 (eV) | Atomic ratio | ||
|---|---|---|---|---|
| Pd0 | Pd2+ | Pd2+/Pd0 | Pd/Ti | |
| Pd/TiO2_H_CR | 334.9 | 336.0 | 1.11 | 0.077 |
| Pd/TiO2_K_CR | 334.8 | 336.1 | 1.10 | 0.079 |
| Pd/TiO2_N_CR | 334.7 | 336.1 | 0.53 | 0.056 |
| Pd/TiO2_PA_CR | 334.5 | 335.7 | 0.54 | 0.040 |
| Pd/TiO2_K_DP | 334.7 | 335.9 | 1.14 | 0.079 |
| Pd/TiO2_K_IM | 335.8 | 337.2 | 0.19 | 0.032 |
When the Pd–O–Ti bond was formed, electrons were transferred from Pd to Ti at the Pd–O–Ti interface, forming the Pd2+ cationic species.24 The XPS results revealed that the shift in the Pd 3d5/2 BE was influenced not only by the Pd crystalline size but also by the intensity of the precursor–support interaction. We confirmed that stronger interaction caused a positive shift in the Pd 3d5/2 BE. The Pd chemical states of the catalysts prepared via several methods are listed in Table 3. The XPS spectrum of Pd/TiO2_K_IM displayed two peaks at 335.8 eV and 337.2 eV, which were attributed to the metallic Pd and PdCl2 moieties from the Pd precursor, respectively. This electronic state was clearly different than those of the catalysts prepared via the DP and CR methods.
The Tauc plots of the Pd/TiO2 catalysts were converted using the Kubelka–Munk method, as shown in Fig. S1.† The Tauc plot equation was used:
| αhν = A(hν − Eg)n, |
The direct band gap energy of each catalyst was estimated using the Tauc plot. The band gaps of all the Pd/TiO2 catalysts prepared were narrower than that of pristine TiO2, previously reported to be 3.2 eV.26,27 The band gaps of all the catalysts synthesized were in the range 2.88–3.03 eV. In other words, the catalysts absorbed visible light of wavelength 400–600 nm, resulting in the excitation of electrons in the valence band (VB) to the conduction band (CB) with lower energy. The band gap of Pd/TiO2_PA_CR was slightly lower than those of the catalysts synthesized using other Pd precursors. According to the quantum confinement theory, the band gap energy decreases with increase in nanoparticle size.28,29 However, Pd/TiO2_K_IM had a slightly higher band gap of 3.03 eV compared with those of the other catalysts. This might have been caused by the presence of the PdCl2 moieties, as discerned from the XPS results. Sivaraman et al. reported that Cl atoms as anionic dopants increased the band gap values and enabled abundant absorption of light in the shorter wavelength spectra.30 Thus, these UV-vis spectra results demonstrated that the band gap was influenced by the nanoparticle size and dopant state.
In order to identify the generation of the reactive oxygen species (ROS), the ESR spin trap with DMPO was performed.31 Fig. 7 displays the ESR spectra of the DMPO–˙OH adducts under UV irradiation for 5 min in the presence of Pd/TiO2 catalysts. DMPO aqueous solution was selected as the spin trapping agent of hydroxyl radicals. As shown in Fig. 7, the four peaks with 1![[thin space (1/6-em)]](https://www.rsc.org/images/entities/char_2009.gif) :
:![[thin space (1/6-em)]](https://www.rsc.org/images/entities/char_2009.gif) 2
2![[thin space (1/6-em)]](https://www.rsc.org/images/entities/char_2009.gif) :
:![[thin space (1/6-em)]](https://www.rsc.org/images/entities/char_2009.gif) 2
2![[thin space (1/6-em)]](https://www.rsc.org/images/entities/char_2009.gif) :
:![[thin space (1/6-em)]](https://www.rsc.org/images/entities/char_2009.gif) 1 intensity ratio were clearly observed except for Pd/TiO2_PA_CR under UV illumination. The ESR signals of Pd/TiO2_K_CR had the strongest intensities than other catalysts, which can generate more ˙OH radicals. This is ascribed to its smallest Pd particle size, leading to facilitate the rapid diffusion of the photoinduced carriers and reduce the recombination of the carriers. Thus, more ˙OH radicals could be formed by more electrons and holes and this result was consistent with the photocatalytic activity.
1 intensity ratio were clearly observed except for Pd/TiO2_PA_CR under UV illumination. The ESR signals of Pd/TiO2_K_CR had the strongest intensities than other catalysts, which can generate more ˙OH radicals. This is ascribed to its smallest Pd particle size, leading to facilitate the rapid diffusion of the photoinduced carriers and reduce the recombination of the carriers. Thus, more ˙OH radicals could be formed by more electrons and holes and this result was consistent with the photocatalytic activity.
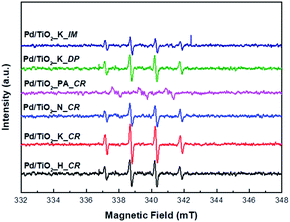 | ||
| Fig. 7 ESR spectra of the ˙OH radical adduct trapped by DMPO over the prepared Pd/TiO2 catalysts. All the spectra were measured after 5 min of UV light irradiation. | ||
Catalytic performance
The catalytic performance of the Pd/TiO2 catalysts prepared using different Pd precursors and preparation methods was evaluated based on their photocatalytic degradation of MV under UV irradiation. Fig. 8a shows the comparative decolorization of MV by all the catalysts in the dark and under UV irradiation.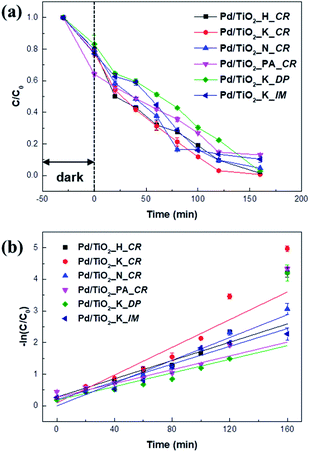 | ||
| Fig. 8 Photocatalytic activity of Pd/TiO2 catalysts for photodegradation of MV in dark and under UV light irradiation (a) and first-order fitting curves of the catalysts (b). | ||
In the dark, the MV concentration slightly decreased in all the cases because of its adsorption on the surfaces of the catalysts. While Pd/TiO2_K_DP showed the least absorption of 17% in the dark, Pd/TiO2_PA_CR revealed the highest absorption of 26%. The increased absorption could be due to its surface charge. Methyl violet is a cationic dye classified as a Lewis acid and can easily adsorb onto negatively charged surfaces.32 With the lower Pd2+/Pd0 of Pd/TiO2_PA_CR, it may be greatly absorb MV molecules due to its less repulsive interaction between MV molecules and the surface of the catalyst.
In Fig. 8, a remarkable improvement in degradation was observed under UV irradiation. The photocatalytic degradation rates under UV irradiation followed the trend Pd/TiO2_K_DP < Pd/TiO2_PA_CR < Pd/TiO2_K_IM < Pd/TiO2_H_CR < Pd/TiO2_N_CR < Pd/TiO2_K_CR. Although Pd dispersion of Pd/TiO2_K_CR (11.16%) had similar to Pd/TiO2_K_DP (12.42%), Pd/TiO2_K_CR showed the largest rate of reaction constant (k) of 0.02191 min−1 and 2.03 times higher than Pd/TiO2_K_DP. This could be that Pd/TiO2_K_DP had the lowest specific surface area and highest Pd2+/Pd0 ratio, resulting in lower absorption and mass transfer of MV molecules.33 Generally, the photocatalytic activity depends on the particle size of the metal, band gap, mesoporous volume, and surface area. Among the catalysts prepared using the H, K, and N precursors, Pd/TiO2_N_CR had the lowest activity owing to low Pd dispersion and mesopore volume. It is known that catalytic activity is additionally influenced by the dispersion of the metal nanoparticles.34–36 The low activity of Pd/TiO2_N_CR was attributed to its lower Pd dispersion and mesopore volume, which hindered charge transfer between the Pd nanoparticles and TiO2 support and mass transport.37,38
In the present work, the adsorption in the dark relied on the Pd2+/Pd0 ratio due to the electrostatic repulsion with the cationic dye. Furthermore, we found that the photodegradation performance under UV illumination were significantly dependent on Pd dispersion, Pd particle size, and specific surface area. Therefore, we can assume that the Pd2+/Pd0 ratio on the surface and the band gap are crucial factors influencing the photocatalytic degradation of MV.
Fig. 9 presents the effect of 5 wt% Pd/TiO2_K_CR catalyst amounts on the photocatalytic activity. To investigate the optimal catalyst amount, the catalyst amounts were varied from 0.5 g L−1 to 2.0 g L−1. The results revealed that the photocatalytic activity remarkably enhanced from 0.5 g L−1 to 1.0 g L−1. When the catalyst amount was 2.0 g L−1, the degradation curve was similar to 1.0 g L−1. 160 min was taken to sufficiently achieve the decolorization efficiency of 99.67%.
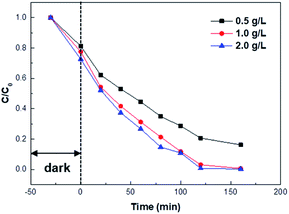 | ||
| Fig. 9 Photocatalytic degradation of MV at different catalyst amounts of Pd/TiO2_K_CR. C is the absorbance of MV at 584 nm. | ||
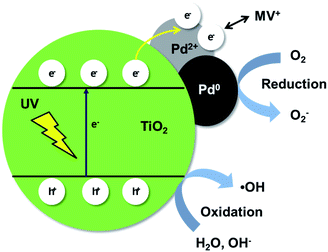
Based on the above results, a suggested mechanism of the photocatalytic degradation of MV by the Pd/TiO2 catalysts is depicted in Scheme 1 and represented by the following scheme.
| TiO2 + hν → e− + h+ | (1) |
| h+ + OH− → ˙OH | (2) |
| e− + O2 → O2˙− | (3) |
| h+ + H2O → OH˙ + H+ | (4) |
| ˙OH + MV → MV˙ + OH− | (5) |
| Dye + OH˙ → degradation products | (6) |
Water molecules compete with the MV dye molecules for adsorption onto the catalyst in the solution. Under UV irradiation, the electrons of TiO2 are elevated from the VB to the CB and holes are generated in the VB. The photoinduced electrons then migrate to the Pd nanoparticles working as scavengers, which act like electron traps and reduce the recombination of electron–hole pairs.38–40 The Pd2+ species on the catalyst are then reduced by the photoinduced electrons upon irradiation, which diminishes electrostatic repulsion. The free OH− on the surface of TiO2 captures the holes in the VB of TiO2 to produce the ˙OH radical.
A possible degradation pathways of MV are the destruction of MV chromophore structures and N-de-methylation.41,42 The produced ˙OH radical attack on MV and the cationic radical MV˙+. Then, MV˙+ was continuously degraded via attack of ˙OH radical and N-de-methylation, resulting in N,N-dimethylaminobenzene, aminobenzene, acetamide, 2-propenoic acid, etc. These are further mineralized into CO32− and NO32−.
Conclusions
We have shown that Pd dispersion and catalytic performance are remarkably affected by the type of Pd species in solution and catalyst preparation method. The catalytic performance was tested based on the photocatalytic degradation of MV. In particular, higher dispersion of Pd was obtained on the Pd/TiO2 catalyst prepared via the CR method with the K precursor compared with those achieved using other Pd precursors. The catalyst obtained via deposition–precipitation, i.e., Pd/TiO2_K_DP, exhibited the highest dispersion of 12.42% among those prepared via the three different methods. This was ascribed to the formation of Pd(OH)2, which exhibited strong interaction with the –OH group as well as a strong chemical bond of Pd–O–Ti. Further, the Pd2+/Pd0 ratio increased with Pd dispersion. The photocatalytic degradation of MV was chosen to evaluate the photocatalytic activities of Pd/TiO2 catalysts. Pd/TiO2_PA_CR showed the highest adsorption in the absence of UV light due to lower Pd2+/Pd0 ratio. It was found that high Pd2+/Pd0 ratio in dark condition adversely affected the absorption of MV owing to electrostatic repulsion between MV+ and metal nanoparticles. However, the Pd dispersion and the specific surface area played a key role in the photocatalytic activity under UV irradiation. Pd/TiO2_K_CR with higher Pd dispersion showed the highest photocatalytic activity and reaction rate of 0.0212 min−1.Conflicts of interest
There are no conflicts to declare.Acknowledgements
This work was supported by the Technology Innovation Program (20000126) funded by the Ministry of Trade, Industry & Energy (MOTIE, Korea), Korea Institute of Industrial Technology through Research and Development (EO-20-0014) and Ulsan Metropolitan City (IZ-20-0540).References
- J. S. Wu, C. H. Liu, K. H. Chu and S. Y. Suen, J. Membr. Sci., 2008, 309, 239–245 CrossRef CAS.
- R. Kant, Nat. Sci., 2012, 04, 22–26 CAS.
- T. A. Nguyen and R. S. Juang, Chem. Eng. J., 2013, 219, 109–117 CrossRef CAS.
- S. Chen, J. Zhang, C. Zhang, Q. Yue, Y. Li and C. Li, Desalination, 2010, 252, 149–156 CrossRef CAS.
- M. Solís, A. Solís, H. I. Pérez, N. Manjarrez and M. Flores, Process Biochem., 2012, 47, 1723–1748 CrossRef.
- A. Hethnawi, N. N. Nassar, A. D. Manasrah and G. Vitale, Chem. Eng. J., 2017, 320, 389–404 CrossRef CAS.
- C. K. C. Araújo, G. R. Oliveira, N. S. Fernandes, C. L. P. S. Zanta, S. S. L. Castro, D. R. da Silva and C. A. Martínez-Huitle, Environ. Sci. Pollut. Res., 2014, 21, 9777–9784 CrossRef.
- J. Wu, S. Lu, D. Ge, L. Zhang, W. Chen and H. Gu, RSC Adv., 2016, 6, 67502–67508 RSC.
- J. M. Walls, J. S. Sagu and K. G. Upul Wijayantha, RSC Adv., 2019, 9, 6387–6394 RSC.
- M. Y. Abdelaal and R. M. Mohamed, J. Alloys Compd., 2013, 576, 201–207 CrossRef CAS.
- H. Khojasteh, M. Salavati-Niasari, A. Abbasi, F. Azizi and M. Enhessari, J. Mater. Sci.: Mater. Electron., 2016, 27, 1261–1269 CrossRef CAS.
- Z. Wu, Z. Sheng, H. Wang and Y. Liu, Chemosphere, 2009, 77, 264–268 CrossRef CAS.
- X. Meng, Z. Li, N. Yun and Z. Zhang, J. Nanomater., 2018, 2018, 1234506 Search PubMed.
- K. K. Gupta, N. L. Singh, A. Pandey, S. K. Shukla, S. N. Upadayay, V. Mishra, P. Srivastava, N. P. Lalla and P. K. Mishra, J. Dispersion Sci. Technol., 2013, 34, 1043–1052 CrossRef CAS.
- H. Huang and D. Y. C. Leung, ACS Catal., 2011, 1, 348–354 CrossRef CAS.
- W. J. Shen, M. Okumura, Y. Matsumura and M. Haruta, Appl. Catal., A, 2001, 213, 225–232 CrossRef CAS.
- W. E. Kaden, W. A. Kunkel, F. S. Roberts, M. Kane and S. L. Anderson, J. Chem. Phys., 2012, 136, 204705 CrossRef.
- J. S. Rieck and A. T. Bell, J. Catal., 1987, 103, 46–54 CrossRef CAS.
- F. Kettemann, M. Wuithschick, G. Caputo, R. Kraehnert, N. Pinna, K. Rademann and J. Polte, CrystEngComm, 2015, 17, 1865–1870 RSC.
- R. S. Monteiro, L. C. Dieguez and M. Schmal, Catal. Today, 2001, 65, 77–89 CrossRef CAS.
- M. Turáková, M. Králik, P. Lehocký, Ľ. Pikna, M. Smrčová, D. Remeteiová and A. Hudák, Appl. Catal., A, 2014, 476, 103–112 CrossRef.
- L. M. Esteves, M. H. Brijaldo and F. B. Passos, J. Mol. Catal. A: Chem., 2016, 422, 275–288 CrossRef CAS.
- N. Mahata and V. Vishwanathan, J. Catal., 2000, 196, 262–270 CrossRef CAS.
- R. Gopinath, N. Seshu Babu, J. Vinod Kumar, N. Lingaiah and P. S. Sai Prasad, Catal. Lett., 2008, 120, 312–319 CrossRef CAS.
- E. Sanchez and T. Lopez, Mater. Lett., 1995, 25, 271–275 CrossRef CAS.
- J. F. Guayaquil-Sosa, B. Serrano-Rosales, P. J. Valadés-Pelayo and H. de Lasa, Appl. Catal., B, 2017, 211, 337–348 CrossRef CAS.
- K. I. Omoniyi, A. Aroh, C. Gimba, H. Abba and M. Yilleng, J. Sci. Technol., 2018, 10, 60–66 Search PubMed.
- X. Zhang, J. He, W. Chen, C. Wang, C. Zheng, J. Lin, X. Zheng and F. Huang, RSC Adv., 2014, 4, 34288–34293 RSC.
- E. O. Chukwuocha, M. C. Onyeaju and T. S. T. Harry, World J. Condens. Matter Phys., 2012, 2, 96–100 CrossRef CAS.
- T. Sivaraman, V. Narasimman, V. S. Nagarethinam and A. R. Balu, Prog. Nat. Sci.: Mater. Int., 2015, 25, 392–398 CrossRef CAS.
- P. Shao, S. Yu, X. Duan, L. Yang, H. Shi, L. Ding, J. Tian, L. Yang, X. Luo and S. Wang, Environ. Sci. Technol., 2020, 54, 8464–8472 CrossRef CAS.
- H. Puchtler, S. N. Meloan and M. Spencer, Histochemistry, 1985, 82, 301–306 CAS.
- F. Amano, K. Nogami, M. Tanaka and B. Ohtani, Langmuir, 2010, 26, 7174–7180 CrossRef CAS.
- L. Hou, M. Zhang, Z. Guan, Q. Li and J. Yang, J. Nanopart. Res., 2018, 20, 60 CrossRef.
- N. M. Gupta, S. V. Awate, A. A. Belhekar, S. V. Bhagwat and R. Kumar, Int. J. Photoenergy, 2008, 2008, 789149 Search PubMed.
- M. Y. Byun, D. W. Park and M. S. Lee, Catal. Today, 2020, 352, 88–94 CrossRef.
- I. Majeed, U. Manzoor, F. K. Kanodarwala, M. A. Nadeem, M. A. Nadeem, E. Hussain, H. Ali, A. Badshah and J. A. Stride, Catal. Sci. Technol., 2018, 8, 1183–1193 RSC.
- B. Fang, Y. Xing, A. Bonakdarpour, S. Zhang and D. P. Wilkinson, ACS Sustainable Chem. Eng., 2015, 3, 2381–2388 CrossRef CAS.
- J. Gomes, A. Lopes, K. Bednarczyk, M. Gmurek, M. Stelmachowski, A. Zaleska-Medynska, M. Quinta-Ferreira, R. Costa, R. Quinta-Ferreira and R. Martins, ChemEngineering, 2018, 2, 4 CrossRef.
- U. I. Gaya and A. H. Abdullah, J. Photochem. Photobiol., C, 2008, 9, 1–12 CrossRef CAS.
- Y.-H. B. Liao, J. X. Wang, J.-S. Lin, W.-H. Chung, W.-Y. Lin and C.-C. Chen, Catal. Today, 2011, 174, 148–159 CrossRef CAS.
- A. Bhattacharjee, M. Ahmaruzzaman, T. B. Devi and J. Nath, J. Photochem. Photobiol., A, 2016, 325, 116–124 CrossRef CAS.
Footnote |
| † Electronic supplementary information (ESI) available: Direct band gap calculation data. See DOI: 10.1039/d0ra07510h |
| This journal is © The Royal Society of Chemistry 2020 |


